The Solar Cycle
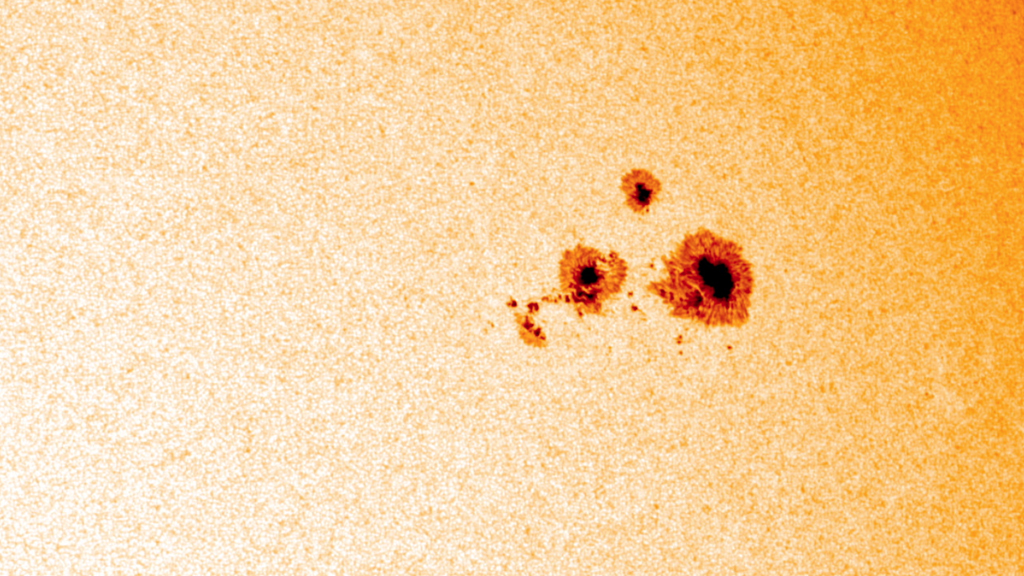
The number of sunspots increases and decreases over time in a regular, approximately 11-year cycle, called the sunspot cycle. The exact length of the cycle can vary. It has been as short as eight years and as long as fourteen, but the number of sunspots always increases over time, and then returns to low again.
More sunspots mean increased solar activity, when great blooms of radiation known as solar flares or bursts of solar material known as coronal mass ejections (CMEs) shoot off the sun's surface. The highest number of sun spots in any given cycle is designated "solar maximum," while the lowest number is designated "solar minimum." Each cycle, varies dramatically in intensity, with some solar maxima being so low as to be almost indistinguishable from the preceding minimum.
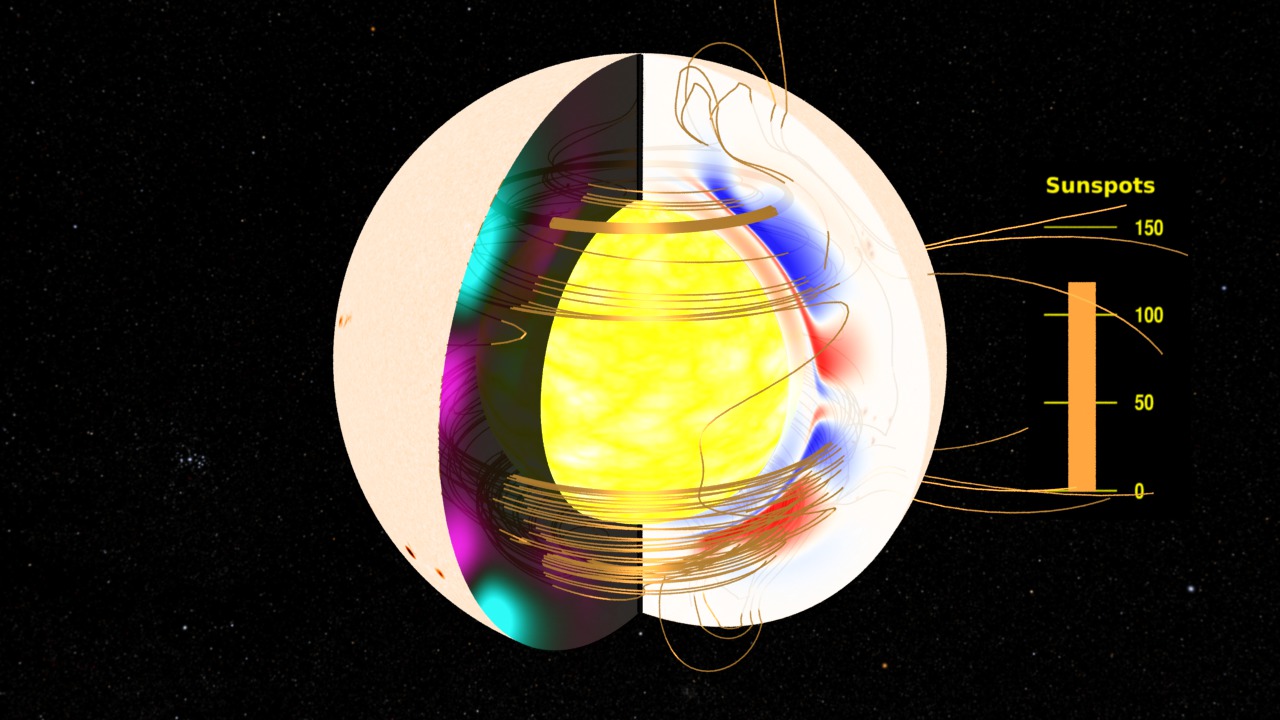
Sunspots are a magnetic phenomenon and the entire sun is magnetized with a north and a south magnetic pole just like a bar magnet. The comparison to a simple bar magnet ends there, however, as the sun's interior is constantly on the move.
By tracking sound waves that course through the center of the sun, an area of research known as helioseismology, scientists can gain an understanding of what's deep inside the sun. They have found that the magnetic material inside the sun is constantly stretching, twisting, and crossing as it bubbles up to the surface. The exact pattern of movements is not conclusively mapped out, but over time they eventually lead to the poles reversing completely.
The sunspot cycle happens because of this poles flip — north becomes south and south becomes north—approximately every 11 years. Some 11 years later, the poles reverse again back to where they started, making the full solar cycle actually a 22-year phenomenon. The sun behaves similarly over the course of each 11-year cycle no matter which pole is on top, however, so this shorter cycle tends to receive more attention.
Credits
Please give credit for this item to:
NASA/Goddard Space Flight Center
-
Animators
- Scott Wiessinger (USRA)
- Walt Feimer (HTSI)
- Tom Bridgman (Global Science and Technology, Inc.)
-
Video editor
- Scott Wiessinger (USRA)
-
Narrator
- Karen Fox (ADNET Systems, Inc.)
-
Producer
- Scott Wiessinger (USRA)
-
Videographer
- Rob Andreoli (Advocates in Manpower Management, Inc.)
-
Writers
- Karen Fox (ADNET Systems, Inc.)
- Scott Wiessinger (USRA)
Series
This page can be found in the following series:Tapes
The media on this page originally appeared on the following tapes:-
Solar Cycle
(ID: 2011082)
Monday, October 24, 2011 at 4:00AM
Produced by - Robert Crippen (NASA)
Related
- ID: 10834
 Produced Video
 - ID: 10846
Sources
- ID: 3521
 Visualization
Release date
This page was originally published on Thursday, October 27, 2011.
This page was last updated on Wednesday, May 3, 2023 at 1:53 PM EDT.