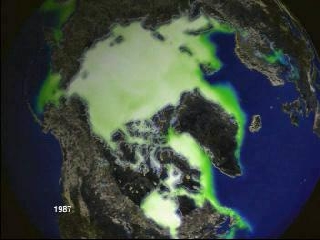
March Monthly Sea Ice Concentrations for 1979-1998 (Purple)
Arctic sea ice concentrations in March of each year from 1979 through 1998

Video slate image reads, "Oceans and Ice
March monthly sea ice concentrations for 1979-1998".
For More Information
Credits
Please give credit for this item to:
NASA/Goddard Space Flight Center
Scientific Visualization Studio
-
Animator
- Tom Biddlecome (Raytheon)
-
Scientist
- Claire Parkinson (NASA/GSFC)
Series
This page can be found in the following series:Datasets used
-
Sea Ice Concentrations (Sea Ice Concentrations from Nimbus-7 SMMR and DMSP SSM/I Passive Microwave Data) [Nimbus-7 and DMSP: SMMR and SSM/I]
ID: 640This data set is generated from brightness temperature data derived from Nimbus-7 Scanning Multichannel Microwave Radiometer (SMMR) and Defense Meteorological Satellite Program (DMSP) -F8, -F11 and -F13 Special Sensor Microwave/Imager (SSM/I) radiances at a grid cell size of 25 x 25 km. The data are provided in the polar stereographic projection.
This dataset can be found at: http://nsidc.org/data/nsidc-0051.html
See all pages that use this dataset
Note: While we identify the data sets used on this page, we do not store any further details, nor the data sets themselves on our site.
Alternate Versions
- ID: 1069
- ID: 1070
Release date
This page was originally published on Tuesday, May 30, 2000.
This page was last updated on Wednesday, May 3, 2023 at 1:58 PM EDT.