March Monthly Sea Ice Concentrations for 1979-1998 (White)
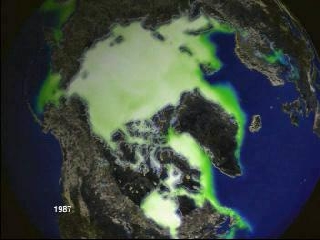
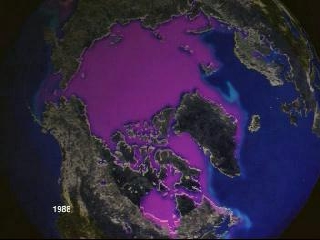
Arctic sea ice concentrations in March of each year from 1979 through 1998

Average arctic ice concentration for March, 1979
Average arctic ice concentration for March, 1998
World view without ice concentration data
Video slate image reads, "Oceans and Ice
March monthly sea ice concentrations for 1979 to 1998".
For More Information
Credits
Please give credit for this item to:
NASA/Goddard Space Flight Center
Scientific Visualization Studio
-
Animator
- Tom Biddlecome (Raytheon)
-
Scientist
- Claire Parkinson (NASA/GSFC)
Series
This page can be found in the following series:Datasets used
-
Sea Ice Concentrations (Sea Ice Concentrations from Nimbus-7 SMMR and DMSP SSM/I Passive Microwave Data) [Nimbus-7 and DMSP: SMMR and SSM/I]
ID: 640This data set is generated from brightness temperature data derived from Nimbus-7 Scanning Multichannel Microwave Radiometer (SMMR) and Defense Meteorological Satellite Program (DMSP) -F8, -F11 and -F13 Special Sensor Microwave/Imager (SSM/I) radiances at a grid cell size of 25 x 25 km. The data are provided in the polar stereographic projection.
This dataset can be found at: http://nsidc.org/data/nsidc-0051.html
See all pages that use this dataset
Note: While we identify the data sets used on this page, we do not store any further details, nor the data sets themselves on our site.
Alternate Versions
- ID: 1070
- ID: 1071
Release date
This page was originally published on Tuesday, May 30, 2000.
This page was last updated on Wednesday, May 3, 2023 at 1:58 PM EDT.