Sea Surface Temperature and Hurricane Connections: GOES - August 22, 1998 Through September 3, 1998
For years scientists have known of the strong correlation between sea surface temperature and the intensity of hurricanes. But one of the major stumbling blocks for forecasters has been the precise measurement of those temperatures when a storm begins to form. Traditional techniques for sea surface temperature measurement can not see through clouds.
Now researchers using the TRMM (Tropical Rainfall Measuring Mission) satellite have developed a technique for looking through clouds that is likely to enhance forecasters' abilities to predict hurricane intensity before their massive energies fully develop. A hurricane gathers energy from warm waters found in tropical latitudes.
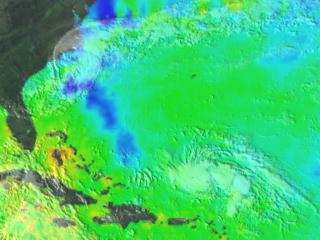
As Hurricane Bonnie crosses the Atlantic, it leaves a cooler trail of water in its wake. As Hurricane Danielle crosses Bonnie's path, the wind speed of the second storm drops markedly, as available energy to fuel the storm's engine drops off. As Danielle crosses Bonnie's wake, however, winds speeds increase due to temperature increases in surface water around the storm.
An animation of clouds from GOES in the Atlantic from August 22, 1998 through September 3, 1998 showing first Hurricane Bonnie and then Hurricane Danielle. The ocean is cooled by the passage of Hurricane Bonnie causing a decrease in the wind speed in Hurricane Danielle.

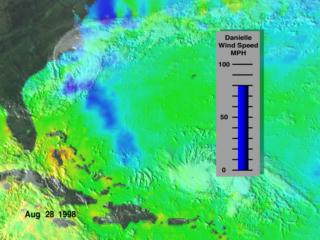
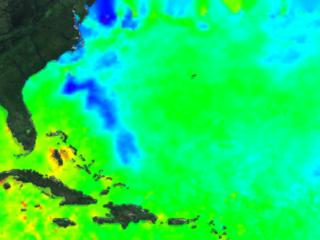
Hurricanes Bonnie and Danielle from GOES-8 on August 28, 1998
Video slate image reads, "Sea Surface Temperature and Hurricane Connections (GOES imagery only)".
For More Information
Credits
Please give credit for this item to:
NASA/Goddard Space Flight Center
Scientific Visualization Studio
-
Animators
- Tom Bridgman (Global Science and Technology, Inc.)
-
Greg Shirah
(NASA/GSFC)

-
Scientist
- Dennis Chesters (NASA/GSFC)
Series
This page can be found in the following series:Datasets used
-
[GOES-8]
ID: 29
Note: While we identify the data sets used on this page, we do not store any further details, nor the data sets themselves on our site.
Related
- ID: 1065
- ID: 1066
- ID: 1068
Release date
This page was originally published on Thursday, May 4, 2000.
This page was last updated on Wednesday, May 3, 2023 at 1:58 PM EDT.