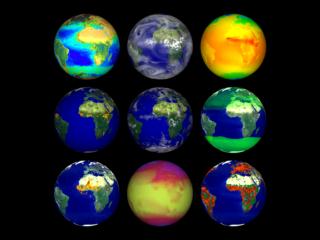
Nine Datasets on a Single Globe with Wipe Between Different Datasets Run as a Continuous Two Minute Loop
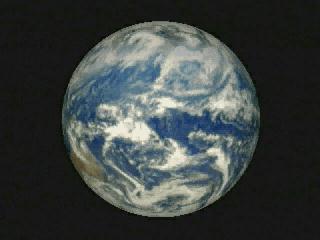
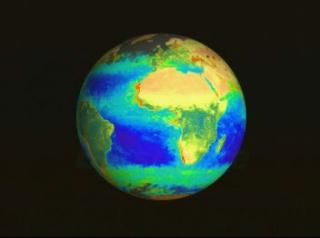
Single globe with wipe between different data sets run as a continuous 2 minute loop. Sequence: Galileo, radiant energy (Globe), vegetation index anomalies, temperature (globe), fires, aerosols (TOMS), clouds (GOES 9 and 10, Meteosat, and GMS-5), methane (UARS), water vapor (GOES 9 and 10, Meteosat, and GMS-5), biosphere (SeaStar/SeaWiFS), Galileo
Movie with the nine datasets synchronized so it can be run as a continuous loop.
Credits
Please give credit for this item to:
NASA/Goddard Space Flight Center, The SeaWiFS Project and GeoEye, Scientific Visualization Studio. NOTE: All SeaWiFS images and data presented on this web site are for research and educational use only. All commercial use of SeaWiFS data must be coordinated with GeoEye (NOTE: In January 2013, DigitalGlobe and GeoEye combined to become DigitalGlobe).
-
Animators
- Tom Bridgman (Global Science and Technology, Inc.)
-
Greg Shirah
(NASA/GSFC)

-
Scientist
- Yoram Kaufman (NASA/GSFC)
Missions
This page is related to the following missions:Series
This page can be found in the following series:Datasets used
-
[Earth Probe: TOMS]
ID: 17 -
[GMS-5]
ID: 21 -
[GOES-10]
ID: 23 -
[GOES-9]
ID: 31 -
[Galileo: Solid-State Imaging Camera]
ID: 34 -
[Meteosat]
ID: 64 -
[NOAA: AVHRR]
ID: 74 -
[SeaStar: SeaWiFS]
ID: 100NOTE: All SeaWiFS images and data presented on this web site are for research and educational use only. All commercial use of SeaWiFS data must be coordinated with GeoEye
Credit: NASA/Goddard Space Flight Center, The SeaWiFS Project and GeoEye, Scientific Visualization Studio. NOTE: All SeaWiFS images and data presented on this web site are for research and educational use only. All commercial use of SeaWiFS data must be coordinated with GeoEye (NOTE: In January 2013, DigitalGlobe and GeoEye combined to become one DigitalGlobe.).
See all pages that use this dataset -
[UARS]
ID: 118 -
Fires [NOAA-14: AVHRR]
ID: 432
Note: While we identify the data sets used on this page, we do not store any further details, nor the data sets themselves on our site.
Alternate Versions
- ID: 1011
- ID: 1013
 Visualization
 - ID: 1014
 Visualization
Release date
This page was originally published on Wednesday, November 10, 1999.
This page was last updated on Wednesday, May 3, 2023 at 1:58 PM EDT.