Next Tape

Goddard TV Video Tape: G1998-045


Movie

Title

The evolution of the ozone hole over Antarctica as shown through measurements of average ozone for September for the years 1979 through 1998, excluding 1995.  These measurements were made by the TOMS instruments on Nimbus-7, Meteor-3 and Earth Probe.  Dark blue represent regions of low ozone and red represents regions of high ozone. 
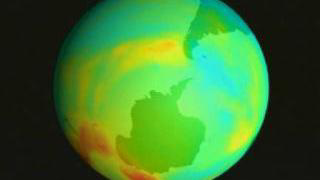
Average September Ozone Levels over Antarctica for 1979 to 1998
Total ozone over Antarctica for the period July 1, 1998 through October 1, 1998 as measured by Earth Probe TOMS.  Dark blue represents regions of low ozone and red represents regions of high ozone. Total Ozone over Antarctica from TOMS: July 1, 1998 through October 1, 1998 (Without Dates)
Total ozone over Antarctica for the period July 1, 1998 through October 1, 1998 as measured by Earth Probe TOMS.  Dark blue represents regions of low ozone and red represents regions of high ozone. Total Ozone over Antarctica from TOMS: Jul 1, 1998 through Oct 1, 1998 Rotation to Pole without Dates
Total ozone over Antarctica for the period July 1, 1998 through October 1, 1998 as measured by Earth Probe TOMS.  Dark blue represent regions of low ozone and red represents regions of high ozone. 
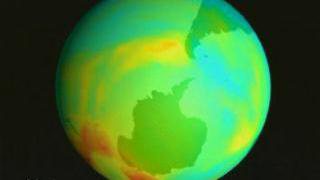
Total Ozone over Antarctica from TOMS: July 1, 1998 through October 1, 1998 (With Dates)
Total ozone over Antarctica for the period July 1, 1998 through October 1, 1998 as measured by Earth Probe TOMS.  Dark blue represents regions of low ozone and red represents regions of high ozone. Total Ozone over Antarctica from TOMS: Jul 1, 1998 through Oct 1, 1998 (Rotation to Pole with Dates)