Sun
ID: 695
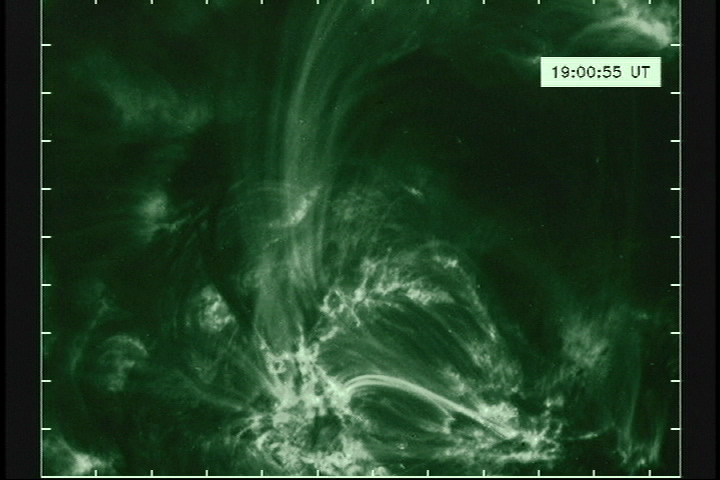
TRACE: 195 Ångstrom Wavelength Image Showing MOSS Shockwave.
For More Information
Visualization Credits
Please give credit for this item to:
NASA/Goddard Space Flight Center Scientific Visualization Studio
NASA/Goddard Space Flight Center Scientific Visualization Studio
Short URL to share this page:
https://svs.gsfc.nasa.gov/695
Mission:
TRACE
Data Used:
Note: While we identify the data sets used in these visualizations, we do not store any further details nor the data sets themselves on our site.
This item is part of this series:
TRACE
Keywords:
DLESE >> Space science
SVS >> TRACE
NASA Science >> Sun
https://svs.gsfc.nasa.gov/695
Mission:
TRACE
Data Used:
TRACE
1999/08/01
The TRACE satellite views the Sun at ultraviolet wavelengths with high temporal (approximately 1-12 seconds) and spatial (1 arcsecond per pixel) resolution. Launched on April 2, 1998, it orbits the Earth in a Sun-synchronous orbit.
This item is part of this series:
TRACE
Keywords:
DLESE >> Space science
SVS >> TRACE
NASA Science >> Sun


