Earth
ID: 67
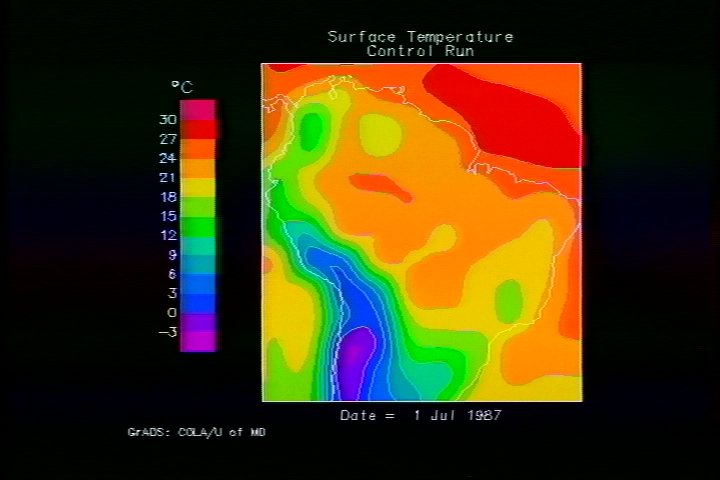
This series of animations depicts the results of a computer simulation of the effects of deforestation on the surface temperature and precipitation in the Amazon region. Six animations are shown - a control simulation, a deforestation simulation, and the difference between the two for both surface temperature and rainfall. The period simulated is the second half of 1987.
Amazon Deforestation Model
Visualization Credits
Please give credit for this item to:
NASA/Goddard Space Flight Center Scientific Visualization Studio
NASA/Goddard Space Flight Center Scientific Visualization Studio
Short URL to share this page:
https://svs.gsfc.nasa.gov/67
Dates of Data Used:
1987/07/01-1987/12/29
Keywords:
DLESE >> Environmental science
GCMD >> Earth Science >> Human Dimensions >> Habitat Conversion/Fragmentation >> Deforestation
GCMD >> Location >> Amazonia
NASA Science >> Earth
GCMD keywords can be found on the Internet with the following citation: Olsen, L.M., G. Major, K. Shein, J. Scialdone, S. Ritz, T. Stevens, M. Morahan, A. Aleman, R. Vogel, S. Leicester, H. Weir, M. Meaux, S. Grebas, C.Solomon, M. Holland, T. Northcutt, R. A. Restrepo, R. Bilodeau, 2013. NASA/Global Change Master Directory (GCMD) Earth Science Keywords. Version 8.0.0.0.0


