Life Histories from Landsat: 25 Years in the Pacific Northwest Forest — North/South Tour
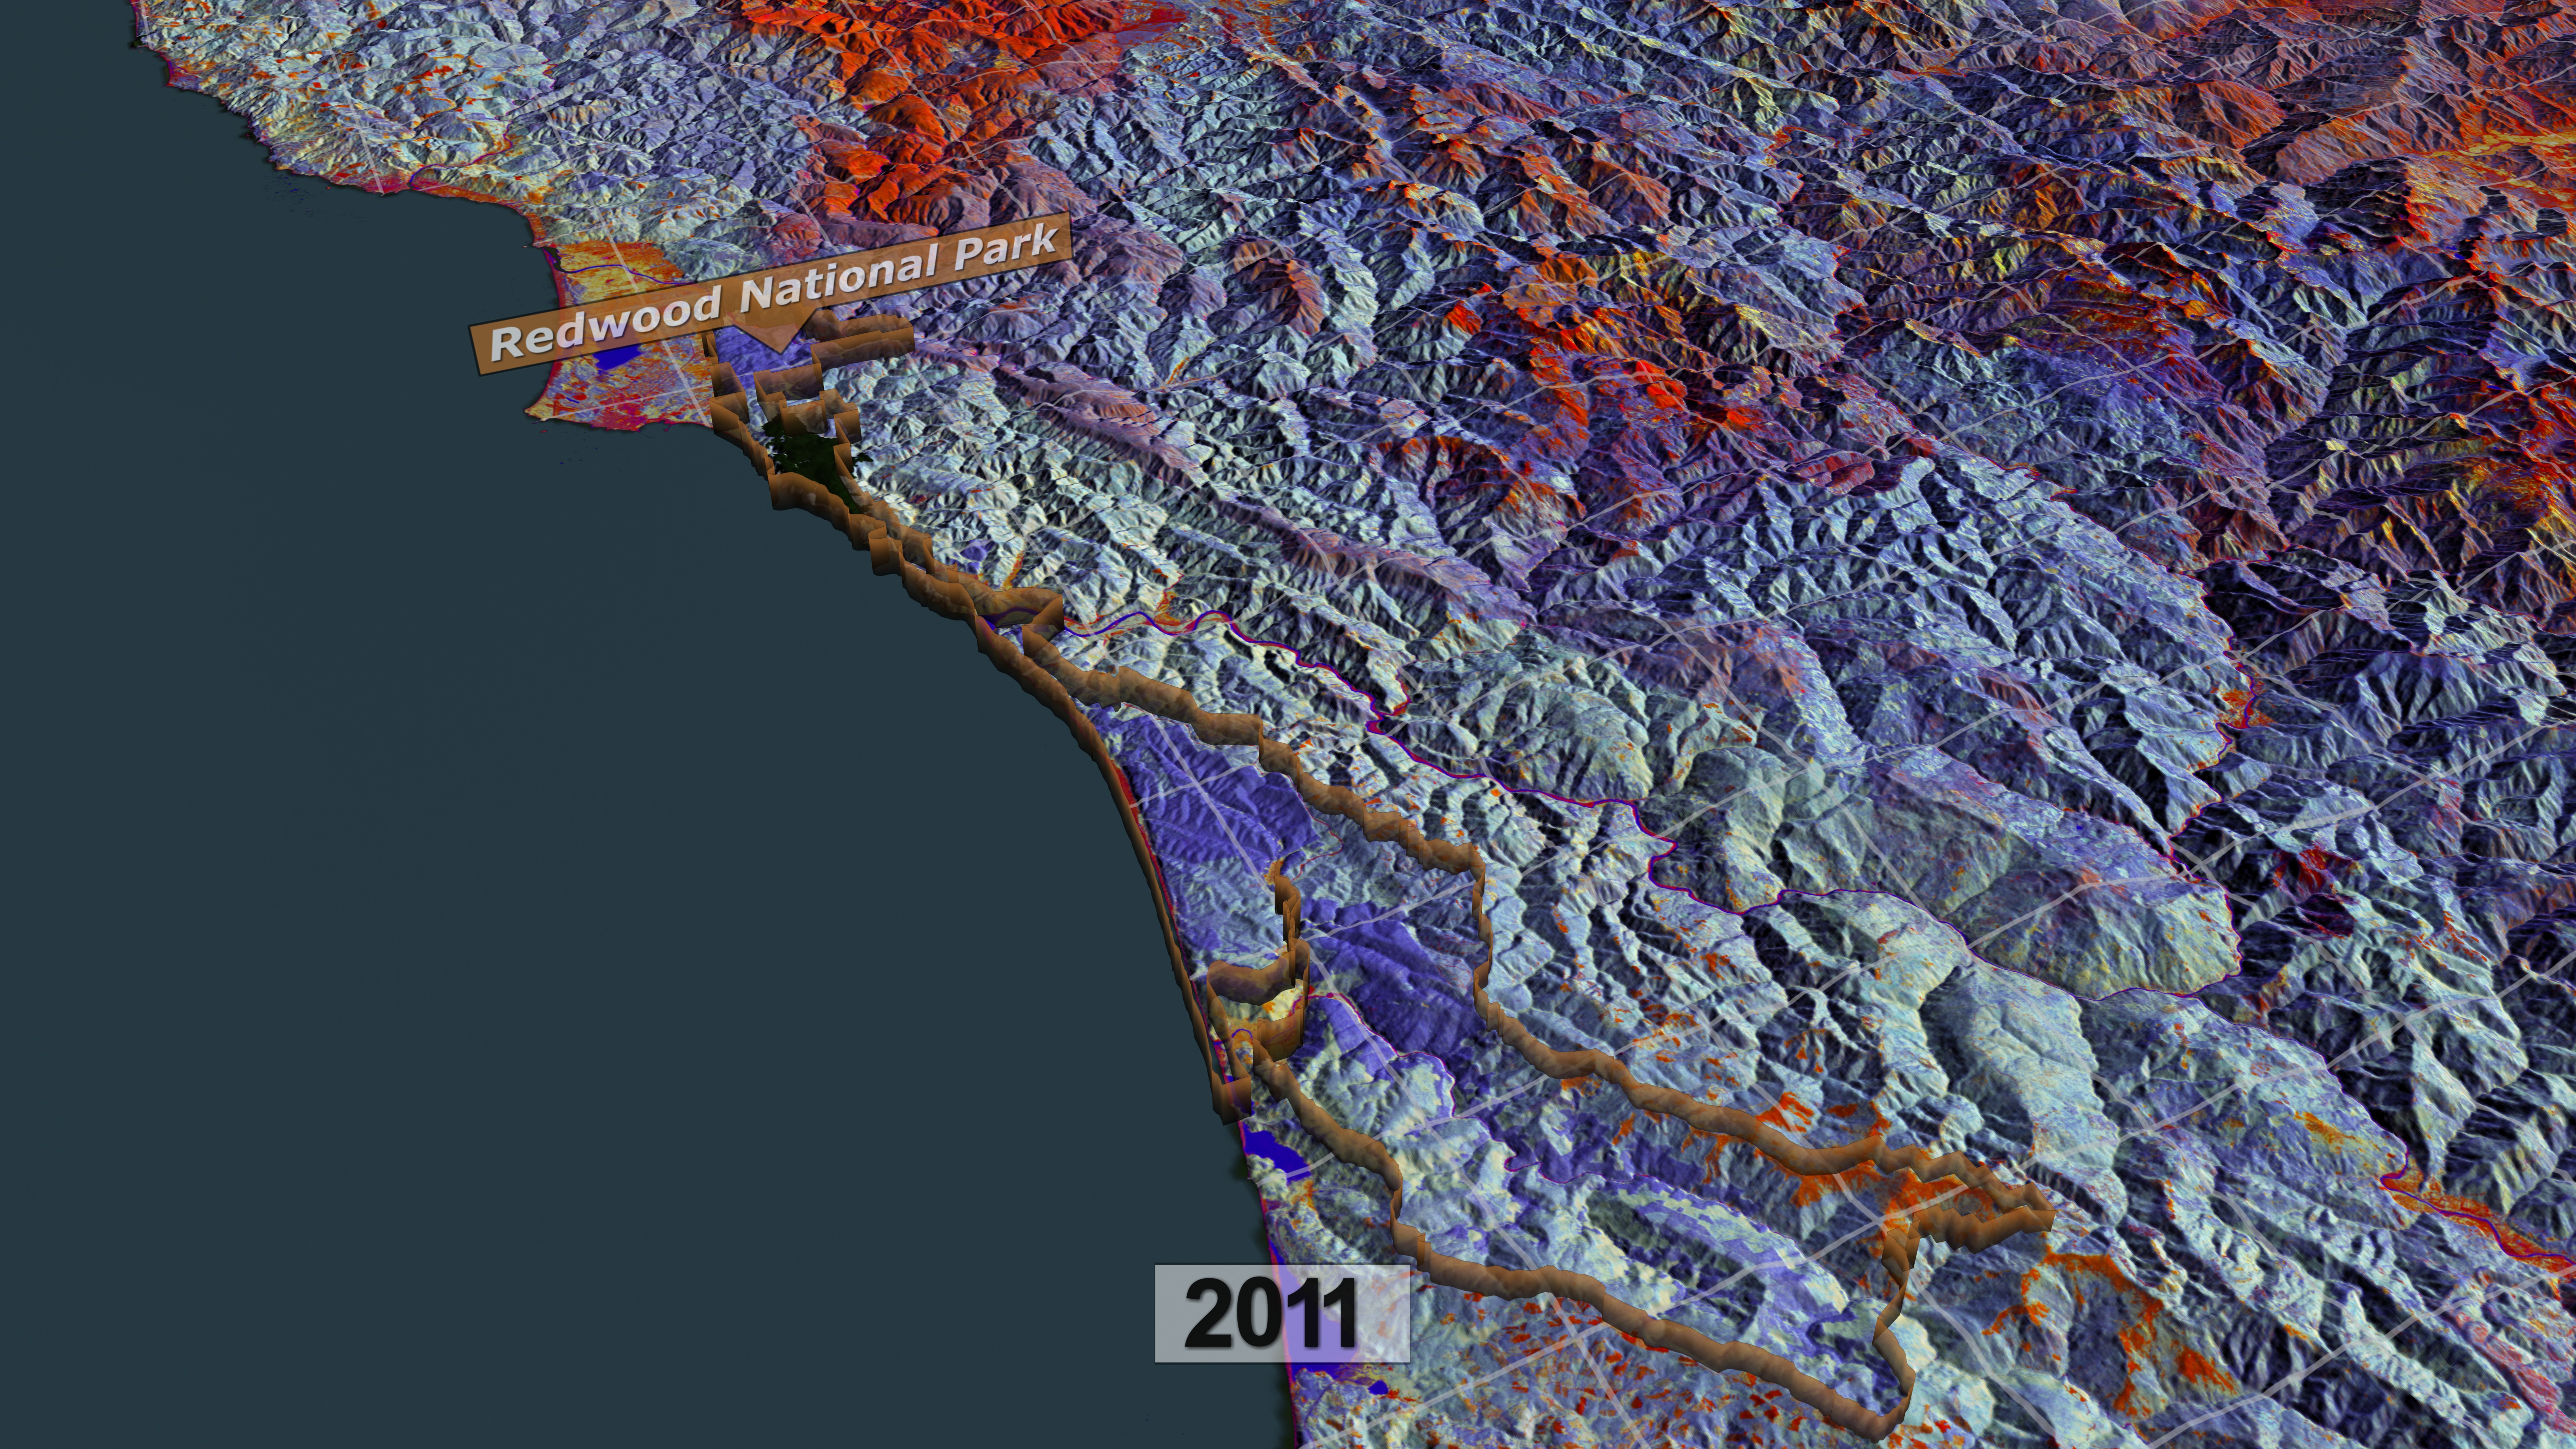
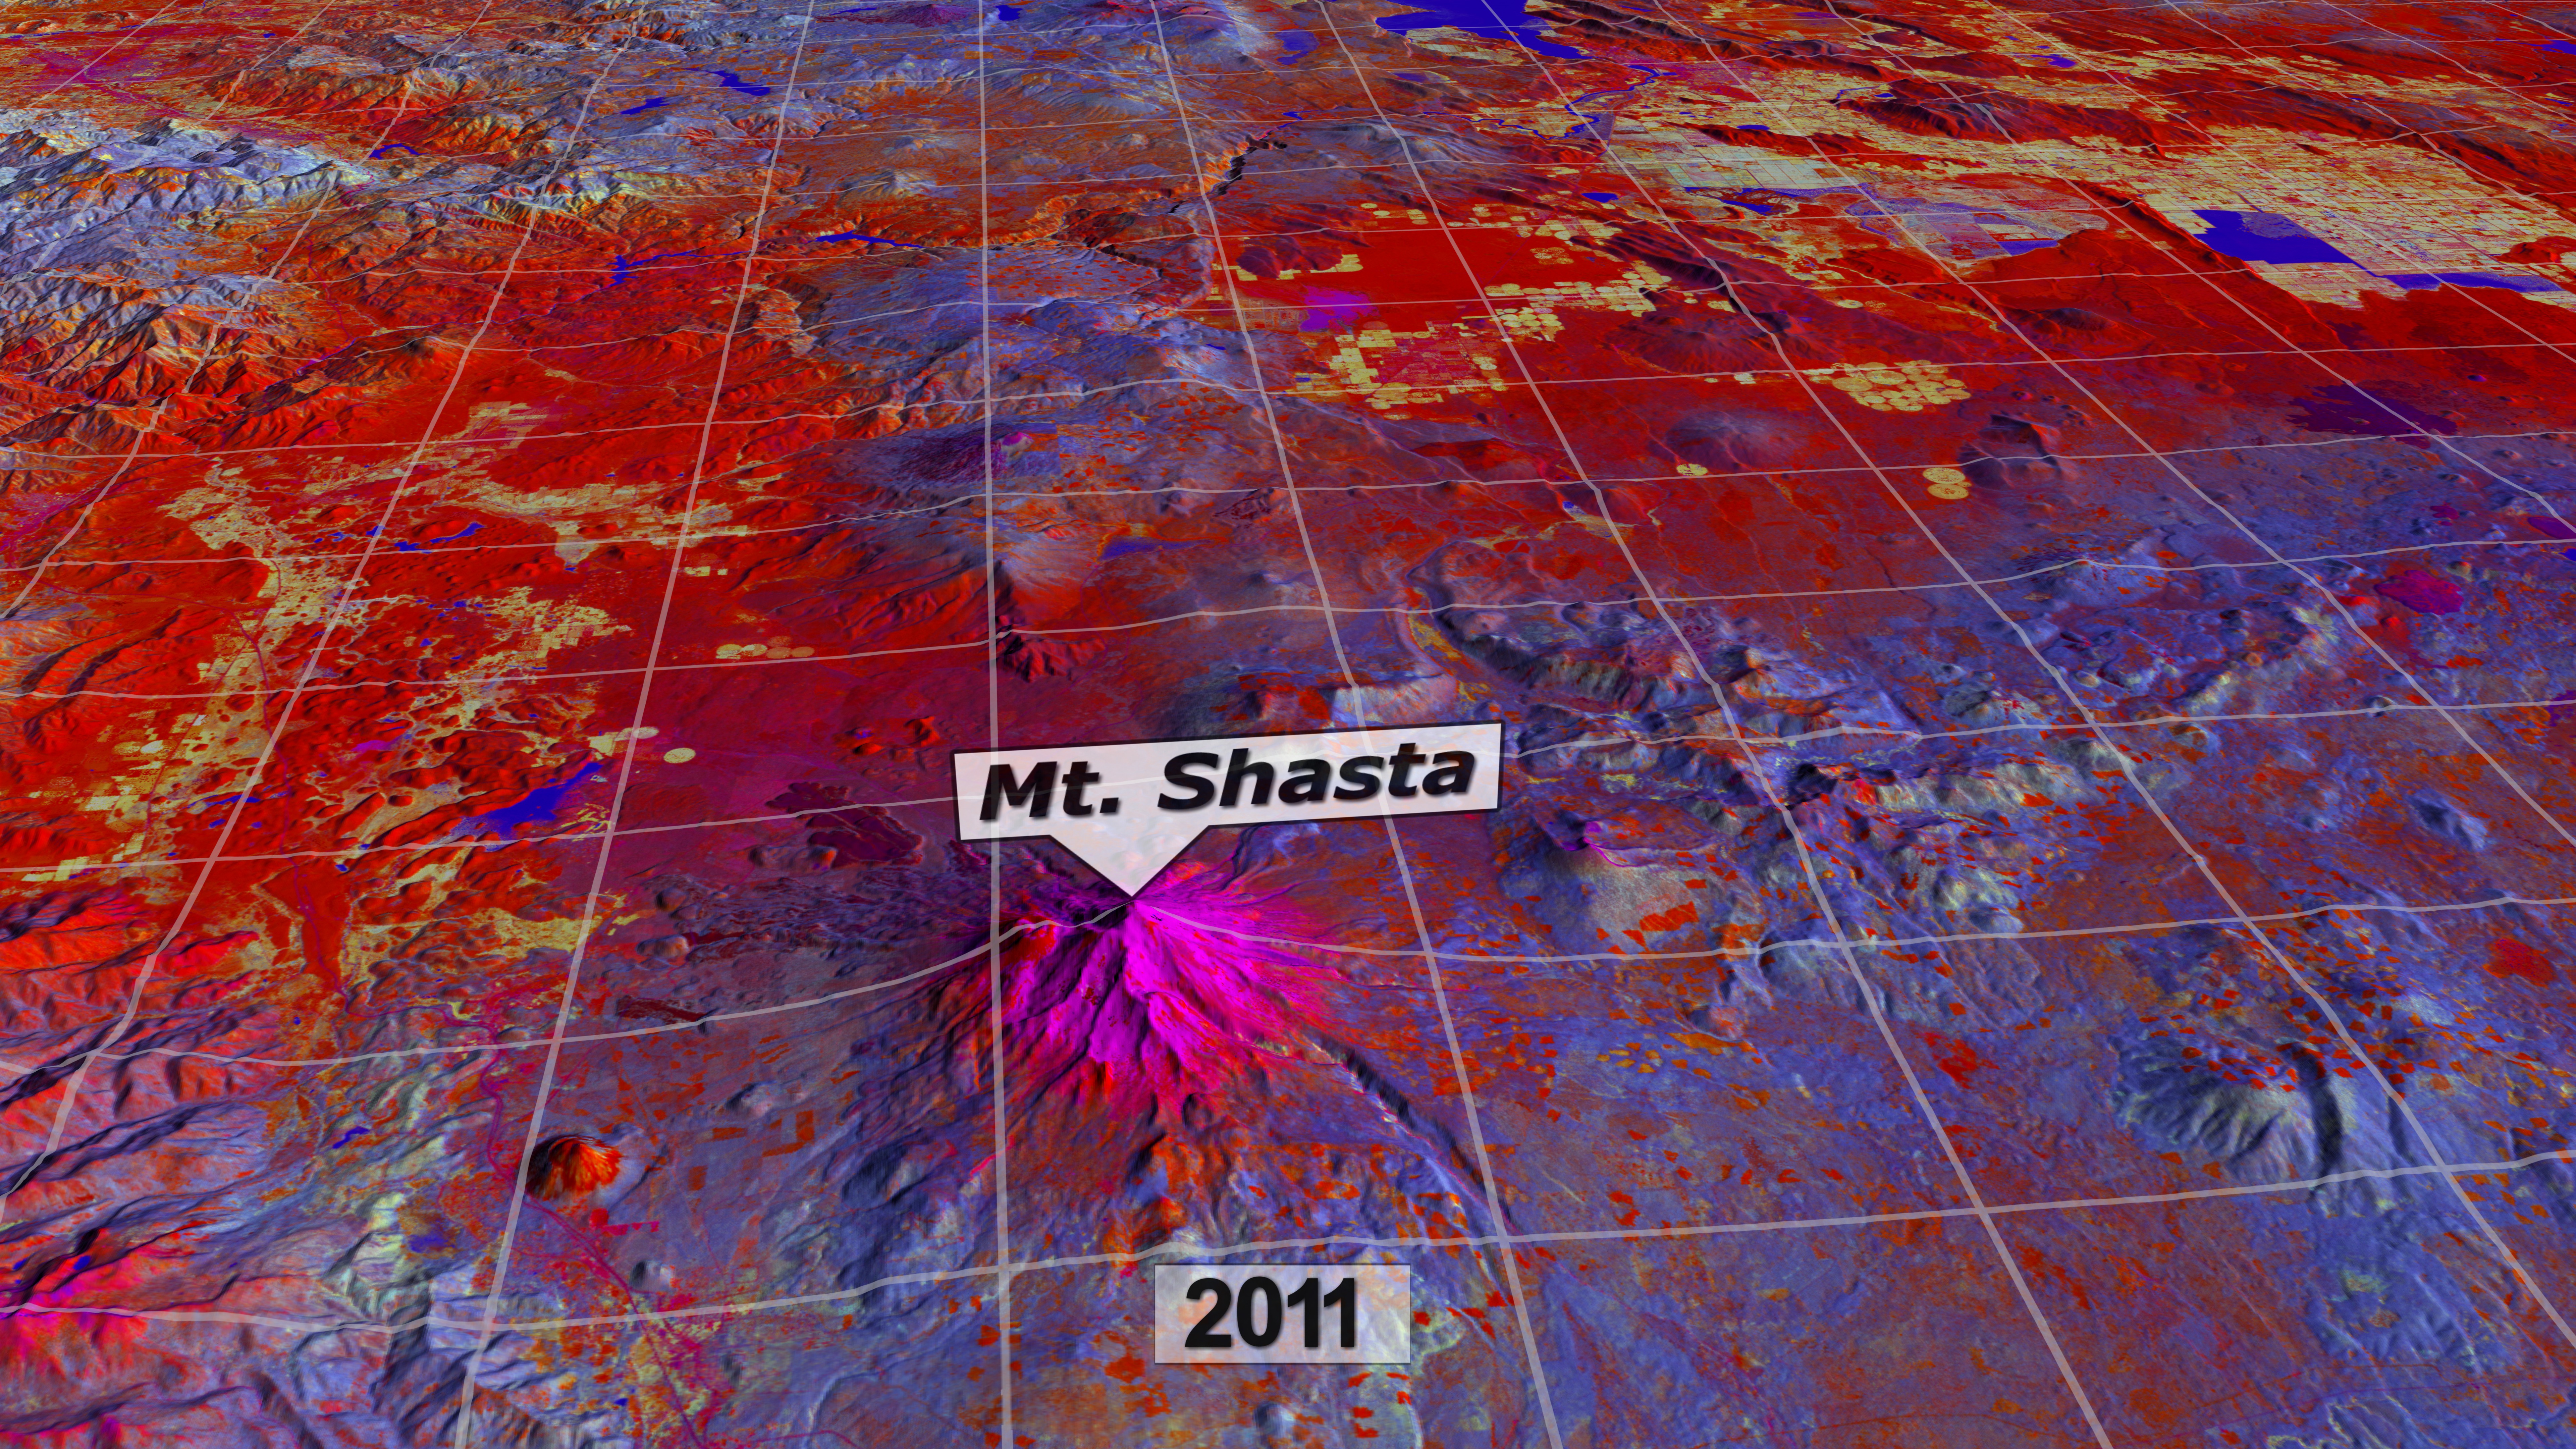
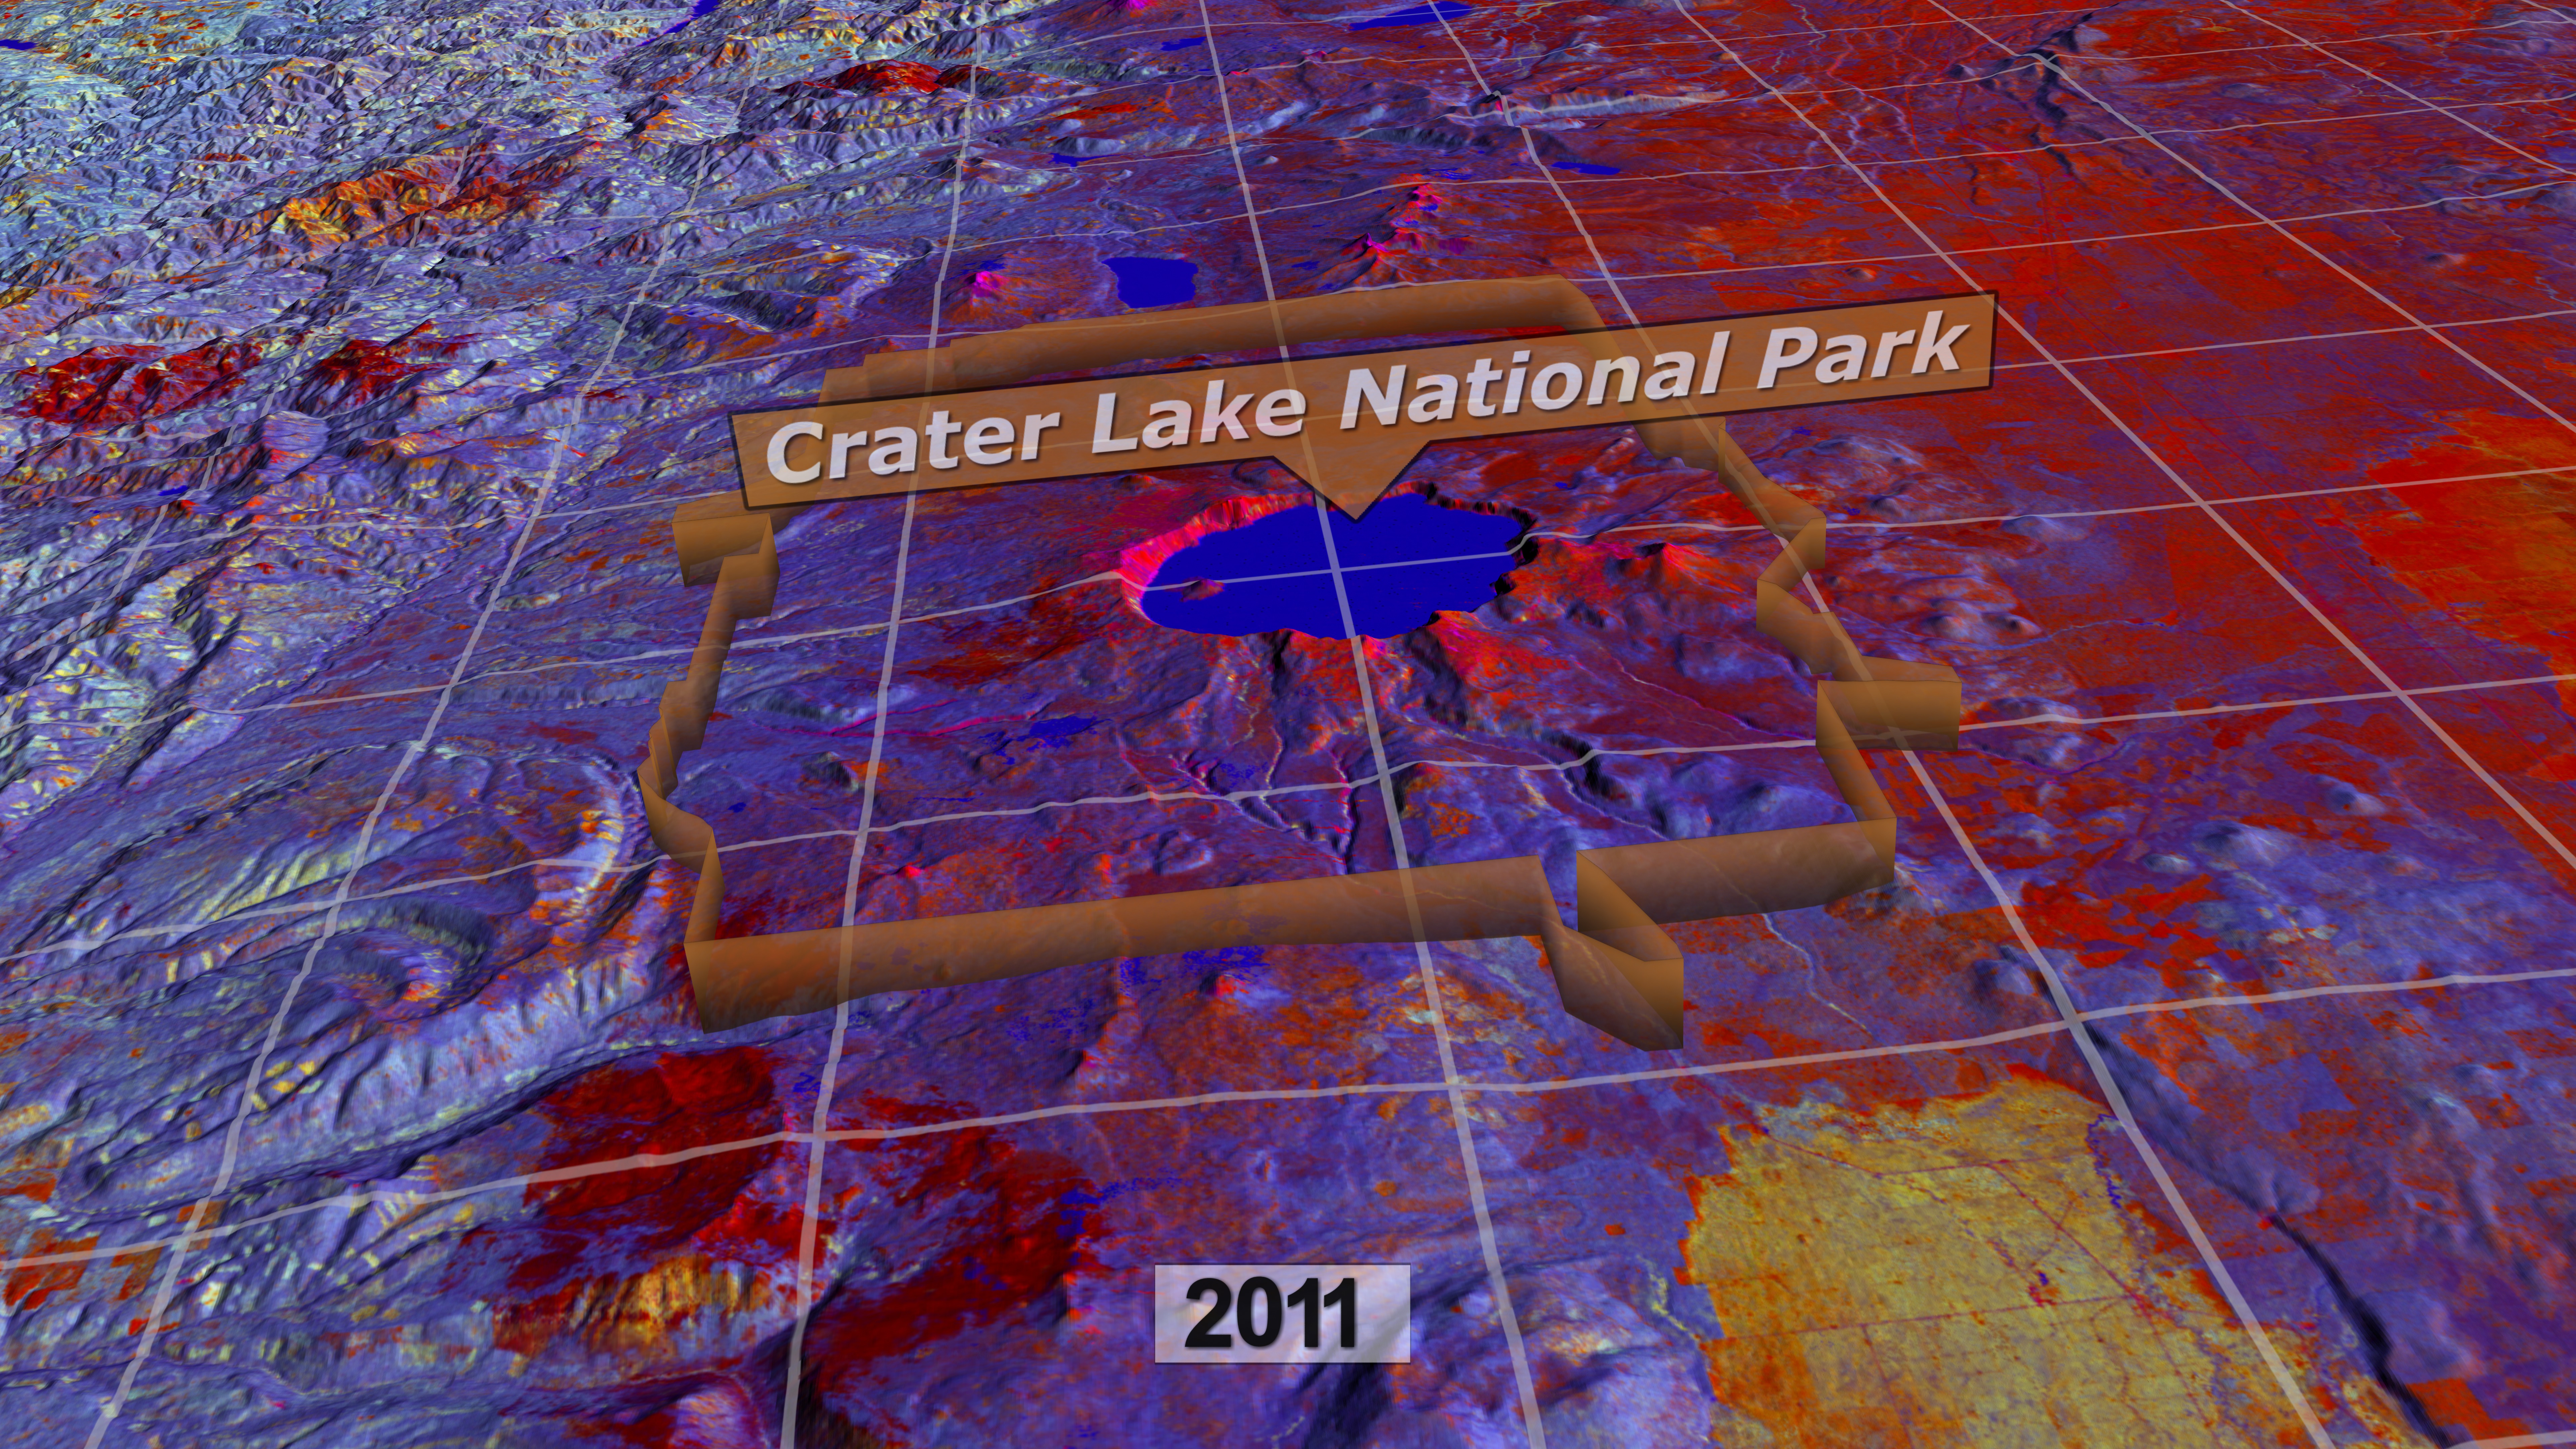
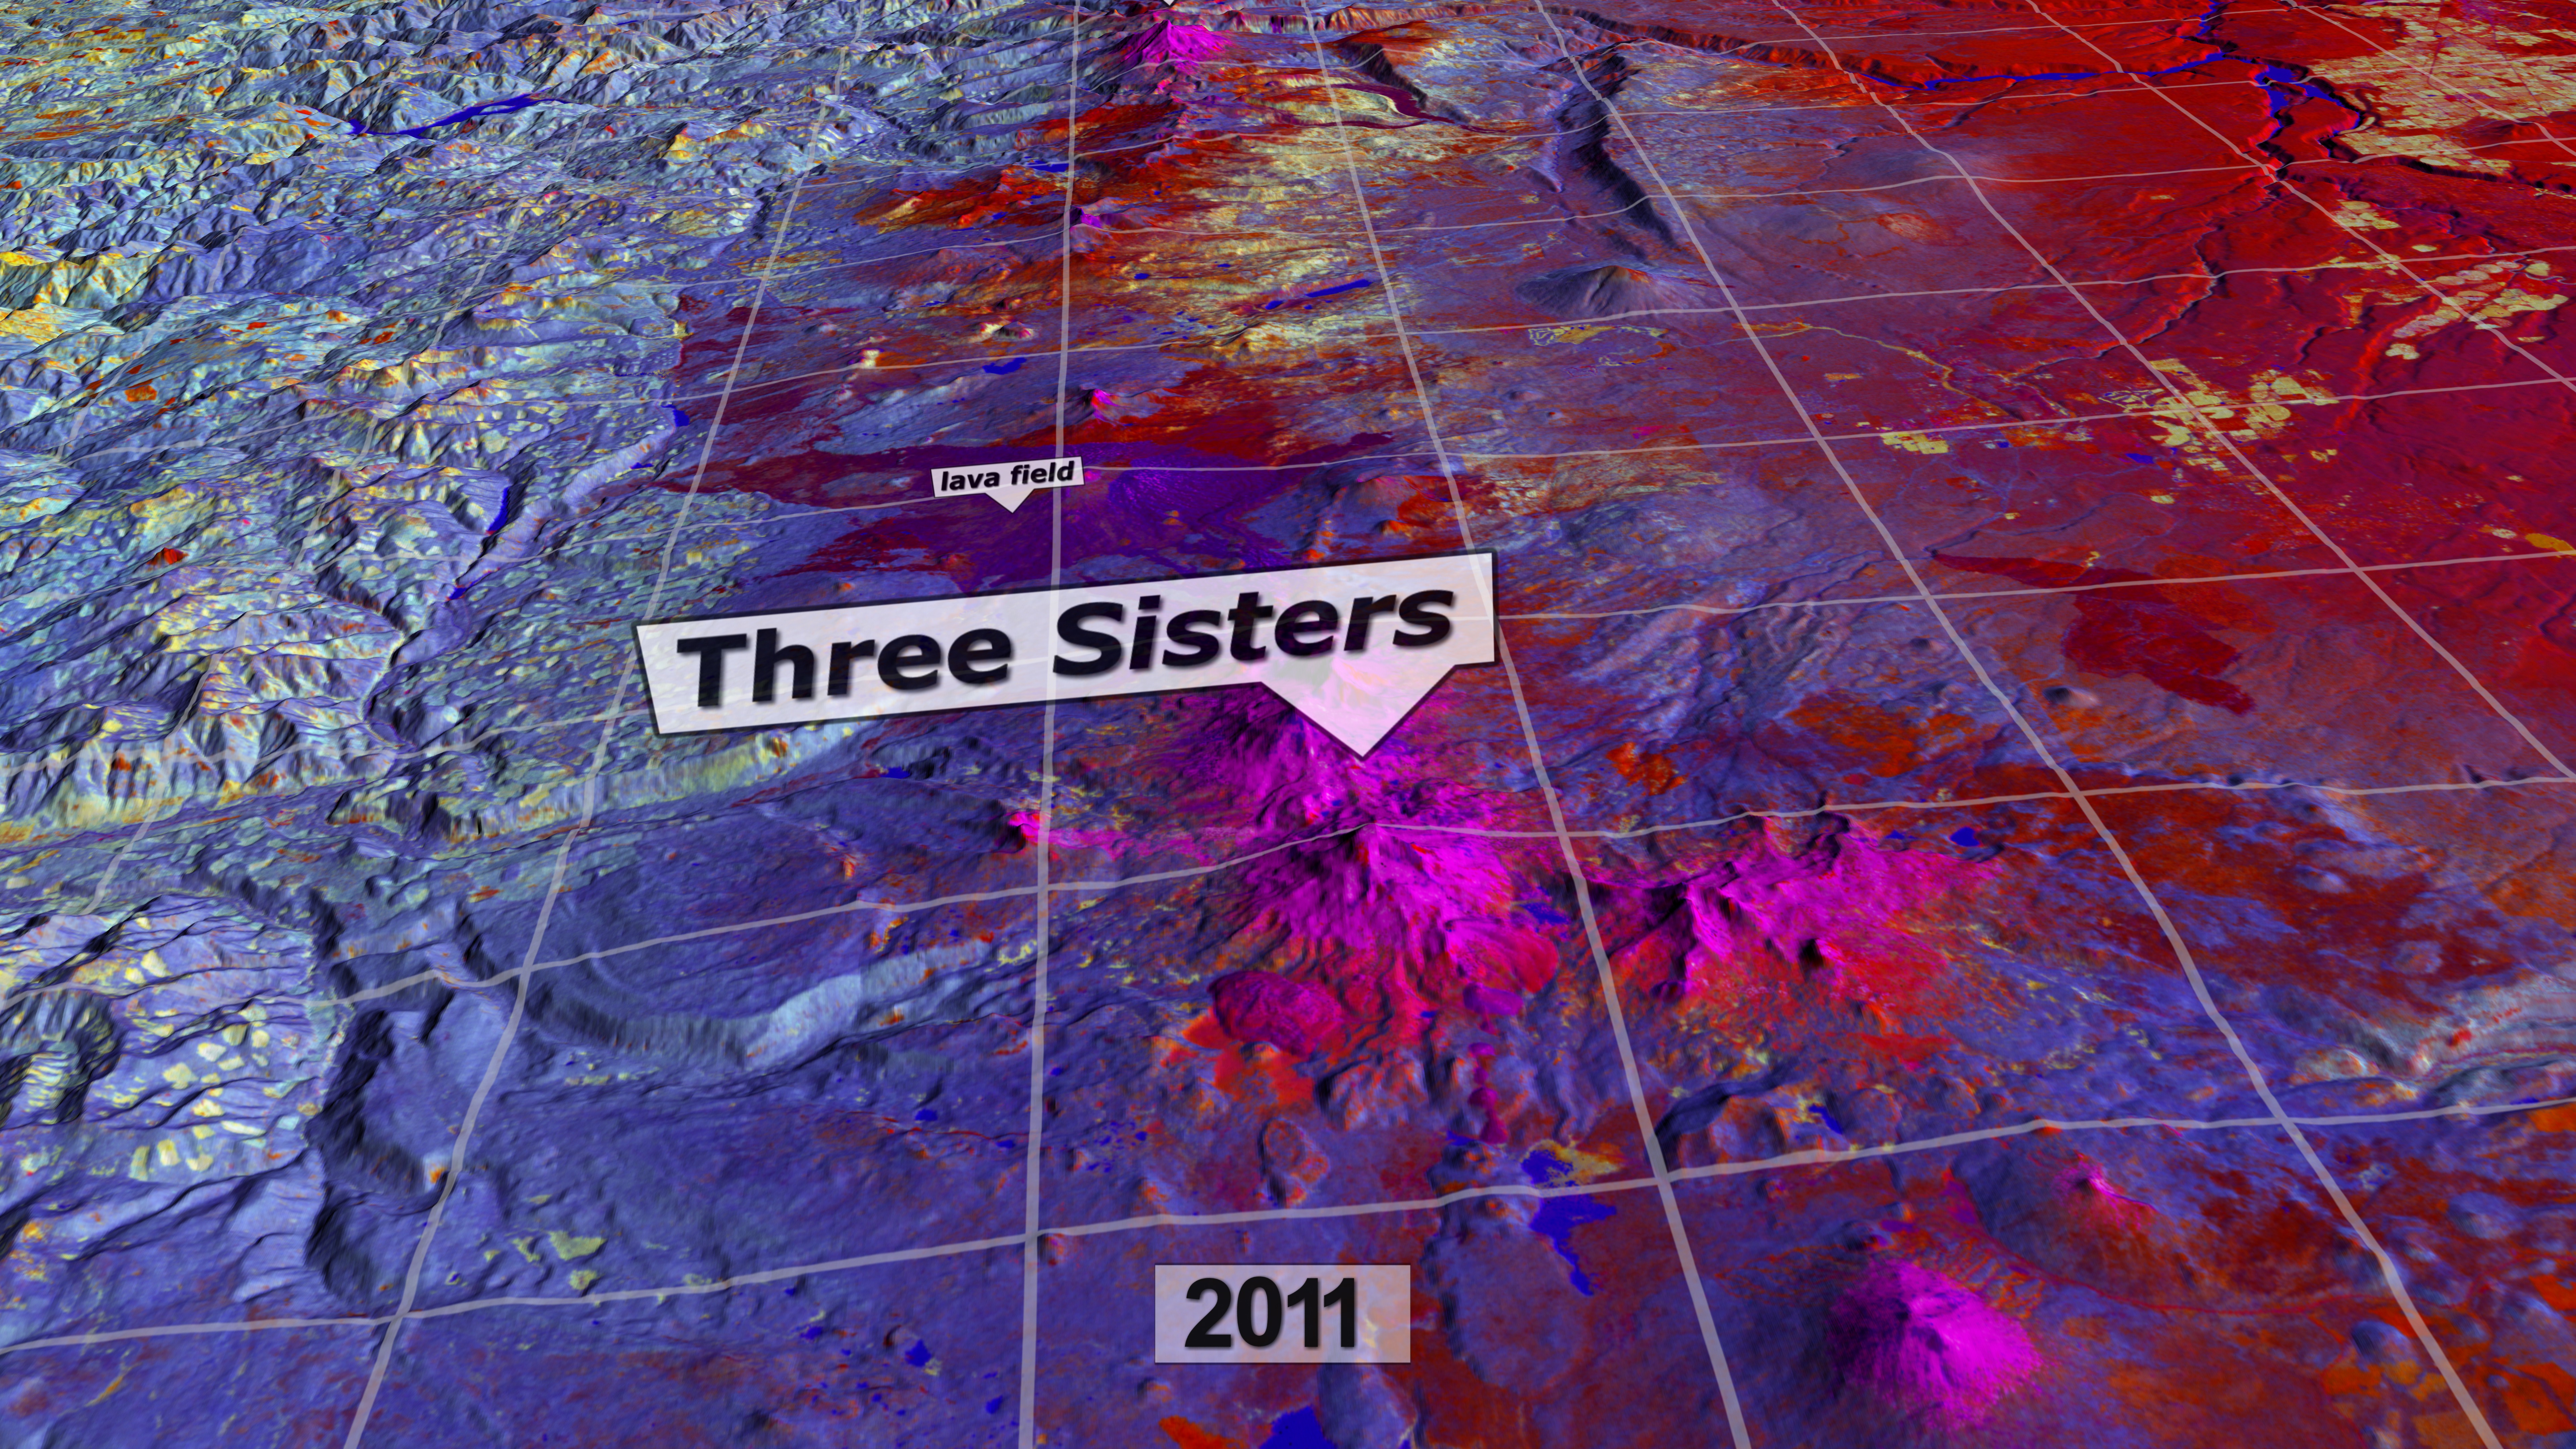
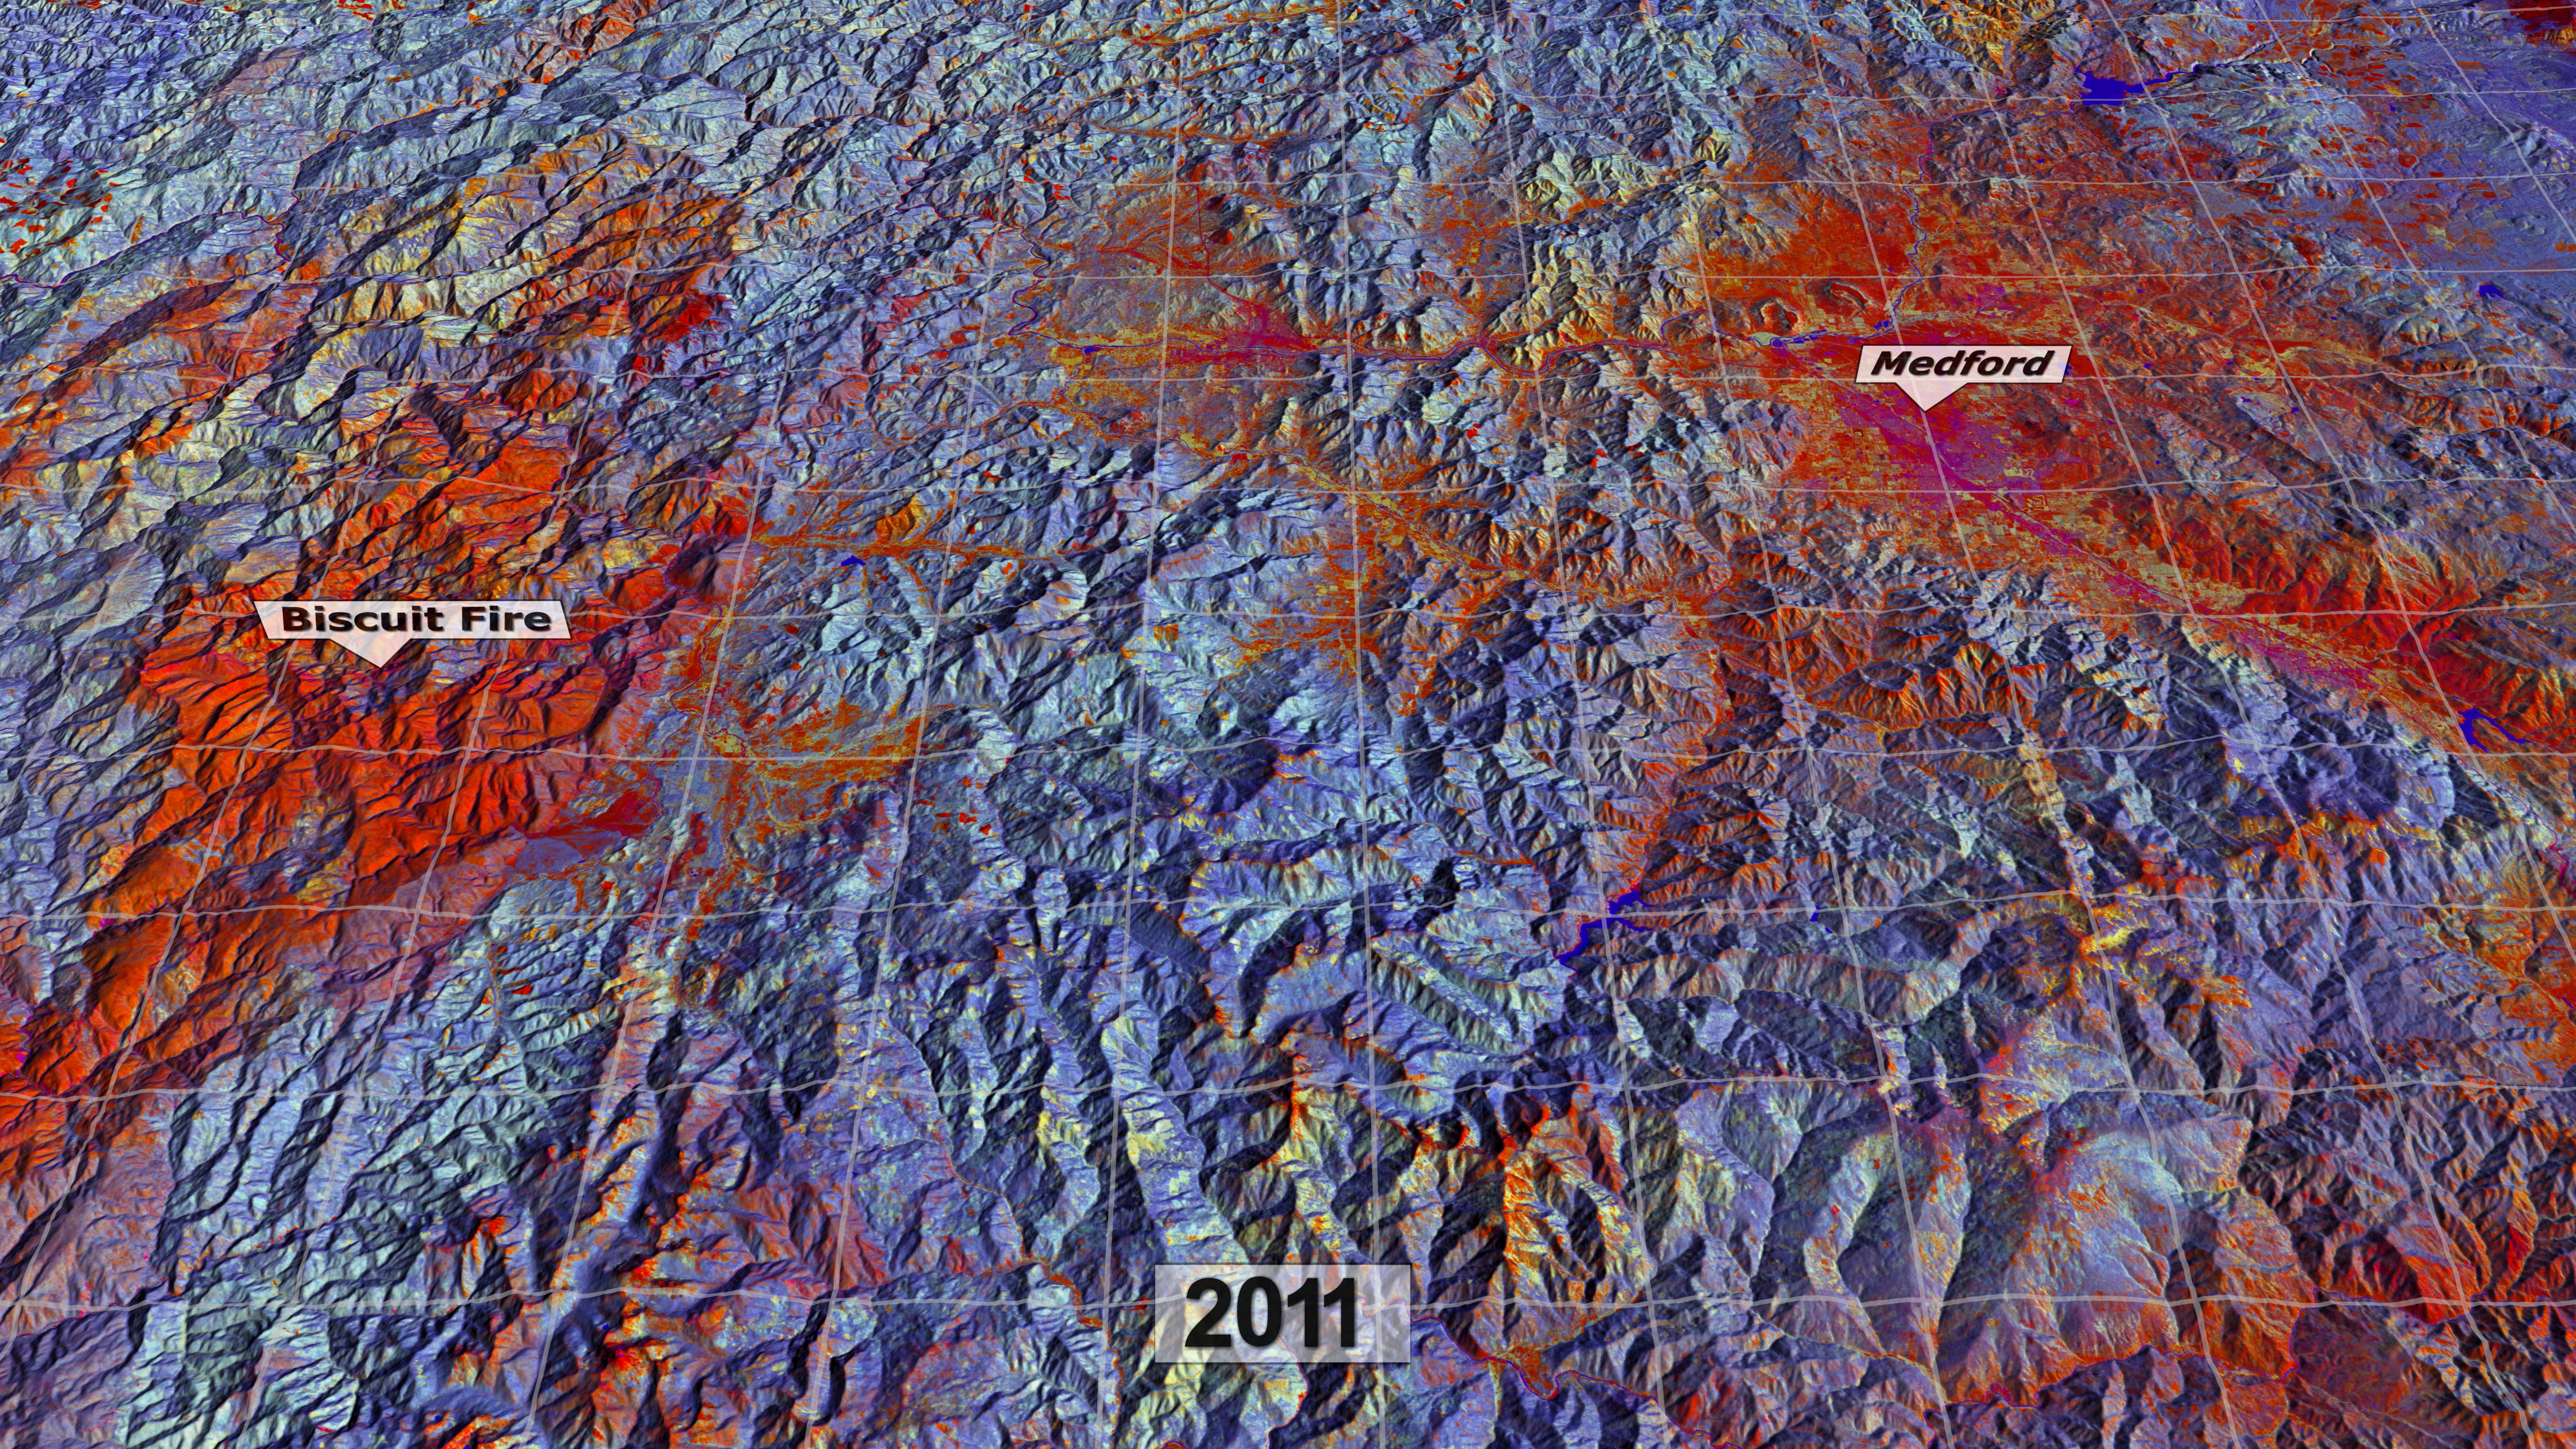
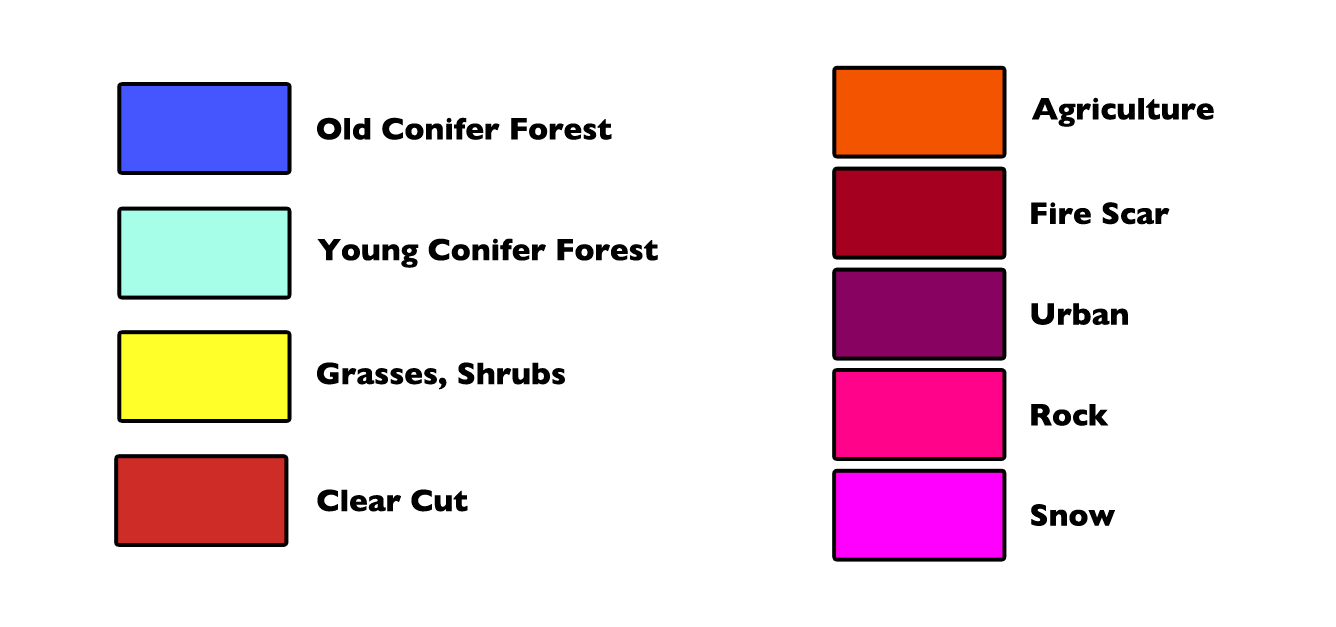
In these false color images, the colors represent types of land; for example, blue areas are forests; orange/yellow areas are agriculture; and, purple areas are urban. Each 'stack' is representative of a Landsat scene. There are 22 stacks stitched together to cover most of the U.S. Pacific Northwest. This processed data is used for science, natural resource management, and education.
We move in to the southwest corner of the data set near Redwood National Park and proceed on a slow tour through a portion of the data set. Time loops from 1984 through 2011 as we move. We move over to Mount Shasta, then up the Cascade Range, passing Crater Lake National Park, the Three Sisters, Mount Jefferson, Mount Hood, Mount Saint Helens, Mount Adams, Mount Rainier, Mount Baker, and the North Cascades National Park. Next we move west over Seattle and pass over Olympic National Park, then we head back south down the Willamette Valley back to Redwood National Park.
Don't miss this related narrated visualization
Related

Visualization Credits
Alex Kekesi (Global Science and Technology, Inc.): Animator
Horace Mitchell (NASA/GSFC): Animator
Matthew R. Radcliff (USRA): Producer
Robert Kennedy (Boston University): Scientist
Zhiqiang Yang (Oregon State University): Scientist
Justin Braaten (Oregon State University): Scientist
Ellen T. Gray (ADNET Systems, Inc.): Writer
NASA's Goddard Space Flight Center Scientific Visualization Studio and the Laboratory for Applications of Remote Sensing in Ecology at Oregon State University
https://svs.gsfc.nasa.gov/4012
Missions:
Landsat
Shuttle Radar Topography Mission - SRTM
Terra
Data Used:
also referred to as: LandTrendr
Analysis - Oregon State University - 1984 through 2011SRTM/SIR-C/DEM
Terra and Aqua/MODIS/Blue Marble: Next Generation also referred to as: BMNG
The Blue Marble data is courtesy of Reto Stockli (NASA/GSFC).
This item is part of these series:
Geophysical Changes Over Time
Landsat
LDCM
Keywords:
SVS >> HDTV
SVS >> Land Classification
SVS >> Landsat
DLESE >> Physical geography
GCMD >> Earth Science >> Land Surface >> Land Use/Land Cover >> Land Cover
NASA Science >> Earth
GCMD keywords can be found on the Internet with the following citation: Olsen, L.M., G. Major, K. Shein, J. Scialdone, S. Ritz, T. Stevens, M. Morahan, A. Aleman, R. Vogel, S. Leicester, H. Weir, M. Meaux, S. Grebas, C.Solomon, M. Holland, T. Northcutt, R. A. Restrepo, R. Bilodeau, 2013. NASA/Global Change Master Directory (GCMD) Earth Science Keywords. Version 8.0.0.0.0


