Earth
ID: 3958
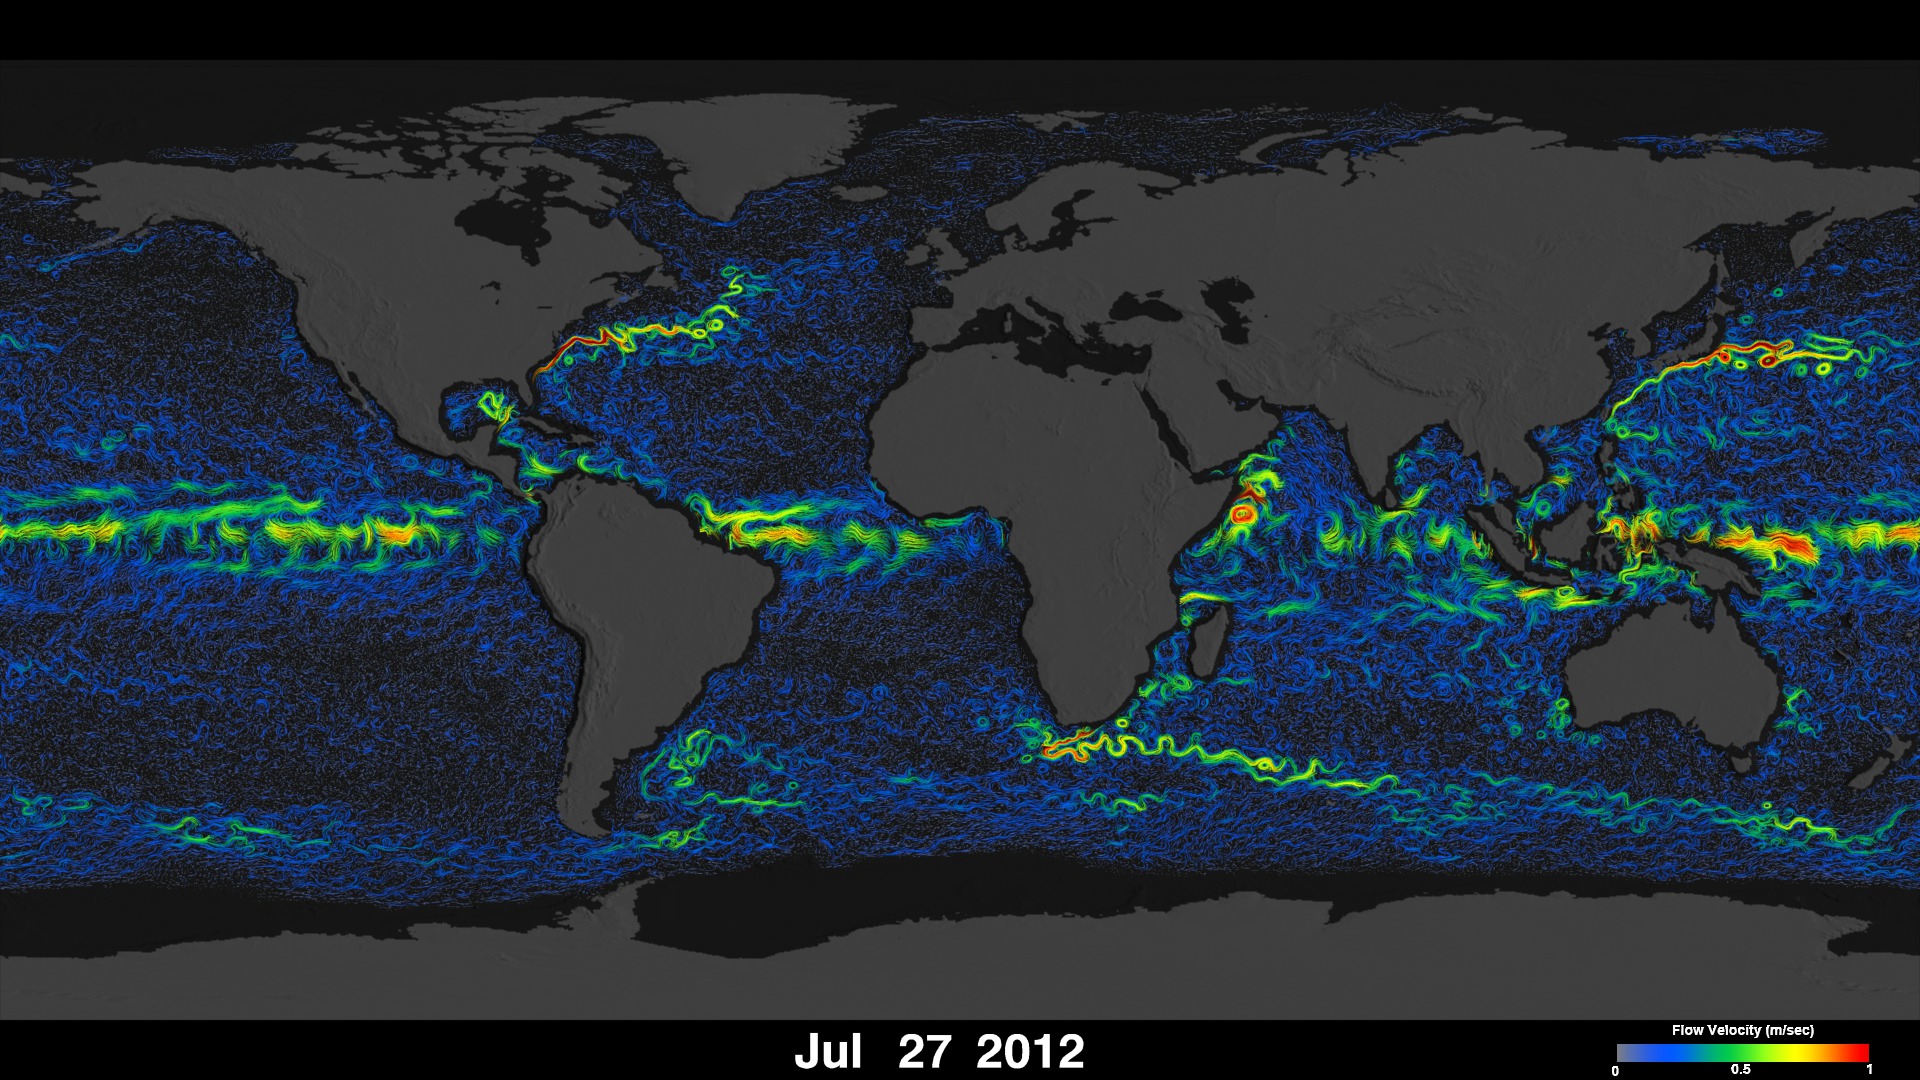
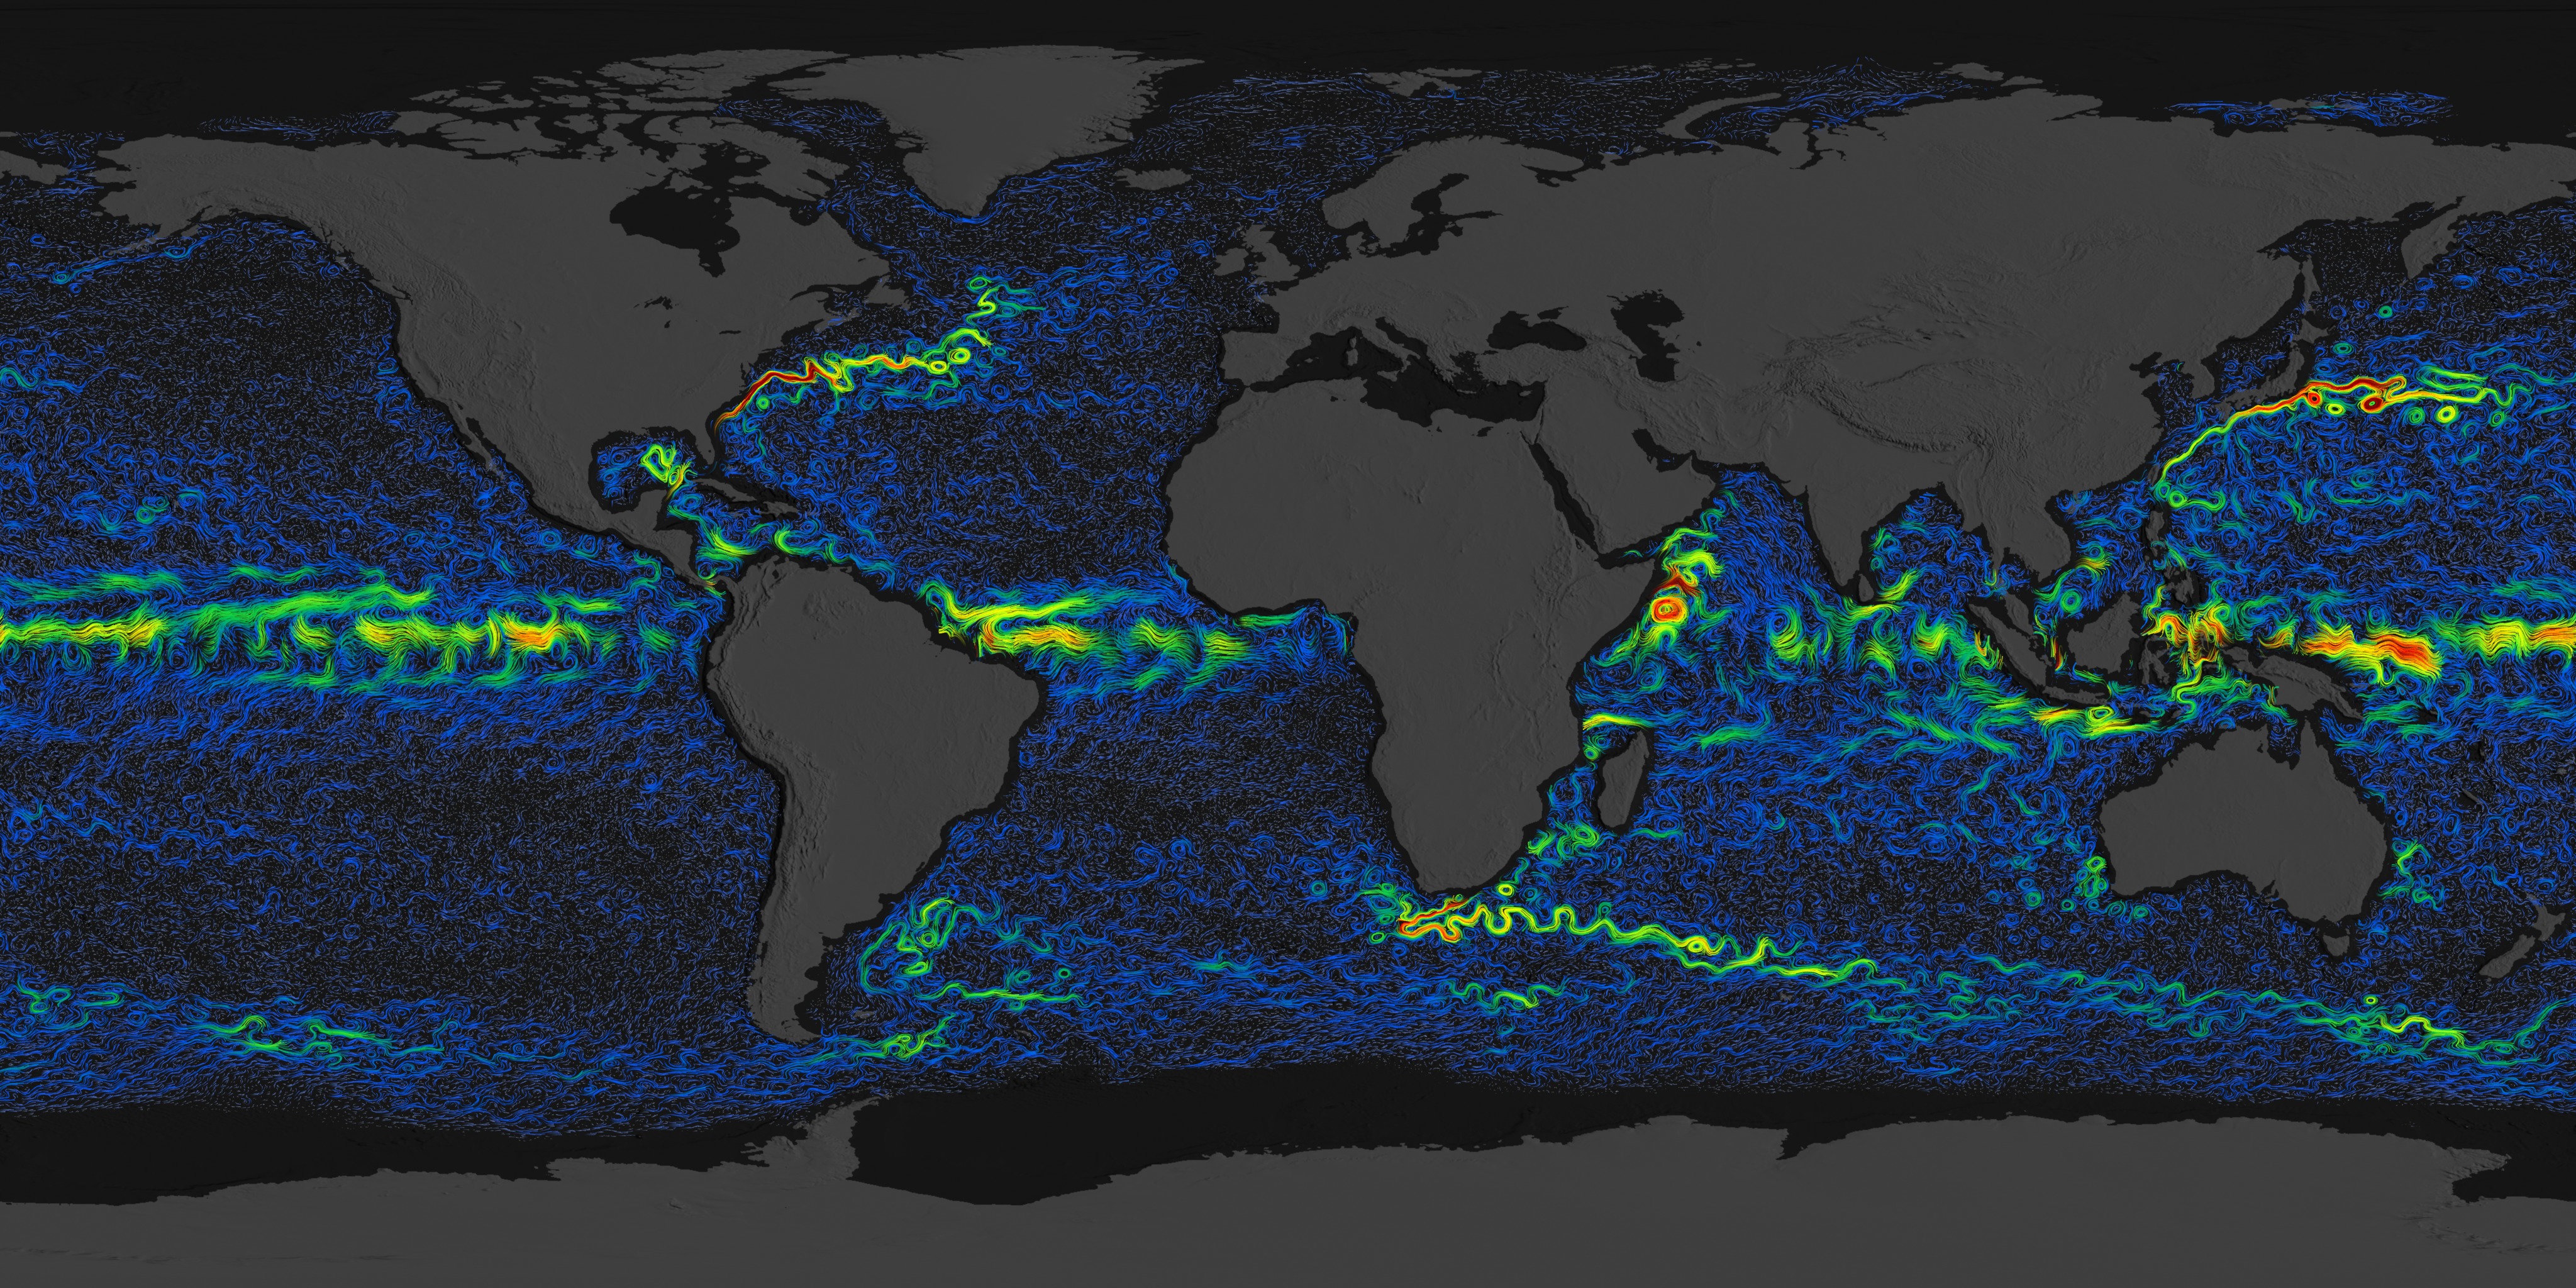
This visualization shows OSCAR (Ocean Surface Current Analysis Real-time) ocean currents colored by current velocities. OSCAR data (produced by Earth & Space Research and distributed through NOAA and PO.DAAC) is derived from observed satellite altimetry and wind vector data. The visualization runs from January 1, 2008 through July 27, 2012. Blues are slow currents, greens currents are about 0.5 meters per second, and red currents are about 1 meter per second. This visualization was rendered in a variety of sizes from standard 1080p HD to 4k to 6840x3420. The higher resolution versions were rendered for very high resolution display technologies such as hyperwalls and cinema projectors.
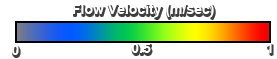

OSCAR Ocean Currents with Velocity
For more information about the NOAA/NASA OSCAR projects, click here.
These visualizations were developed, in part, for display at the "20 Years of Progress in Radar Altimetry" Symposium in Venice, Italy in September 2012 and for the Fall 2012 American Geophysical Union conference in December 2012.
Visualization Credits
Greg Shirah (NASA/GSFC): Lead Animator
Horace Mitchell (NASA/GSFC): Animator
Kathleen Dohan (Earth and Space Research (ESR)): Scientist
Gary Lagerloef (ESR): Scientist
Leann Johnson (Global Science and Technology, Inc.): Project Support
Horace Mitchell (NASA/GSFC): Animator
Kathleen Dohan (Earth and Space Research (ESR)): Scientist
Gary Lagerloef (ESR): Scientist
Leann Johnson (Global Science and Technology, Inc.): Project Support
Please give credit for this item to:
NASA/Goddard Space Flight Center Scientific Visualization Studio
NASA/Goddard Space Flight Center Scientific Visualization Studio
Short URL to share this page:
https://svs.gsfc.nasa.gov/3958
Data Used:
Note: While we identify the data sets used in these visualizations, we do not store any further details nor the data sets themselves on our site.
Keywords:
DLESE >> Physical oceanography
GCMD >> Earth Science >> Oceans >> Ocean Circulation
GCMD >> Earth Science >> Oceans >> Ocean Circulation >> Ocean Currents
SVS >> Hyperwall
NASA Science >> Earth
GCMD keywords can be found on the Internet with the following citation: Olsen, L.M., G. Major, K. Shein, J. Scialdone, S. Ritz, T. Stevens, M. Morahan, A. Aleman, R. Vogel, S. Leicester, H. Weir, M. Meaux, S. Grebas, C.Solomon, M. Holland, T. Northcutt, R. A. Restrepo, R. Bilodeau, 2013. NASA/Global Change Master Directory (GCMD) Earth Science Keywords. Version 8.0.0.0.0
https://svs.gsfc.nasa.gov/3958
Data Used:
also referred to as: OSCAR Ocean Surface Current Analysis
Analysis - NOAA - 01/01/2008 through 07/27/2012Keywords:
DLESE >> Physical oceanography
GCMD >> Earth Science >> Oceans >> Ocean Circulation
GCMD >> Earth Science >> Oceans >> Ocean Circulation >> Ocean Currents
SVS >> Hyperwall
NASA Science >> Earth
GCMD keywords can be found on the Internet with the following citation: Olsen, L.M., G. Major, K. Shein, J. Scialdone, S. Ritz, T. Stevens, M. Morahan, A. Aleman, R. Vogel, S. Leicester, H. Weir, M. Meaux, S. Grebas, C.Solomon, M. Holland, T. Northcutt, R. A. Restrepo, R. Bilodeau, 2013. NASA/Global Change Master Directory (GCMD) Earth Science Keywords. Version 8.0.0.0.0


