Watching the Earth Breathe:
An Animation of Seasonal Vegetation and its effect on Earth's Global Atmospheric Carbon Dioxide
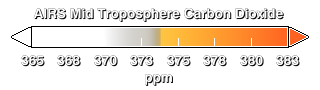
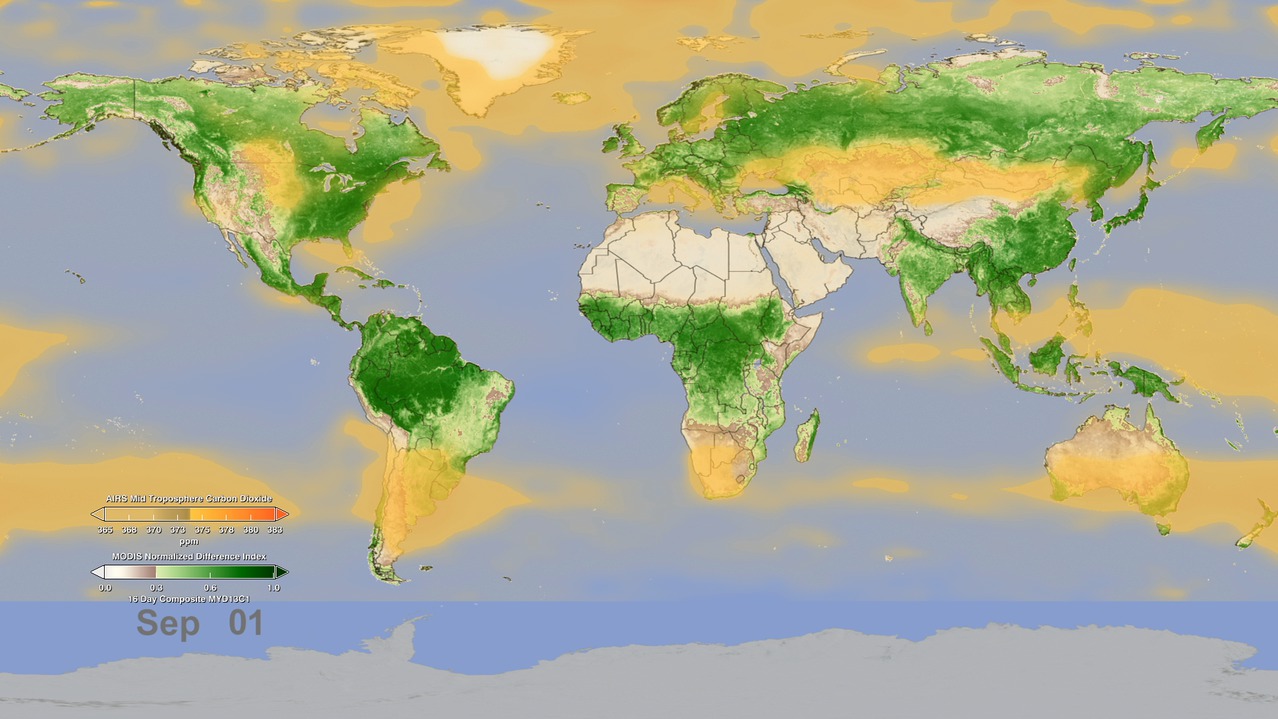
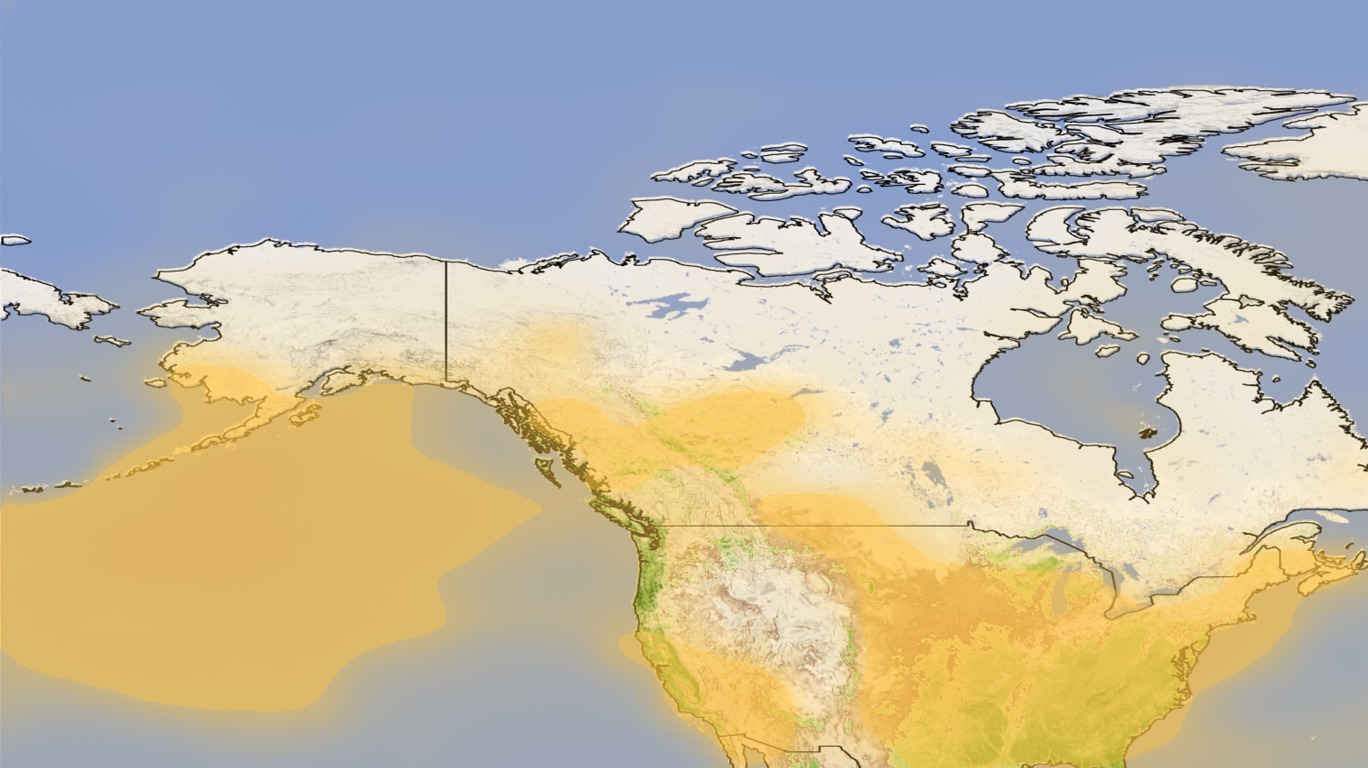
As the animation plays forward through mid-April, the concentration of carbon dioxide, shown in orange-yellow, in the middle part of Earth's lowest atmospheric layer, the troposphere, increases and spreads throughout the northern hemisphere, reaching a maximum around May. This blooming effect of carbon dioxide follows the seasonal changes that occur in northern latitude ecosystems, in which deciduous trees lose their leaves, resulting in a net release of carbon dioxide through a process called respiration. Carbon dioxide is also released in early spring as soils begin to warm. Almost 10 percent of atmospheric carbon dioxide passes through soils each year.
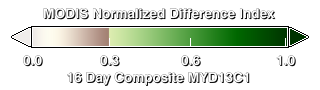
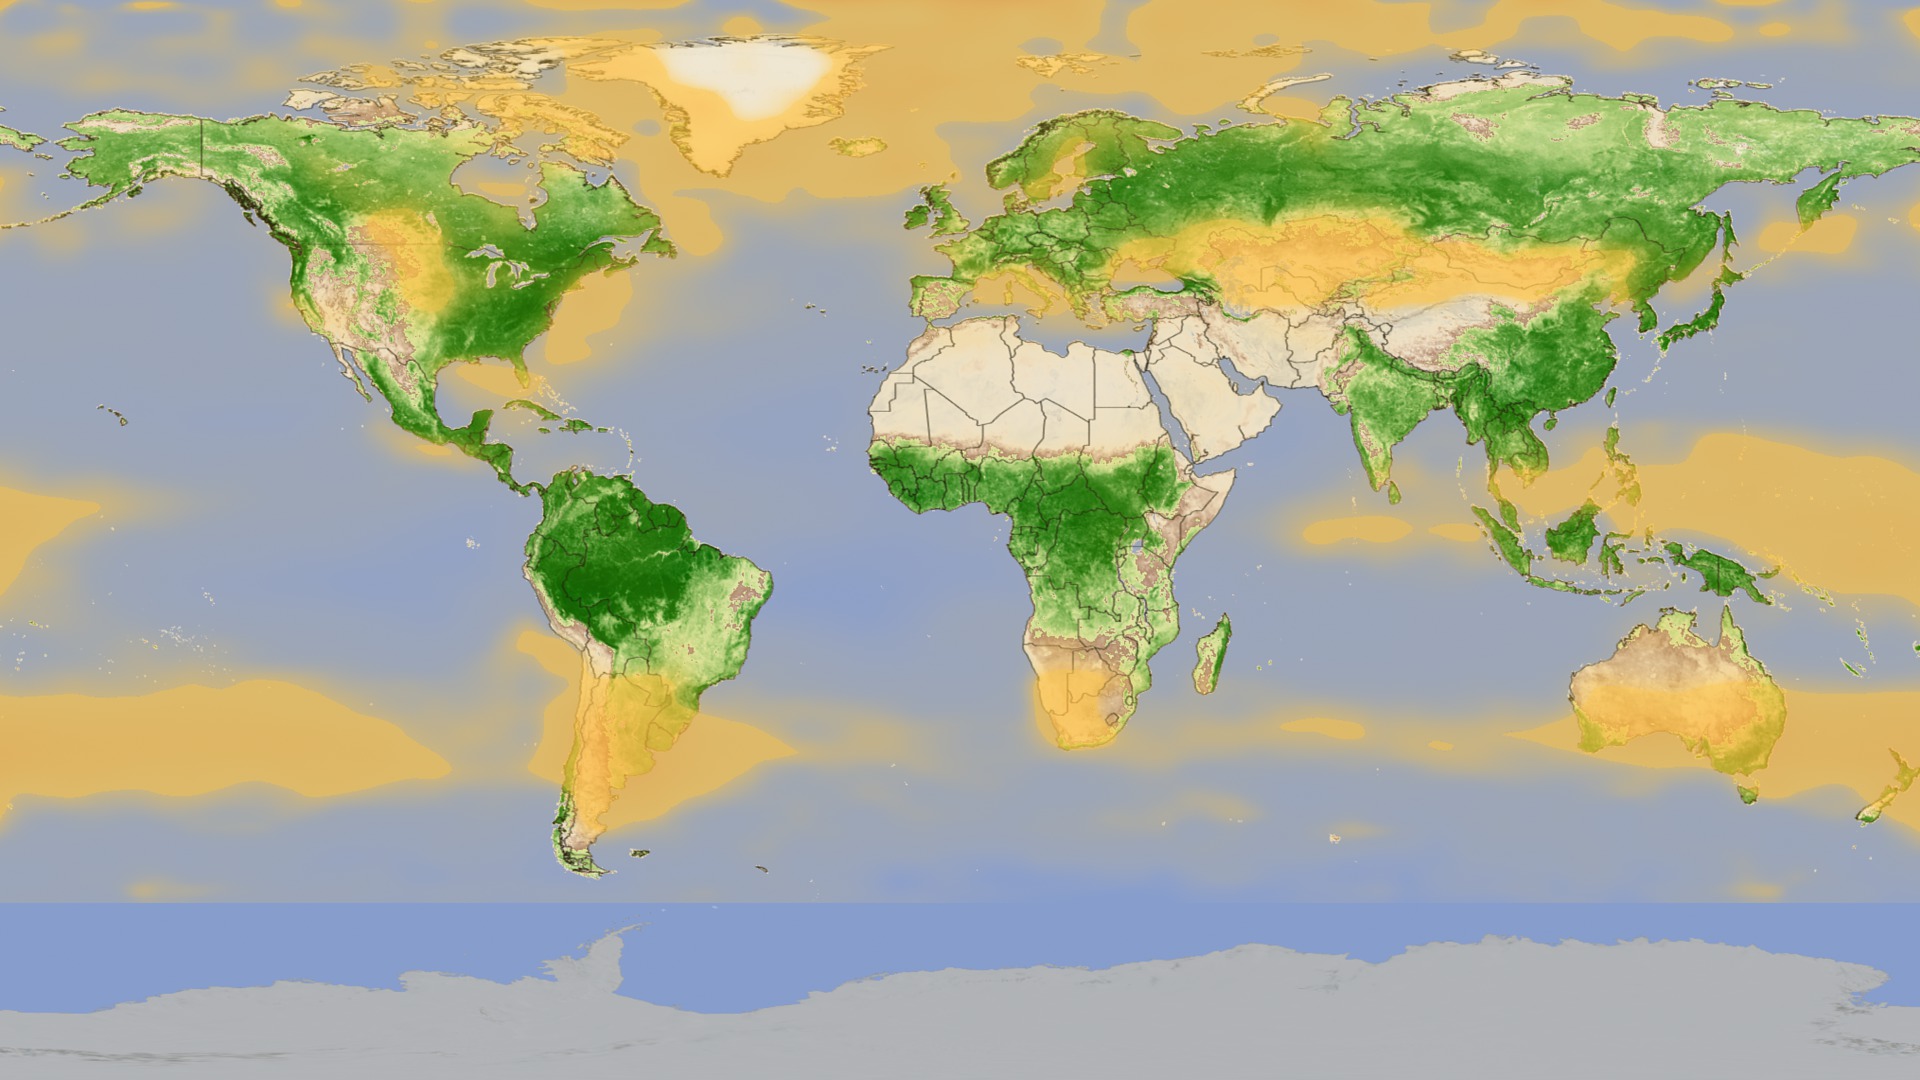
After April, the northern hemisphere moves into late spring and summer and plants begin to grow, reaching a peak in the late summer. The process of plant photosynthesis removes carbon dioxide from the air. The animation shows how carbon dioxide is scrubbed out of the atmosphere by the large volume of new and growing vegetation. Following the peak in vegetation, the drawdown of atmospheric carbon dioxide due to photosynthesis becomes apparent, particularly over the boreal forests.
Note that there is roughly a three-month lag between the state of vegetation at Earth's surface and its effect on carbon dioxide in the middle troposphere.
Data like these give scientists a new opportunity to better understand the relationships between carbon dioxide in Earth's middle troposphere and the seasonal cycle of vegetation near the surface.
Creating the Animation
This animation was created with data taken from two NASA spaceborne instruments. The concentration of carbon dioxide data from the Atmospheric Infrared Sounder (AIRS), a weather and climate instrument that flies aboard NASA's Aqua spacecraft, is overlain on measurements of vegetation index from the Moderate Resolution Imaging Spectroradiometer (MODIS) instrument, also on NASA's Aqua spacecraft, to better understand how photosynthesis and respiration influences the atmospheric carbon dioxide cycle over the globe. The animation runs from January through December and repeats. The AIRS tropospheric carbon dioxide seasonal cycle values were made by averaging AIRS data collected between 2003 and 2010, from which the annual carbon dioxide growth trend of 2 parts per million per year has been removed. For example, the data used for January 1 is actually an average of eight years of AIRS carbon dioxide data taken each year on January 1. The vegetation values were made using data averaged over a four-year period, from 2003 to 2006.
Further Detail
AIRS uses infrared technology to determine the concentration of atmospheric water vapor and several important trace gases as well as information about temperature and clouds. AIRS orbits Earth from pole-to-pole at an altitude of 438 miles (705 kilometers), measuring Earth's infrared spectrum in 3,278 channels spanning a wavelength range from 3.74 microns to 15.4 microns. Originally designed to improve weather forecasts, AIRS has improved operational five-day weather forecasts more than any other single instrument over the past decade. AIRS has also been found to be sensitive to atmospheric carbon dioxide in the middle troposphere, at an altitude of 5 to 10 kilometers or 3 to 6 miles. AIRS is managed by NASA's Jet Propulsion Laboratory, Pasadena, Calif., under contract to NASA. JPL is a division of the California Institute of Technology in Pasadena. For further information, access the AIRS project
The MODIS instrument is managed by NASA's Goddard Space Flight Center, Greenbelt, Md. For further information, access the MODIS project.

Visualization Credits
Edward Olsen (NASA/JPL CalTech): Scientist
Tom Pagano (NASA/JPL CalTech): Scientist
Sharon Ray (NASA/JPL CalTech): Project Support
Alan Buis (NASA/JPL CalTech): Writer
NASA/Goddard Space Flight Center Scientific Visualization Studio, NASA/JPL Atmospheric Infrared Sounder Project
https://svs.gsfc.nasa.gov/3947
Mission:
Terra
Data Used:
Terra and Aqua/MODIS/Normalized Difference Vegetation Index (NDVI) also referred to as: NDVI
NASA - 1/1/2003 - 12/31/2006Aqua/AIRS/CO2 Climatology
Data Compilation - January 1 - December 31Keywords:
DLESE >> Biology
SVS >> HDTV
SVS >> NDVI
GCMD >> Earth Science >> Biosphere >> Vegetation
GCMD >> Earth Science >> Atmosphere >> Atmospheric Chemistry/Carbon and Hydrocarbon Compounds >> Carbon Dioxide
GCMD >> Earth Science >> Biosphere >> Vegetation >> Vegetation Index
GCMD >> Location >> Troposphere
SVS >> Hyperwall
SVS >> MODIS
NASA Science >> Earth
SVS >> Presentation
NASA Earth Science Focus Areas >> Carbon Cycle and Ecosystems
GCMD keywords can be found on the Internet with the following citation: Olsen, L.M., G. Major, K. Shein, J. Scialdone, S. Ritz, T. Stevens, M. Morahan, A. Aleman, R. Vogel, S. Leicester, H. Weir, M. Meaux, S. Grebas, C.Solomon, M. Holland, T. Northcutt, R. A. Restrepo, R. Bilodeau, 2013. NASA/Global Change Master Directory (GCMD) Earth Science Keywords. Version 8.0.0.0.0


