Earth
ID: 3873
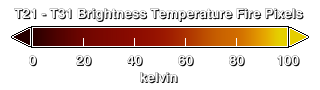
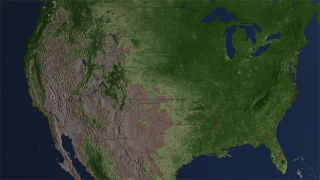
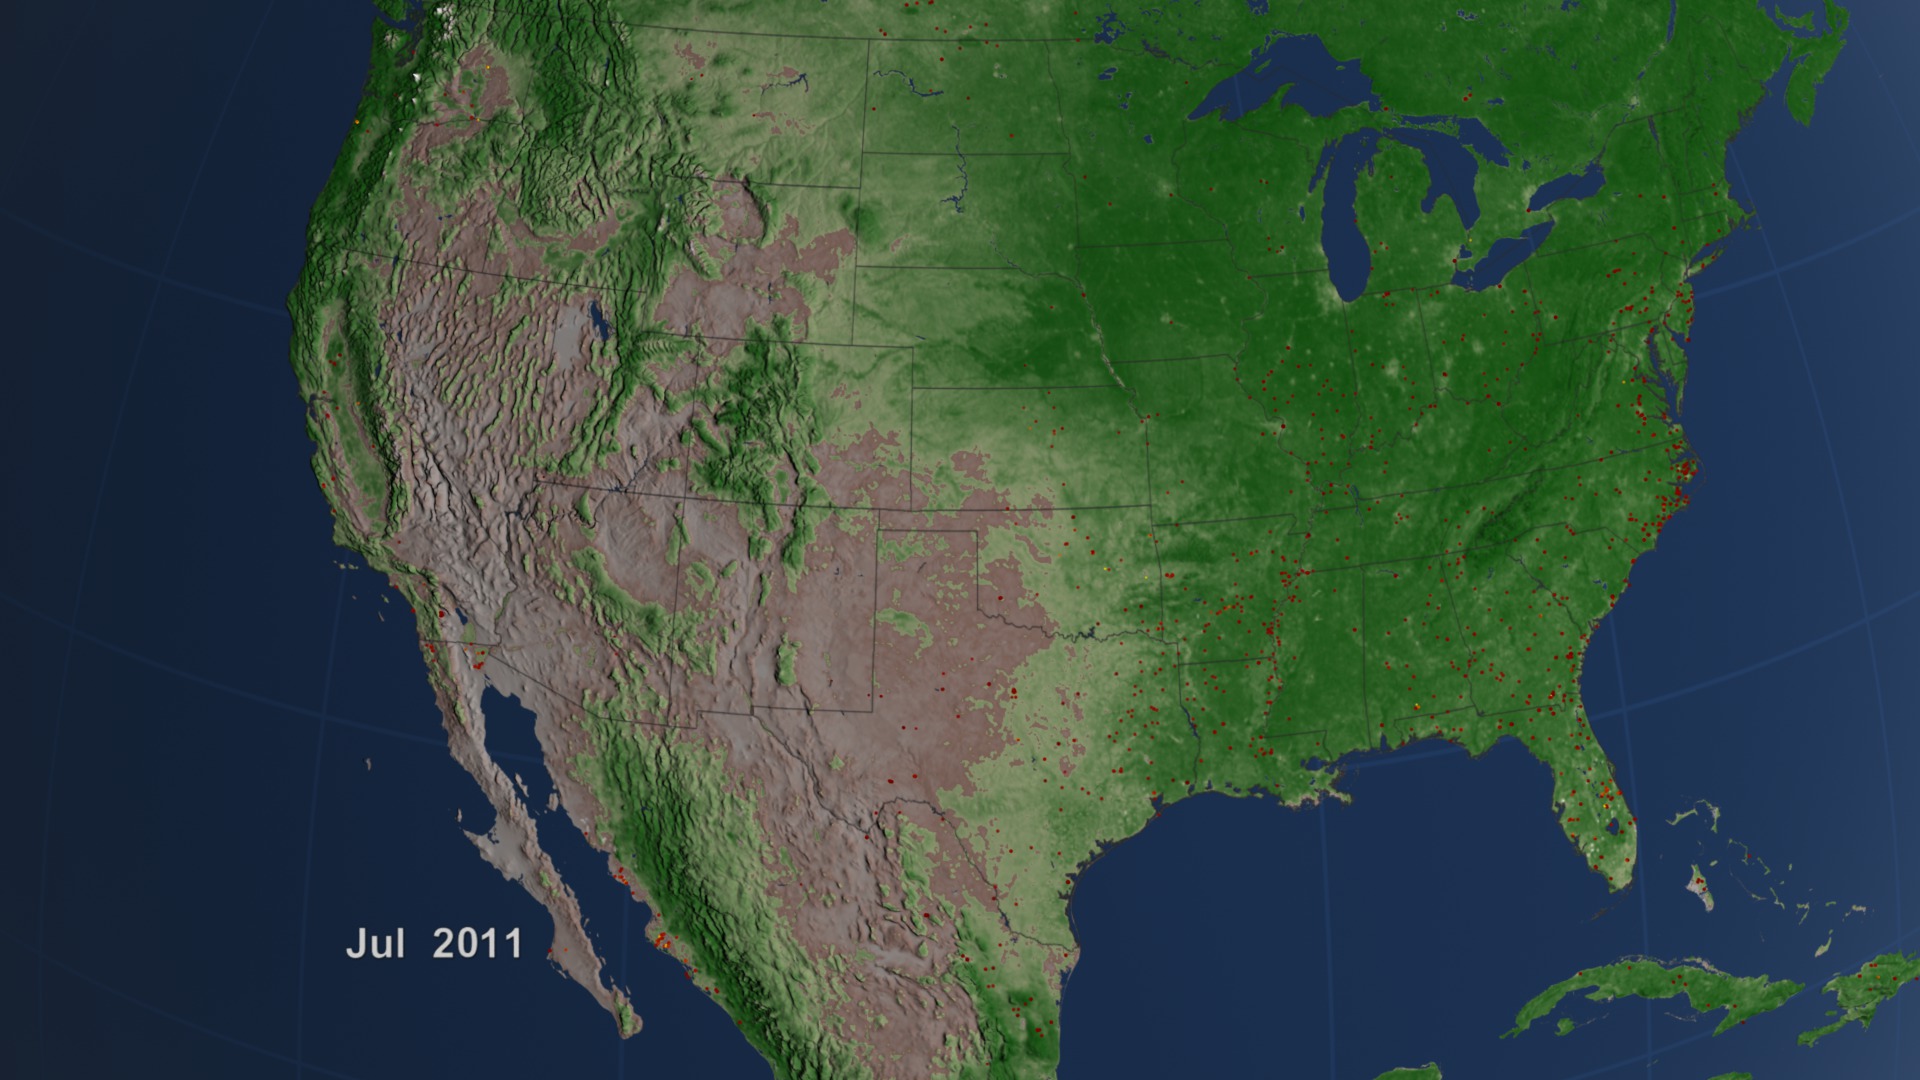
From space, we can understand fires in ways that are impossible from the ground. NASA has released a series of new visualizations that show fires detected by key fire-monitoring instruments on NASA satellites over the last decade. The visualizations show fire observations made by MODerate Resolution Imaging Spectroradiometer (MODIS) instruments on board the Terra and Aqua satellites. The visualization also includes vegetation and snow cover data to show how fires respond to seasonal changes. "It's incredibly satisfying to see such a long record of fires visualized," said Chris Justice, a scientist from the University of Maryland who leads NASA's effort to use MODIS data to study the world's fires. "It's not only exciting visually, but what you see here is a very good representation of the data scientists use to understand the global distribution of fires and to determine where and how fires are responding to climate change and population growth." North America is a region where fires are comparatively rare. North American fires make up just 2 percent of the world's burned area each year. The fires that receive the most attention in the United States, the uncontrolled forest fires in the West, are less visible than the wave of agricultural fires prominent in the Southeast and along the Mississippi River Valley, but some of the large wildfires that struck Texas earlier this spring are visible.
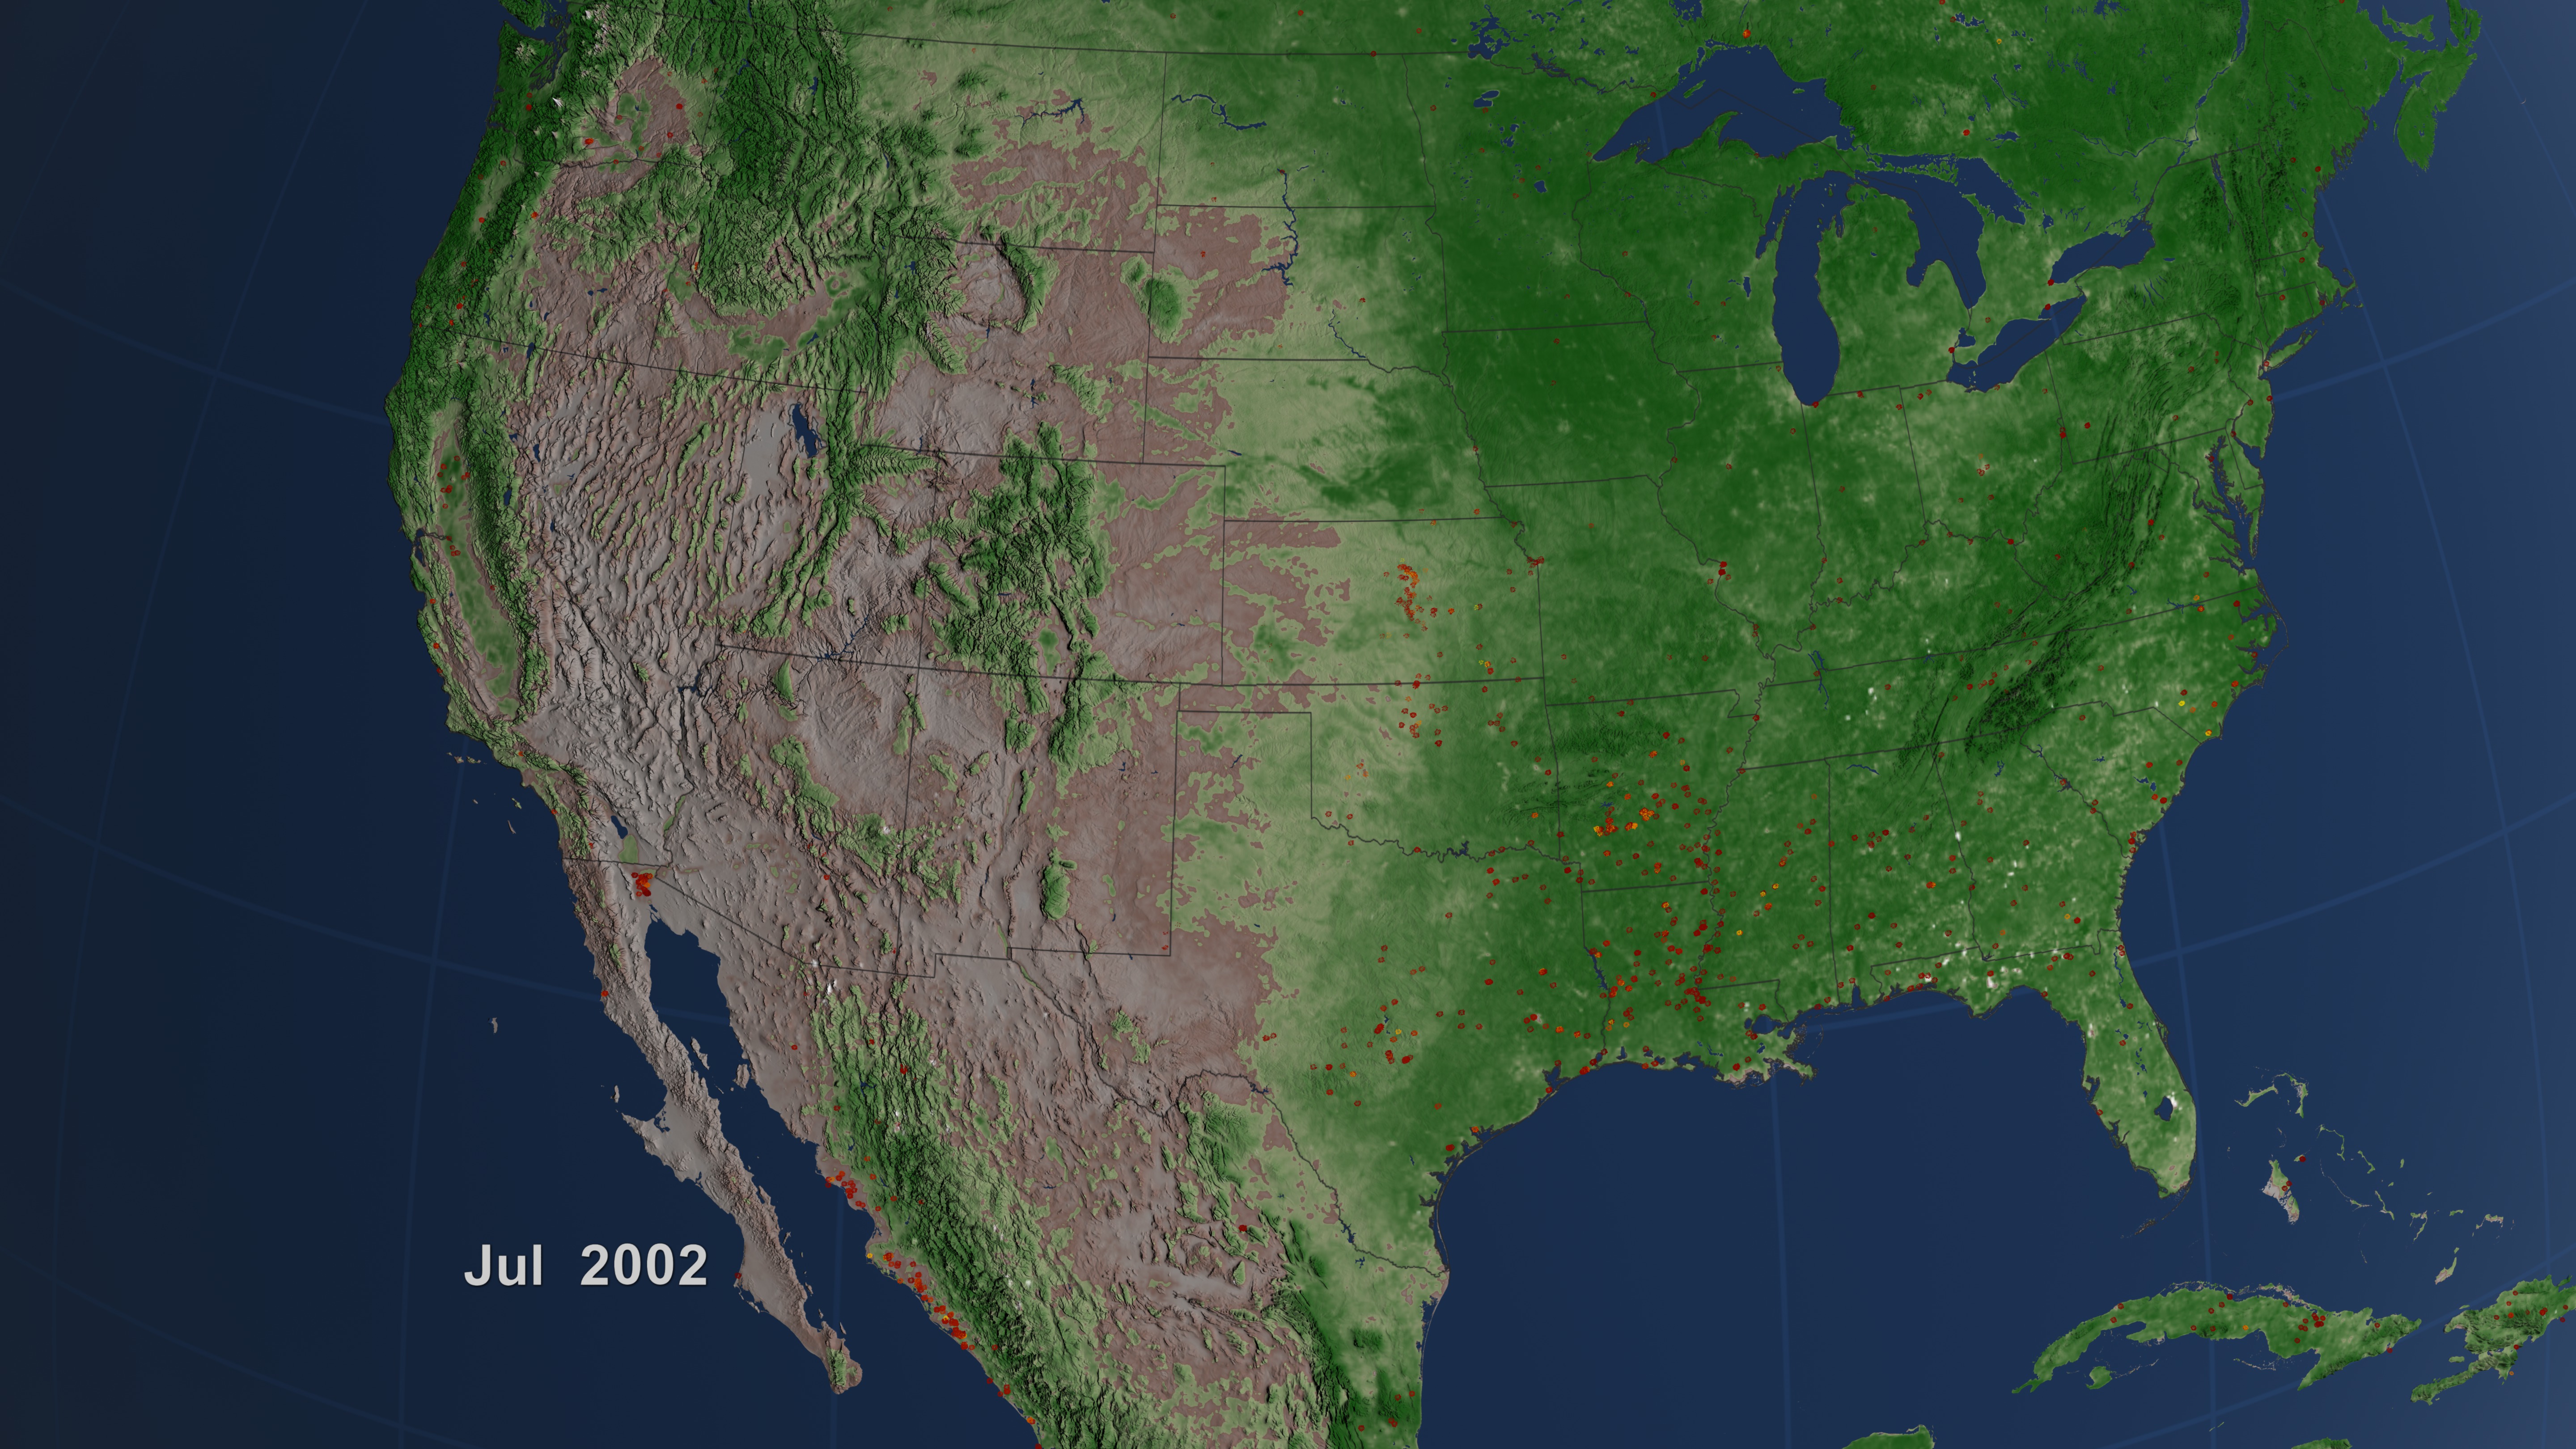
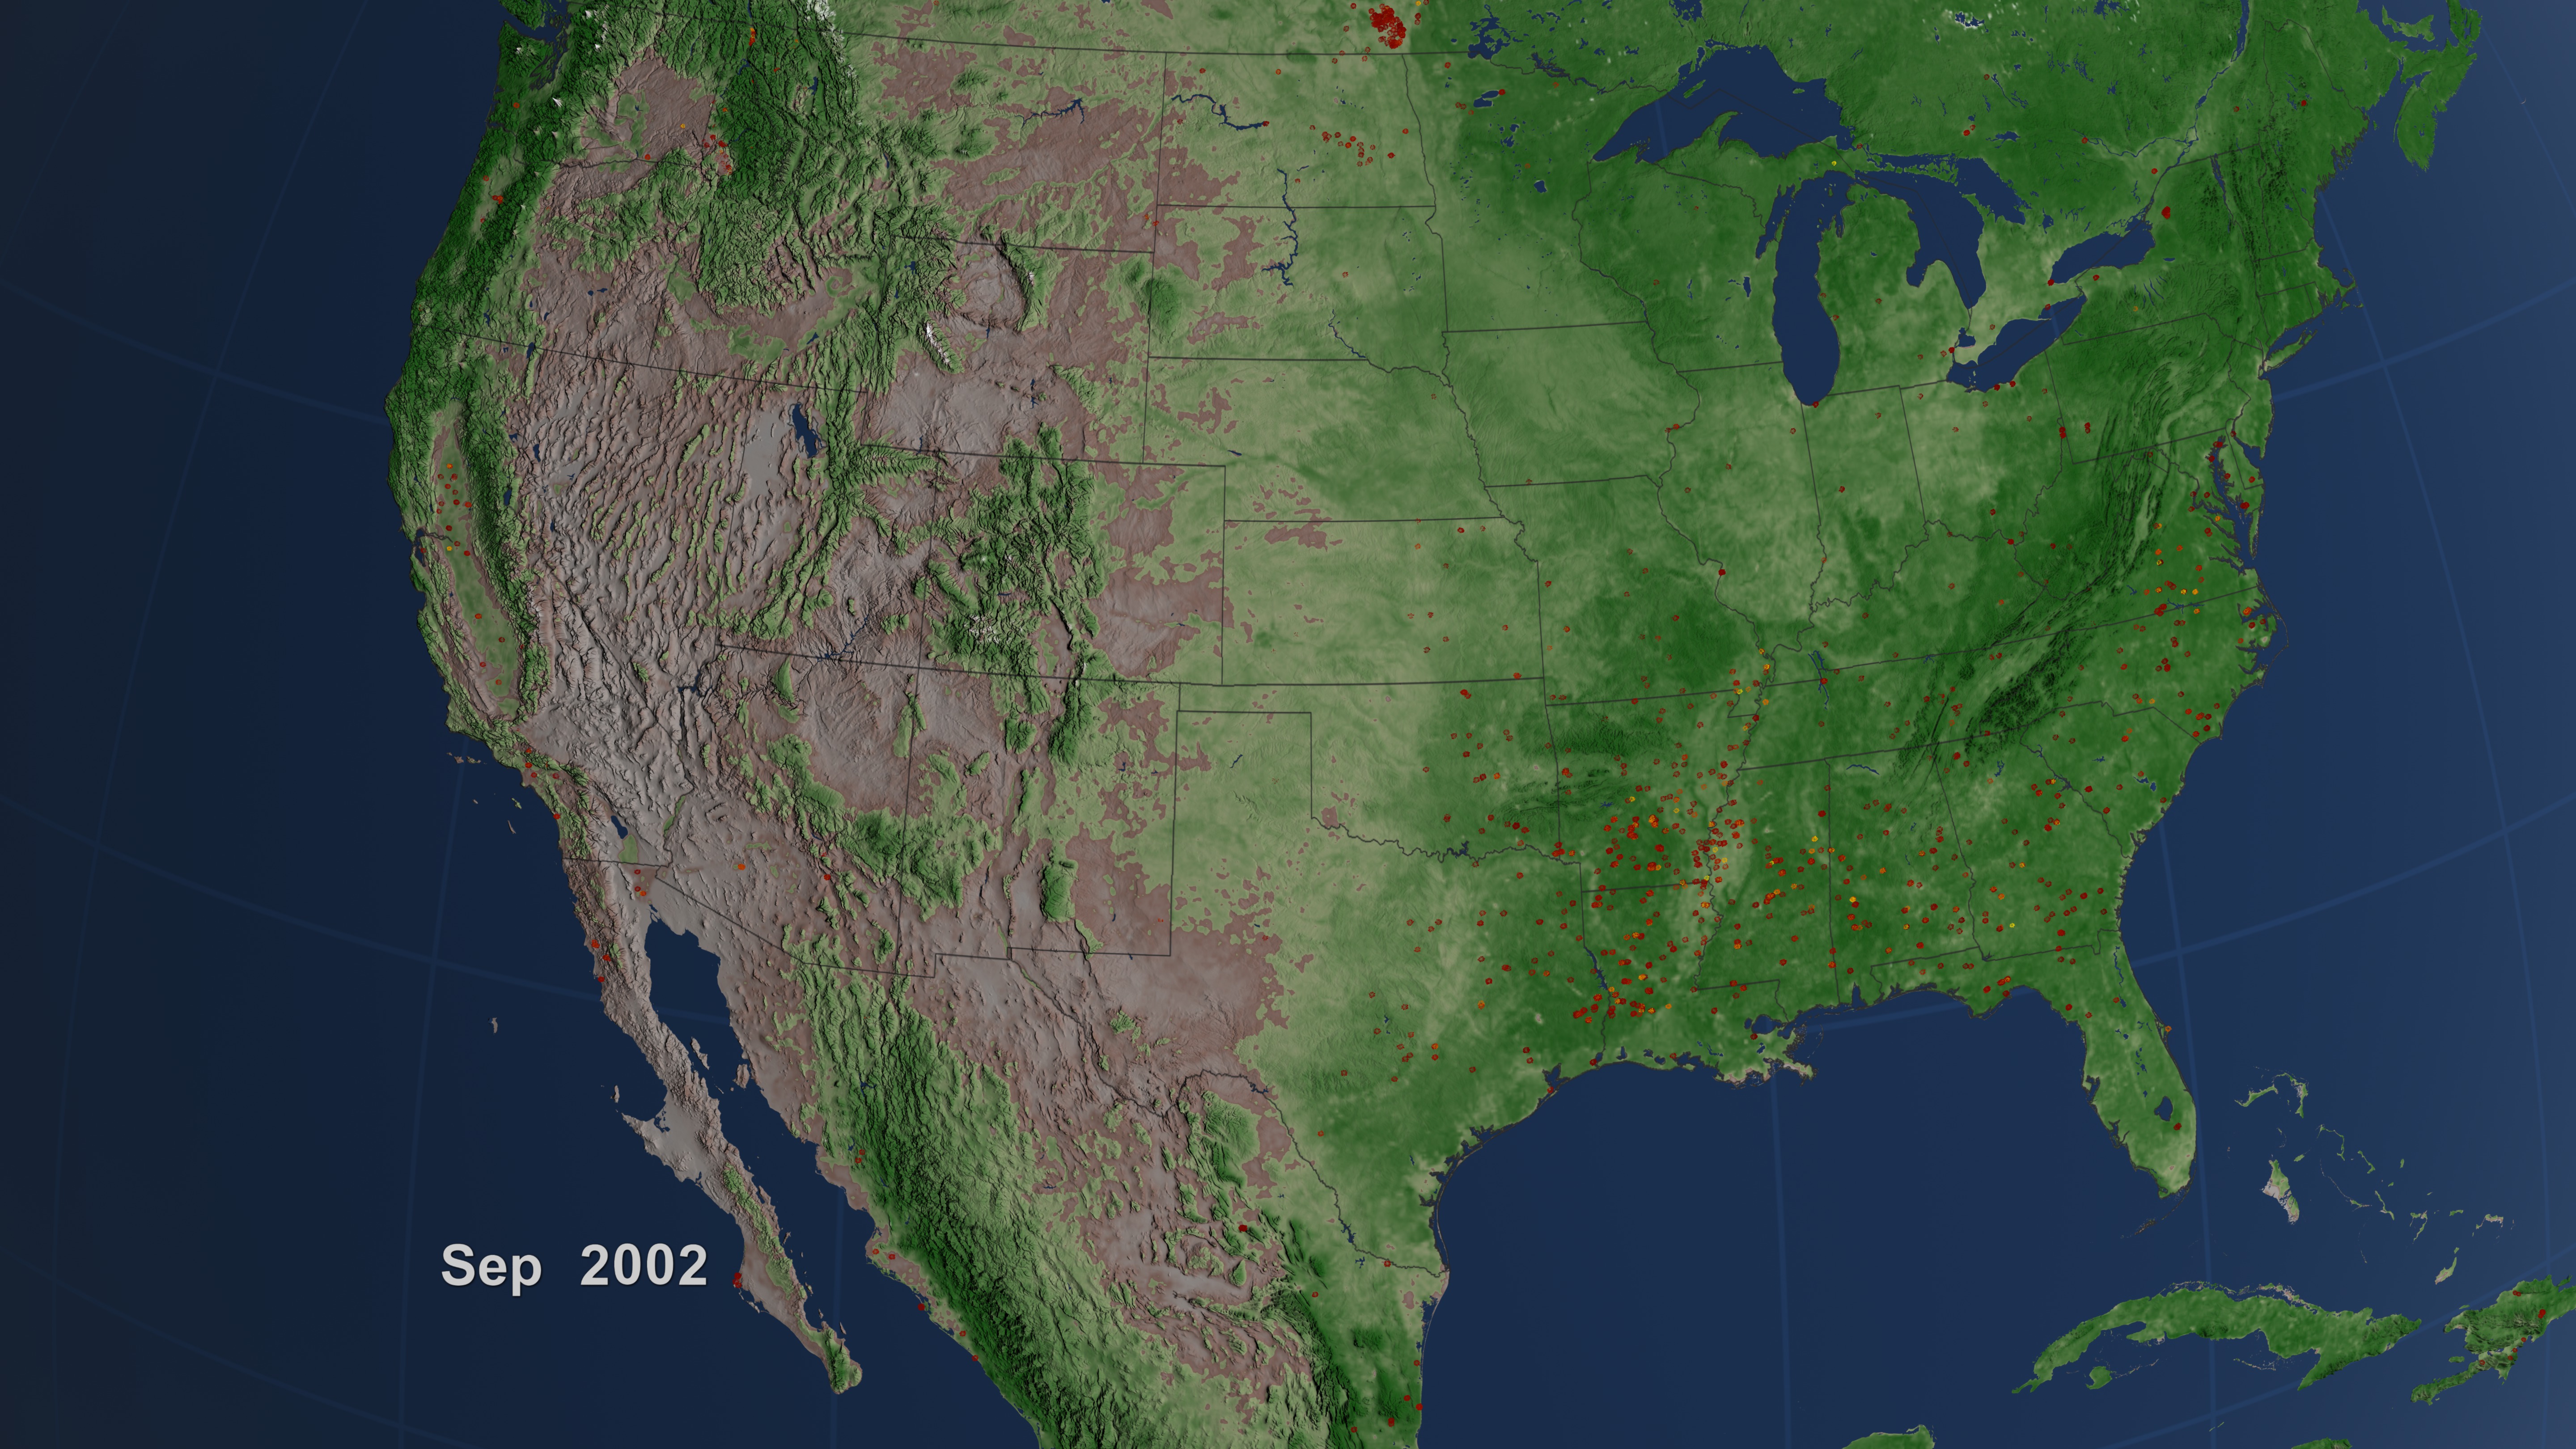
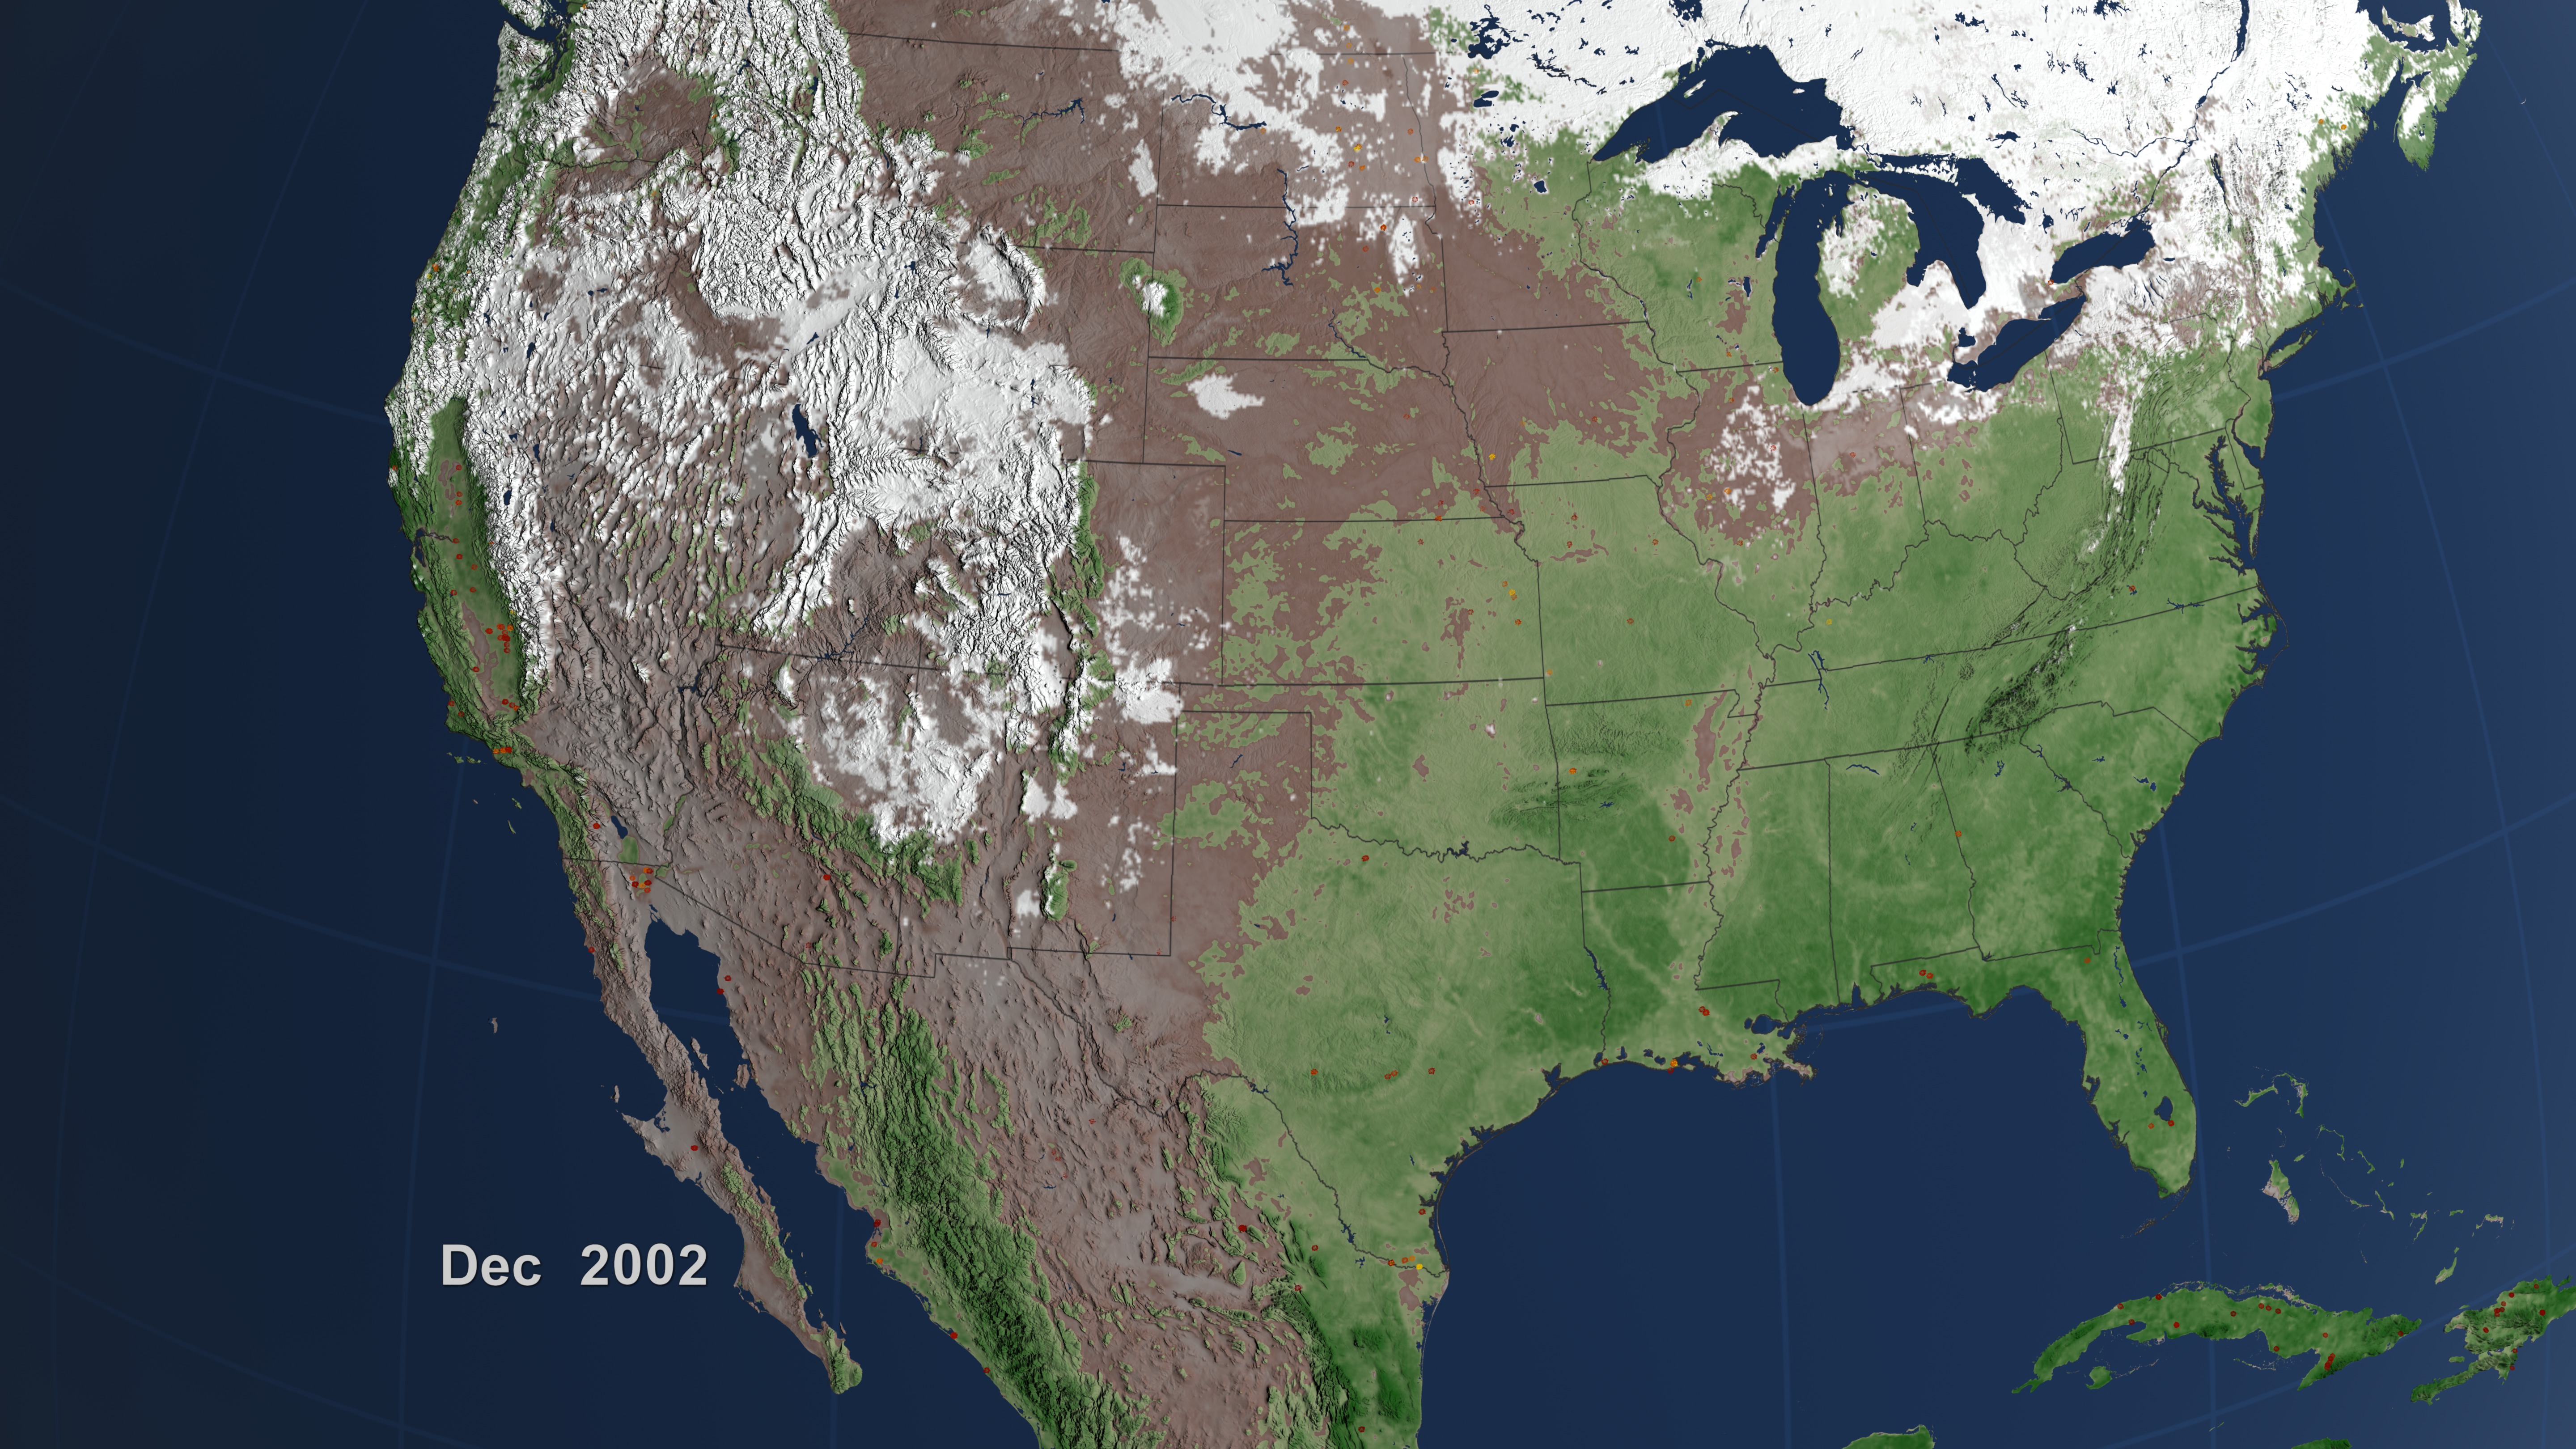
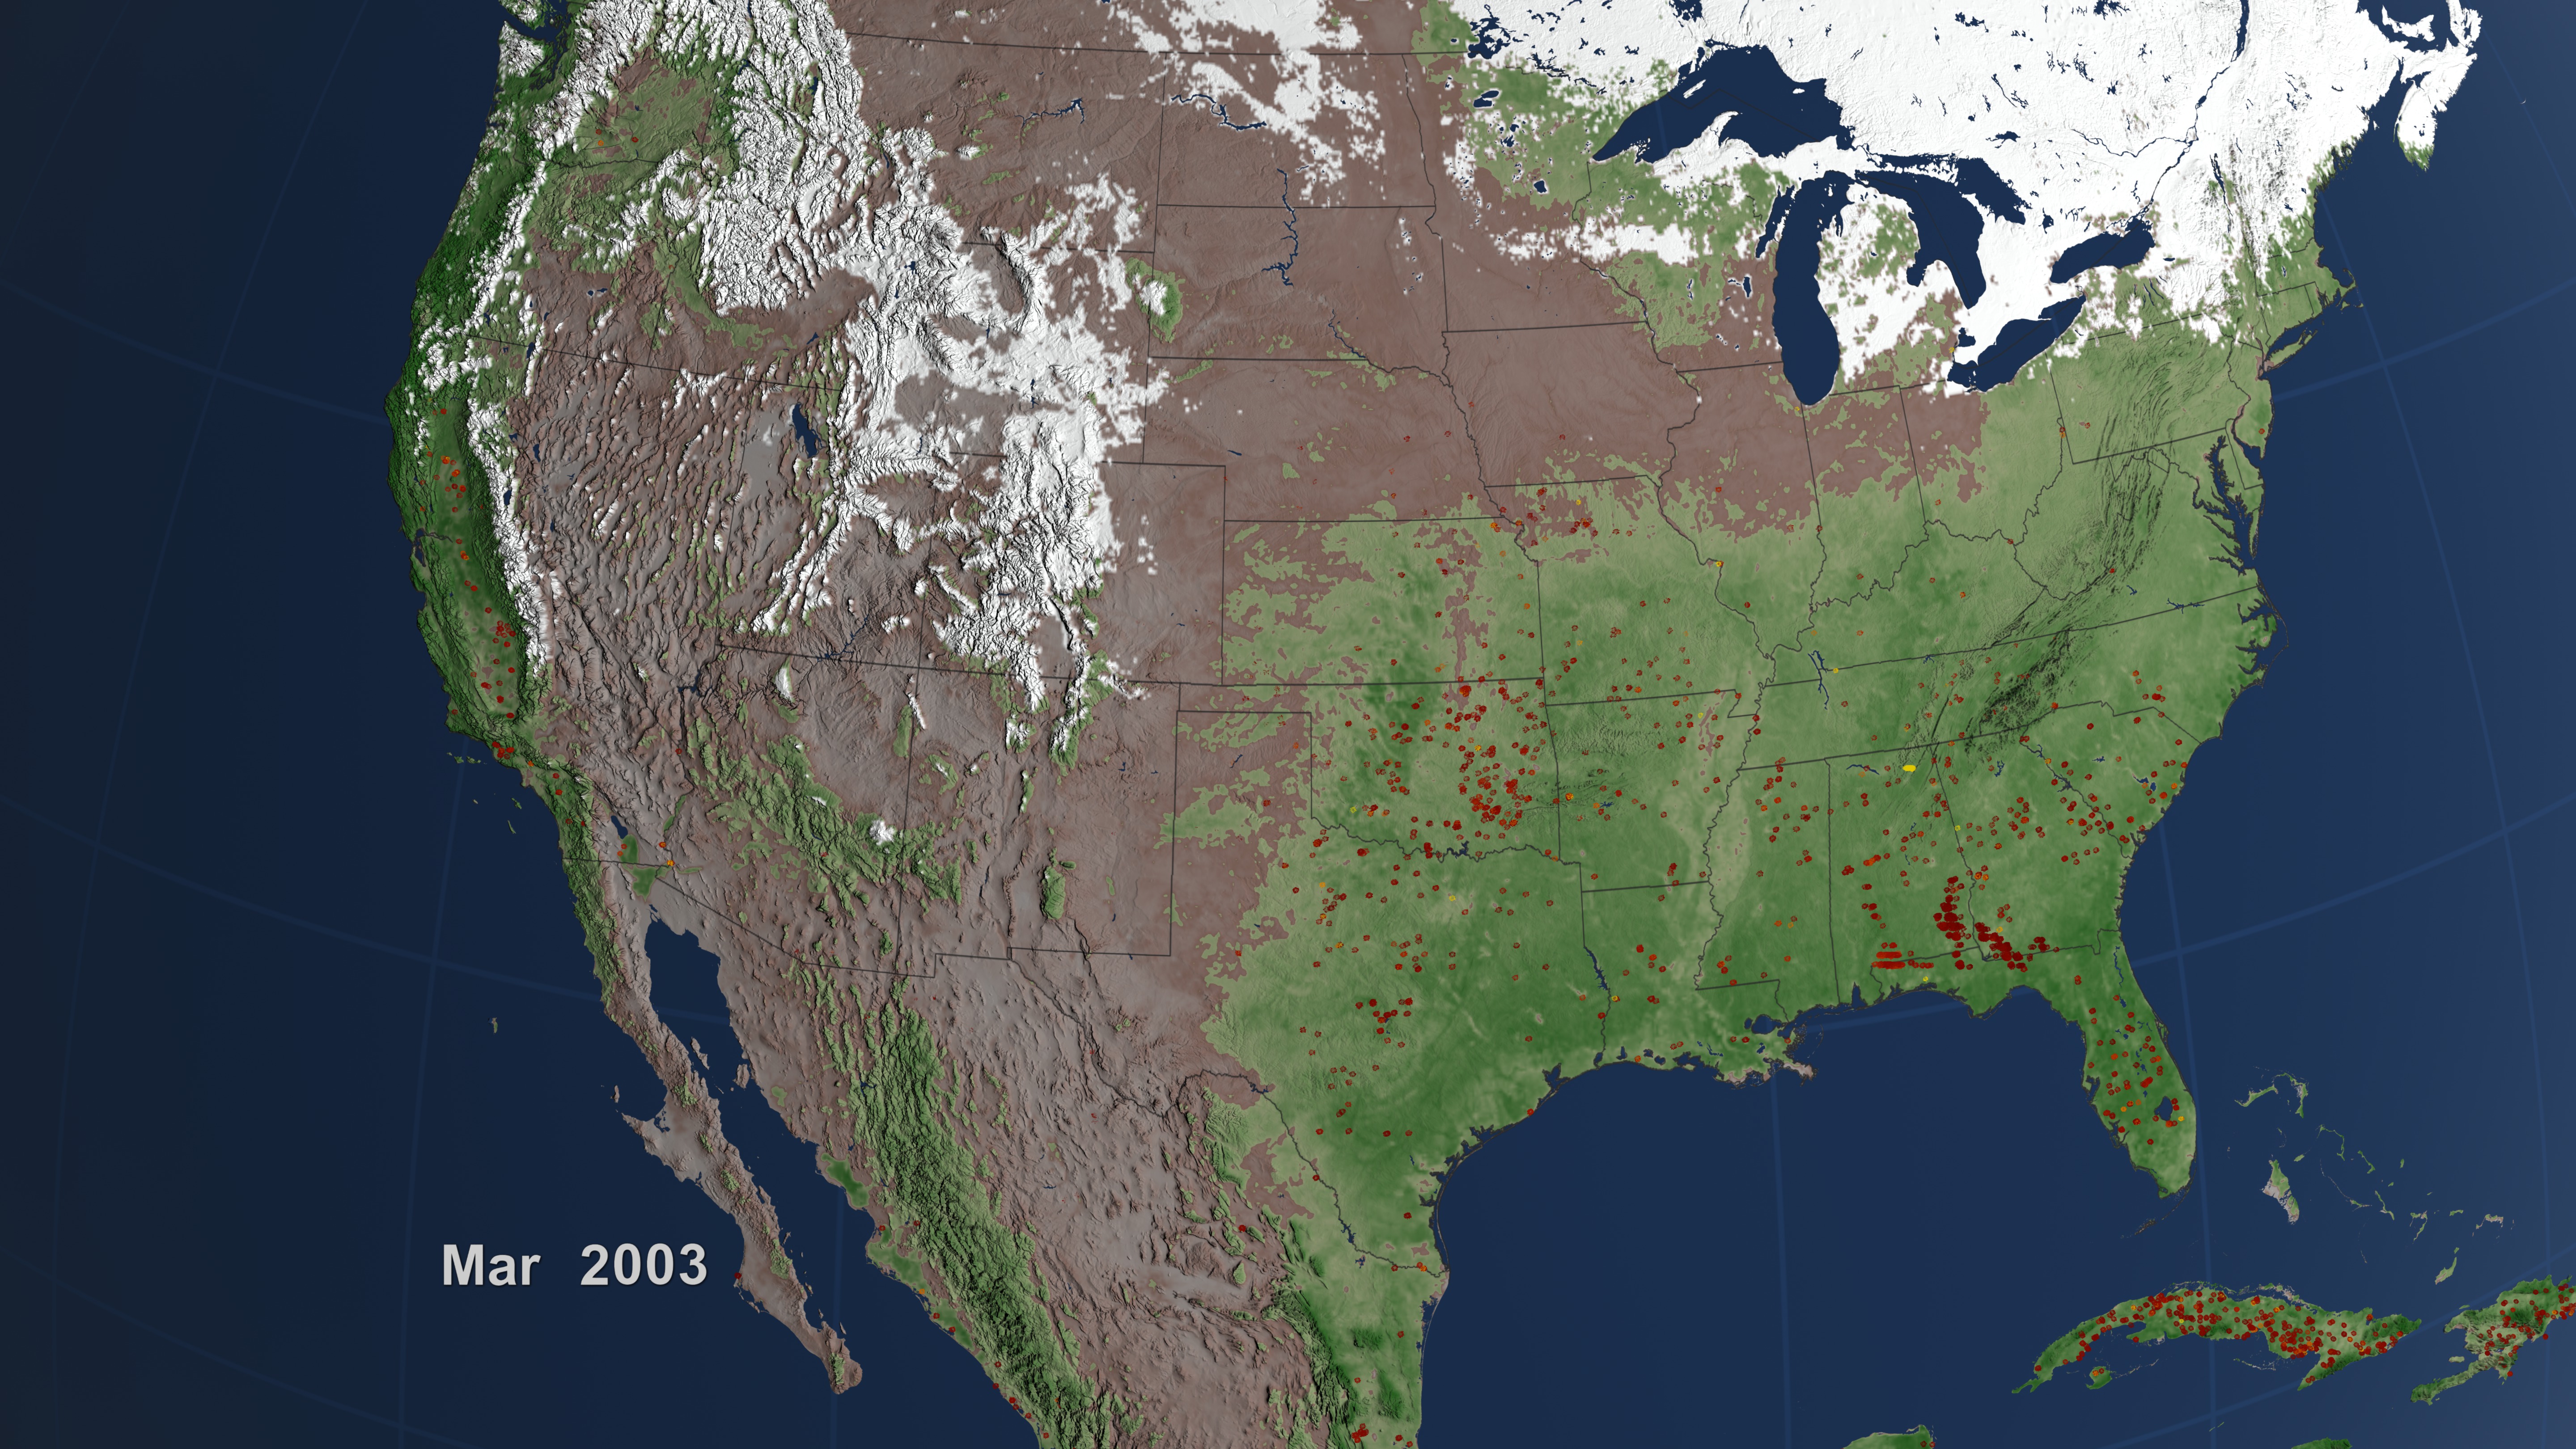
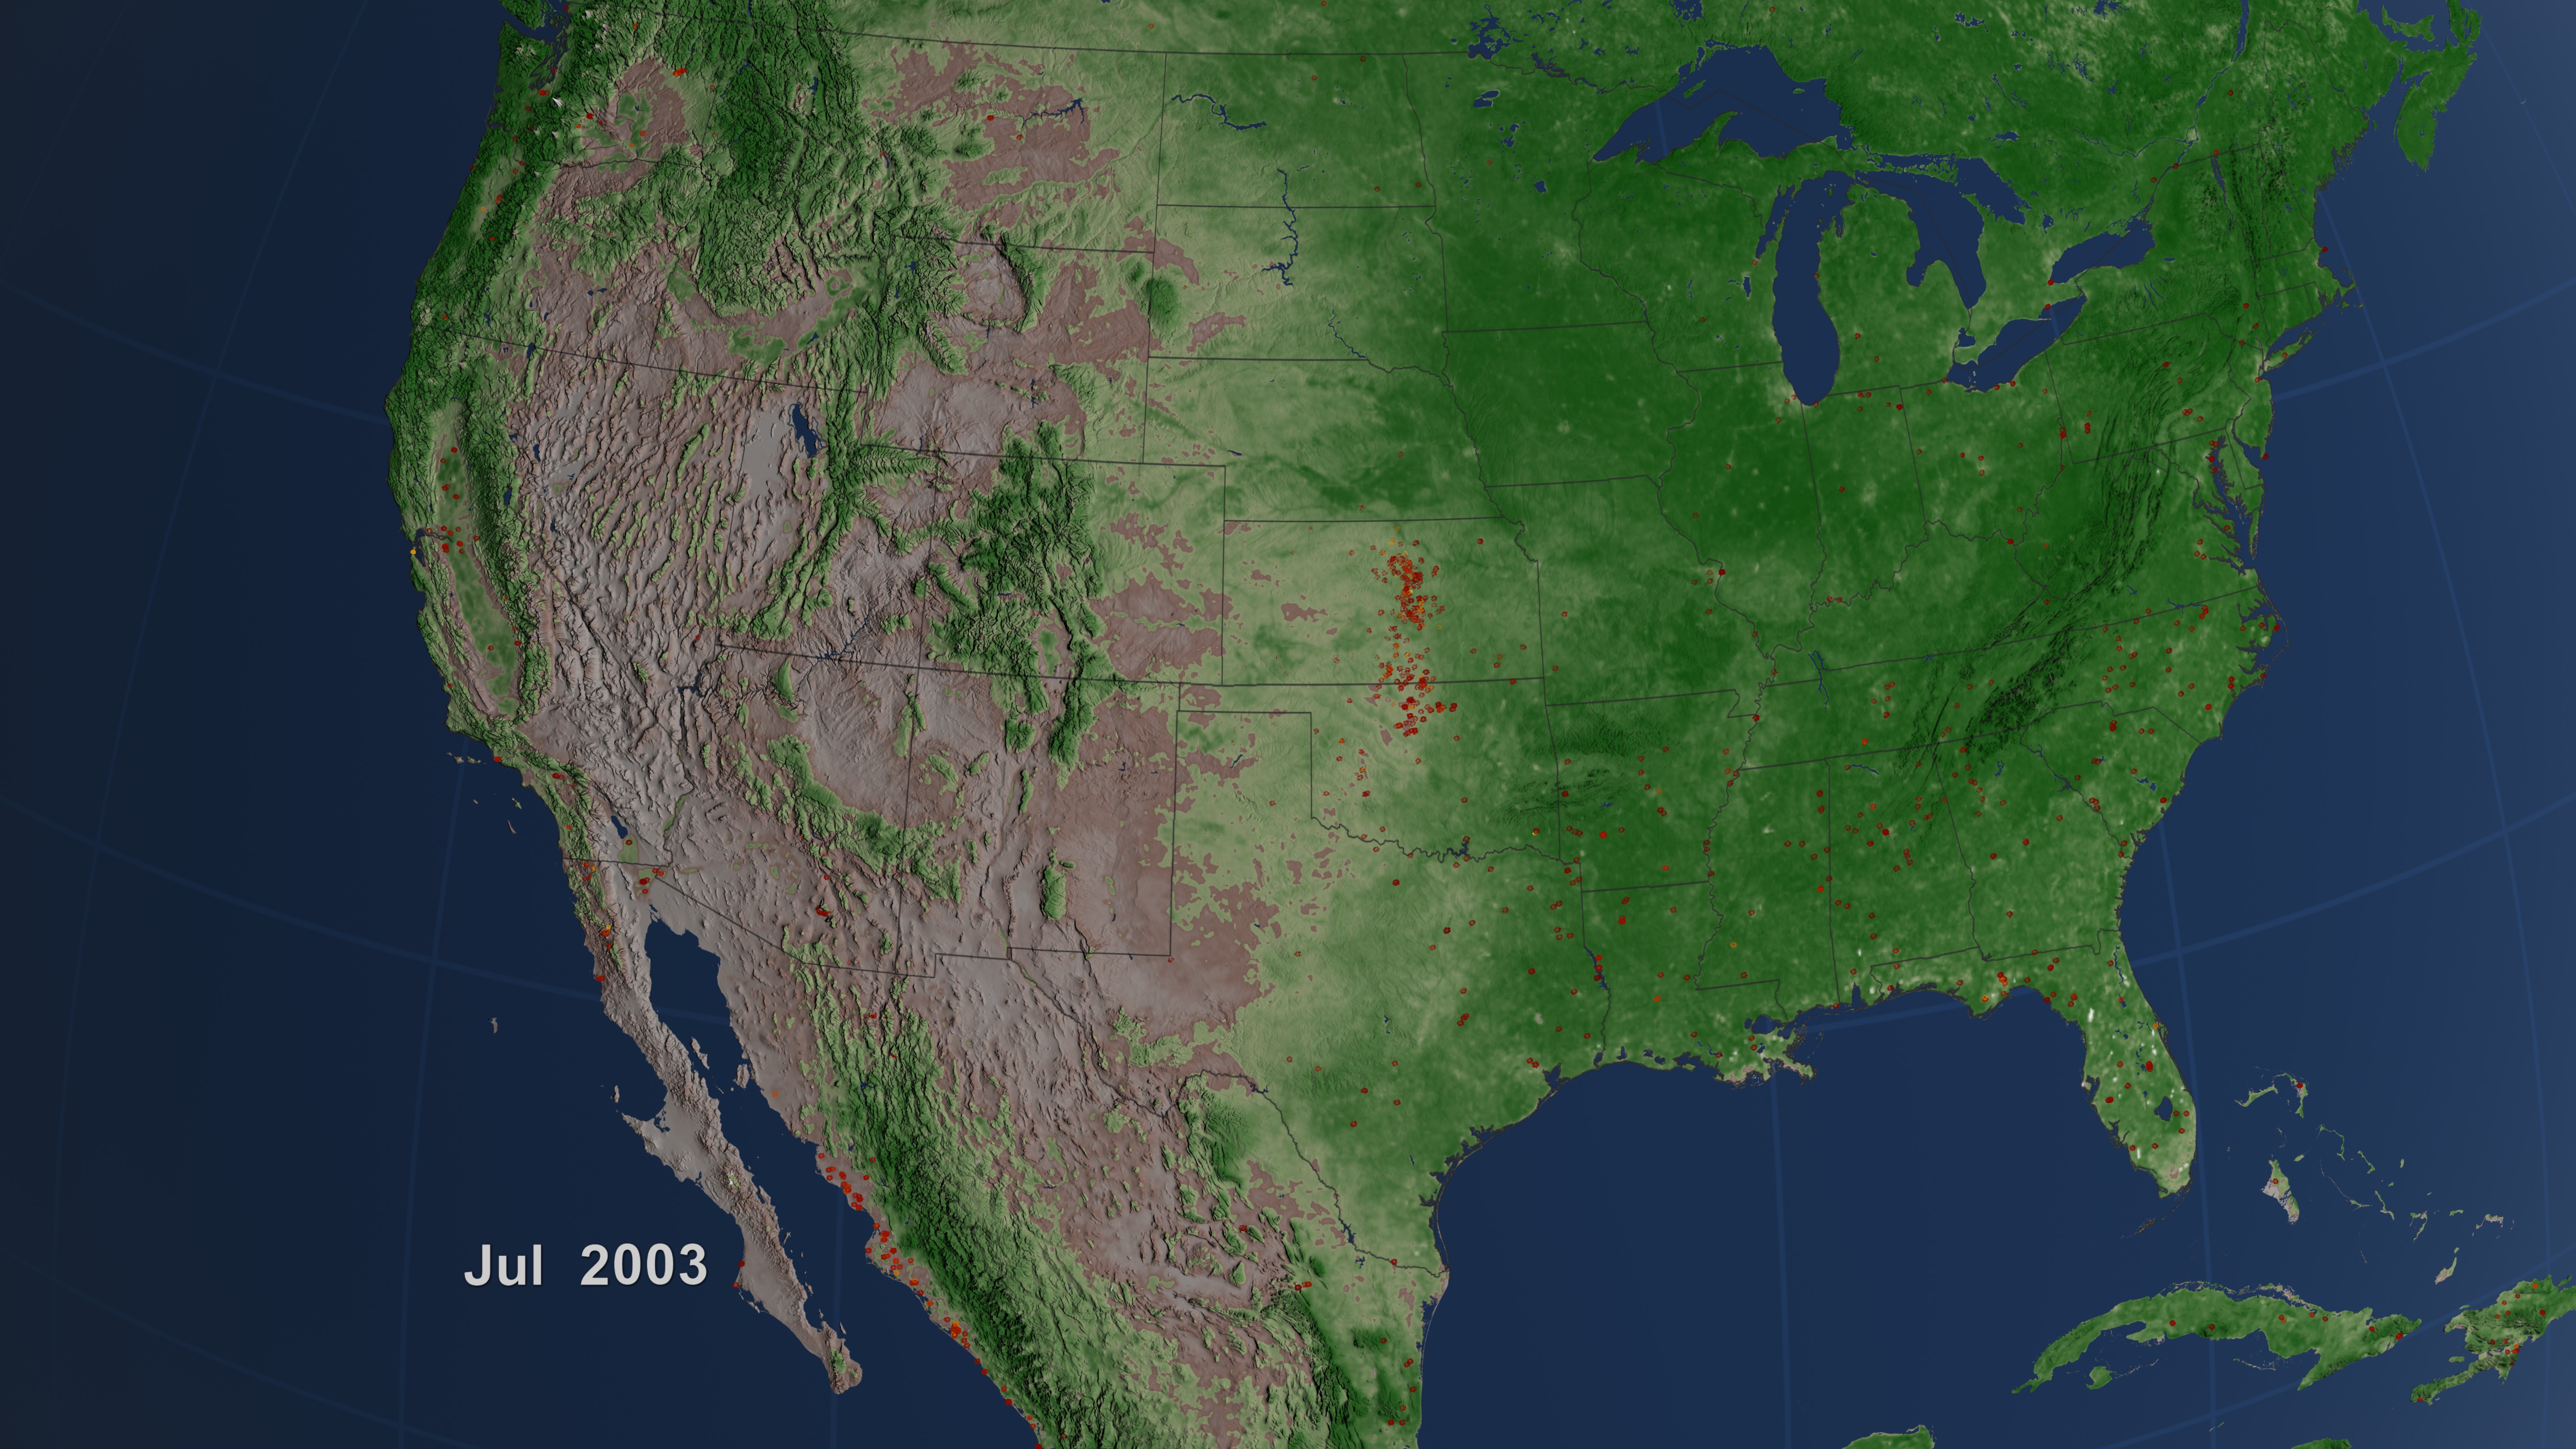
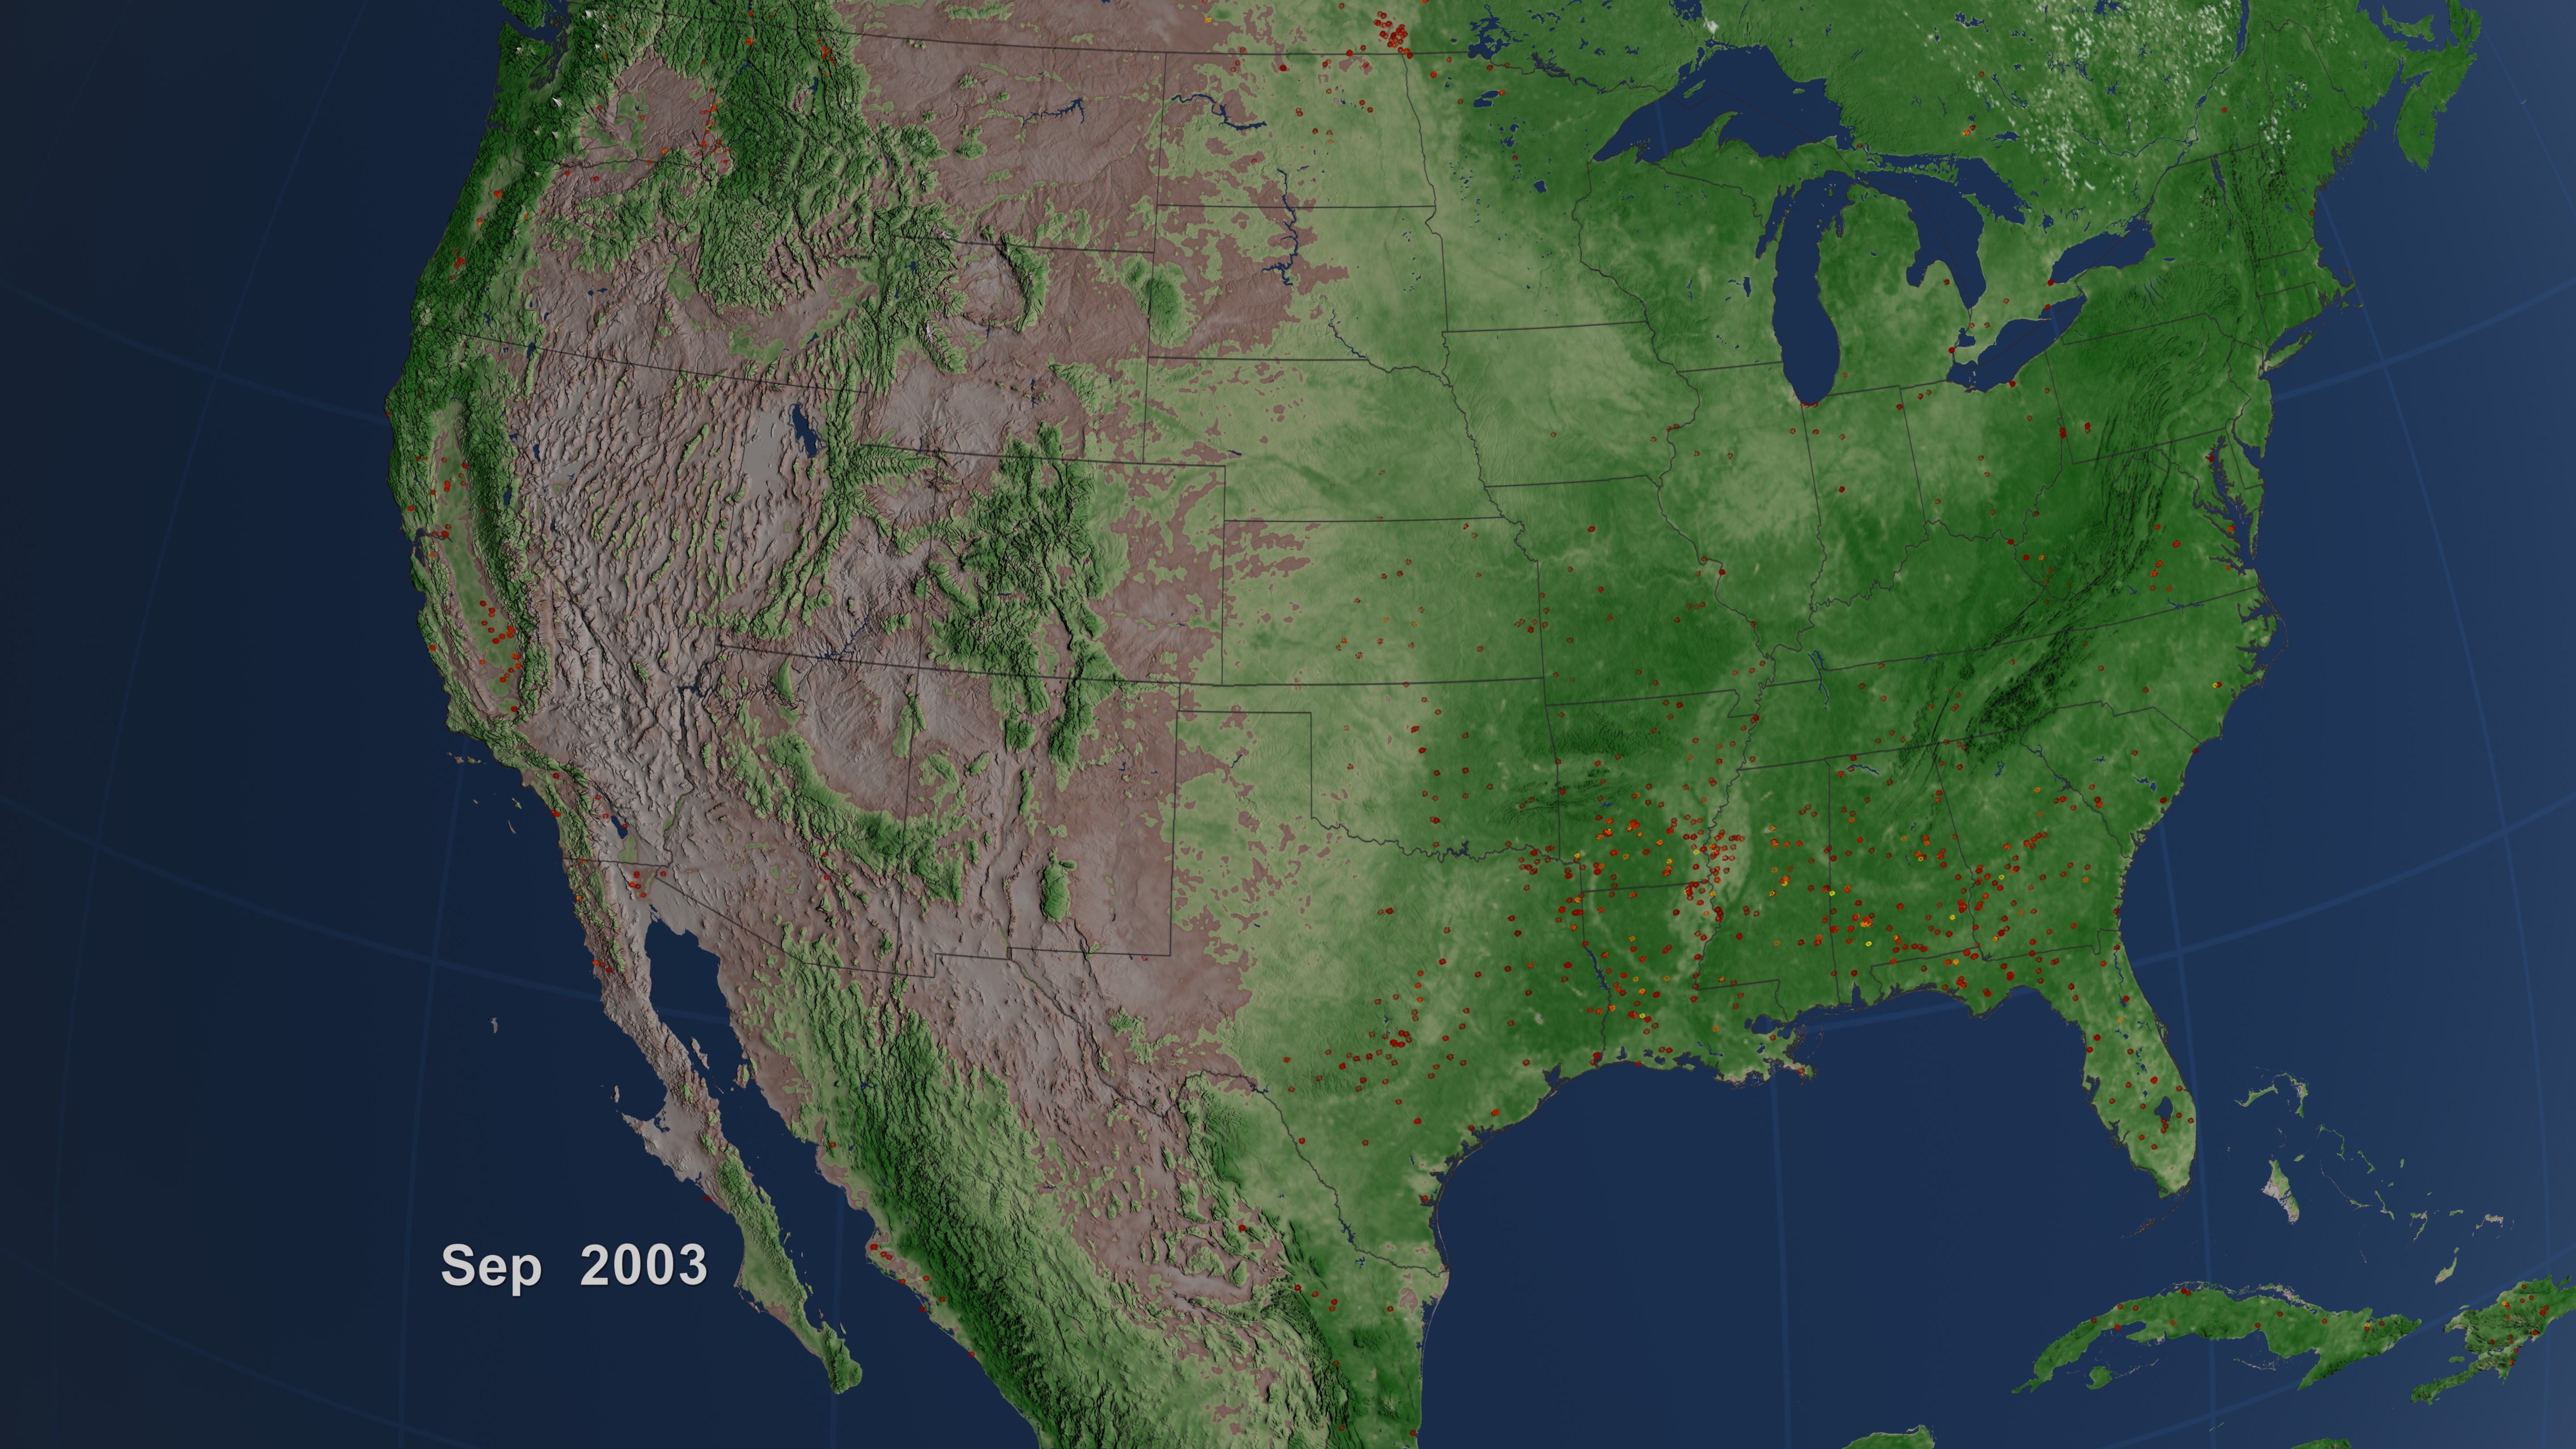
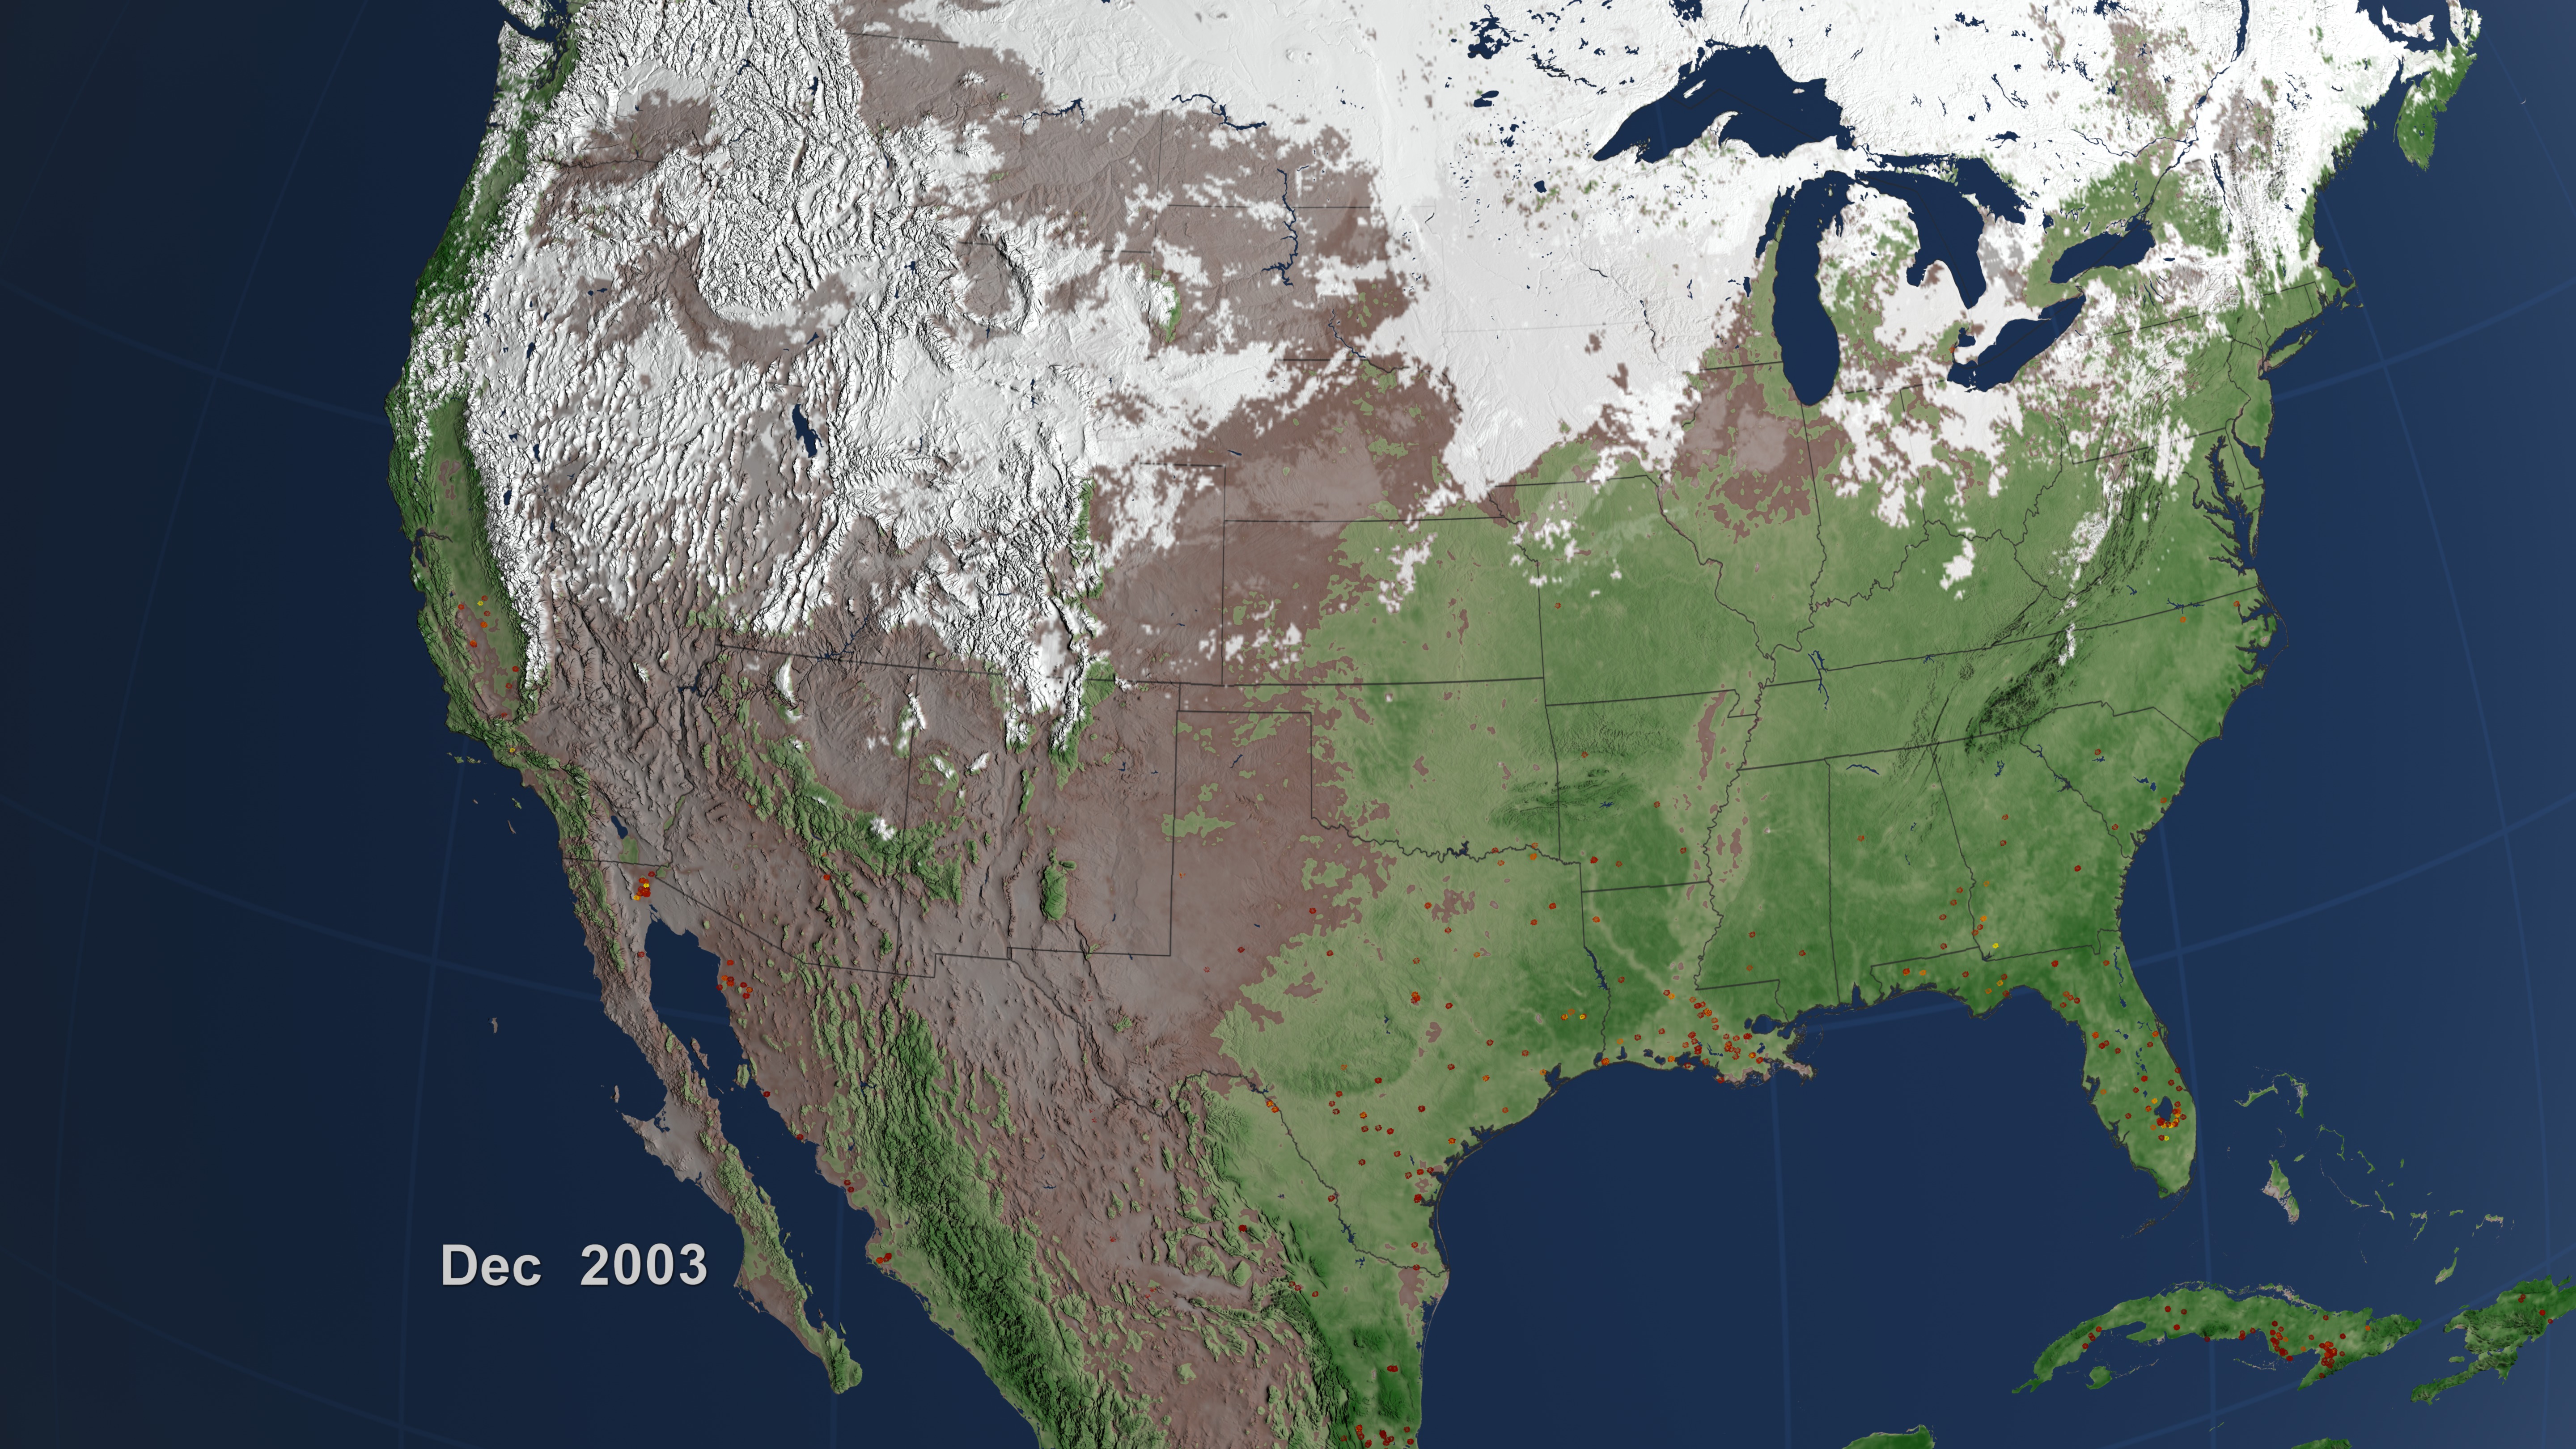
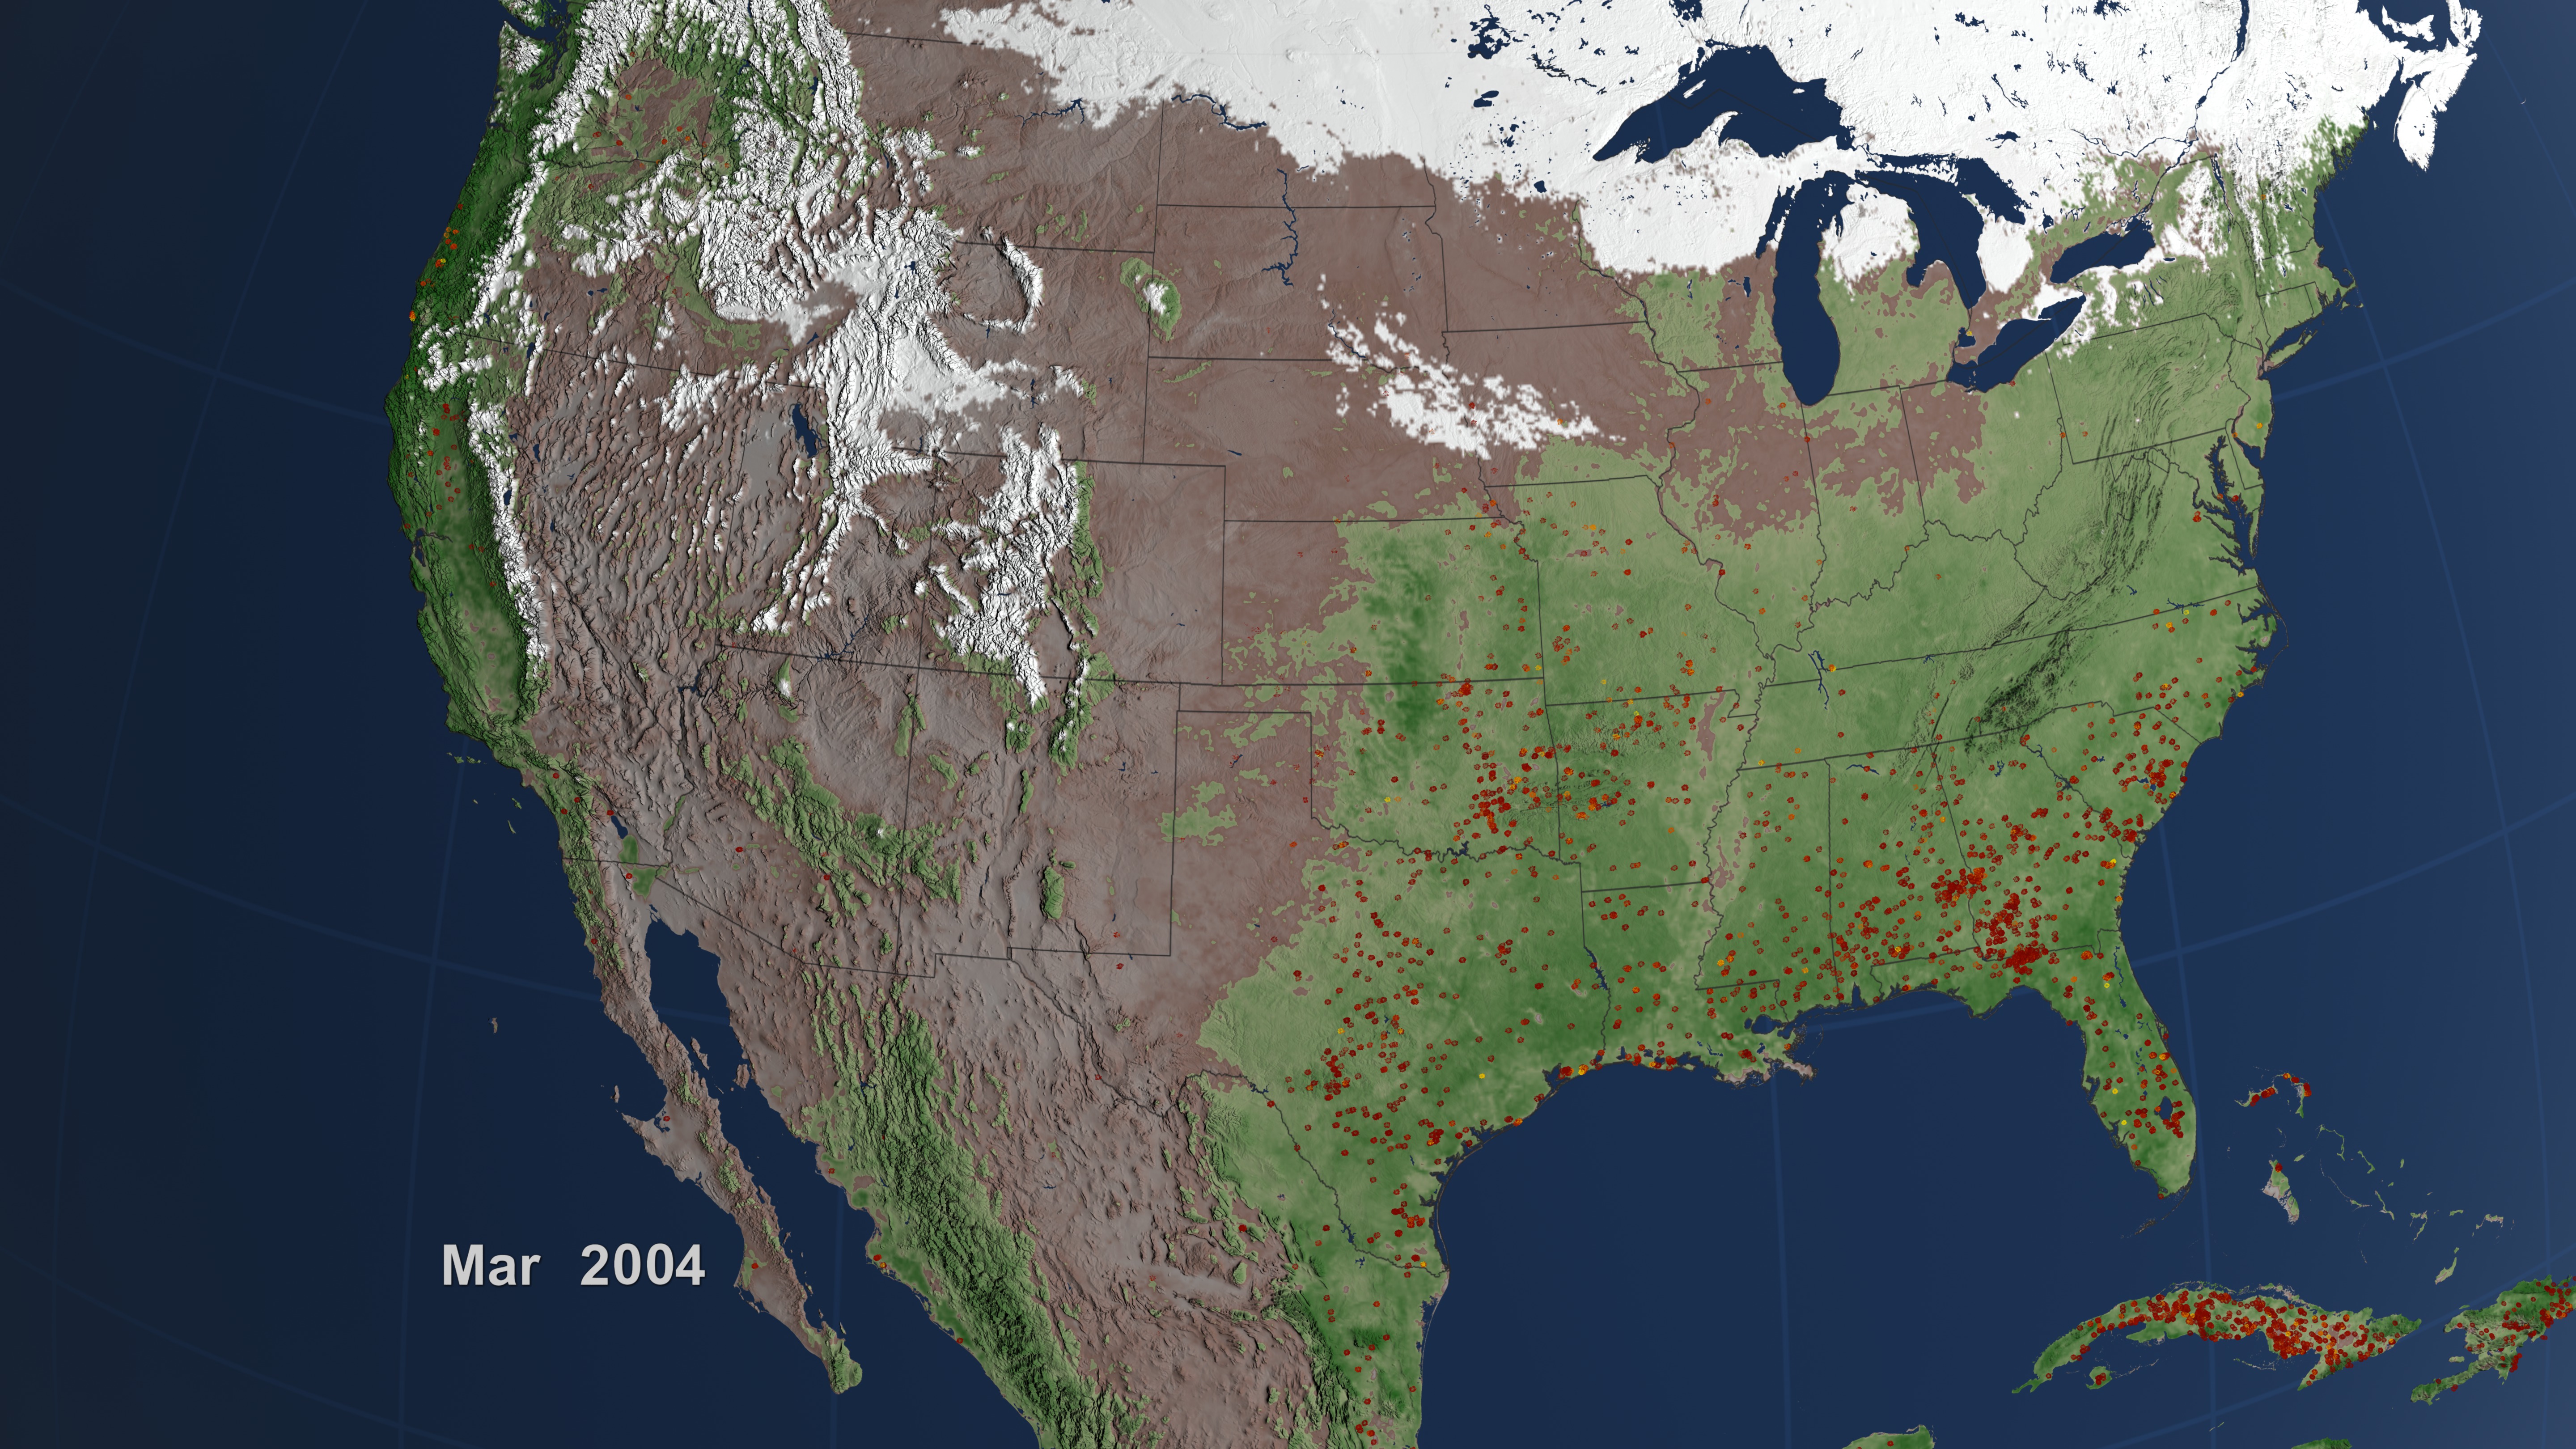
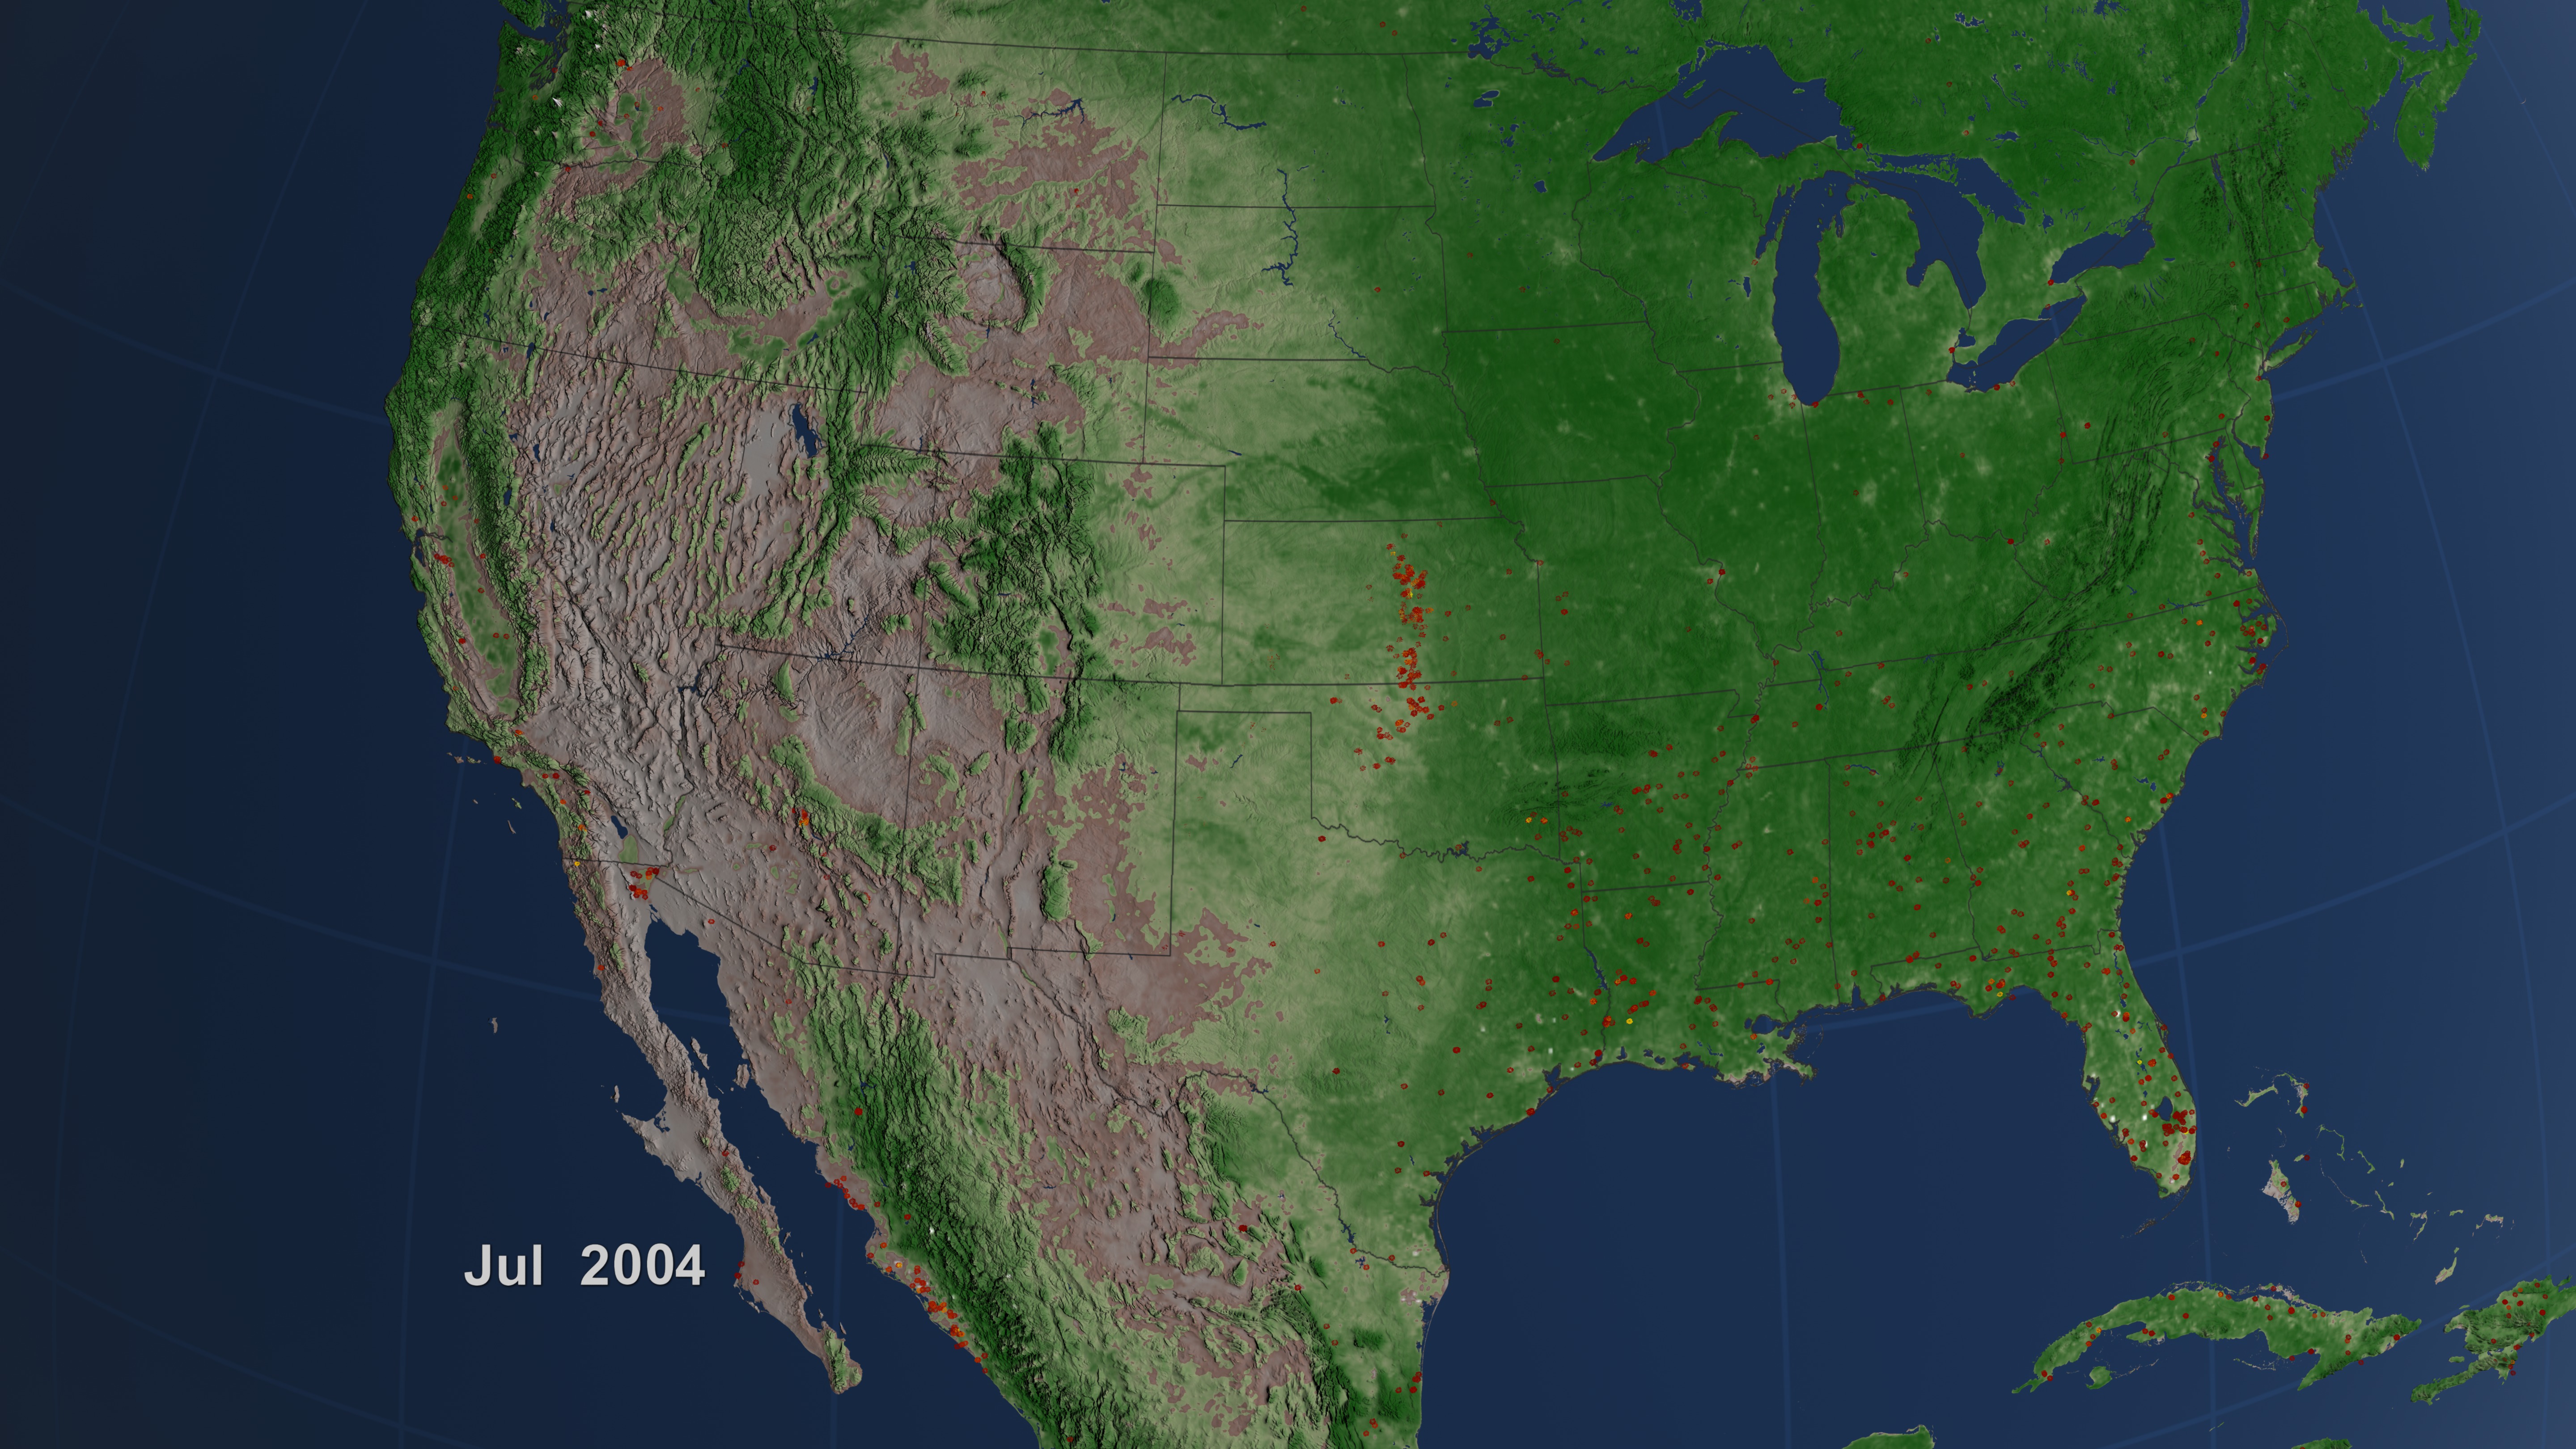
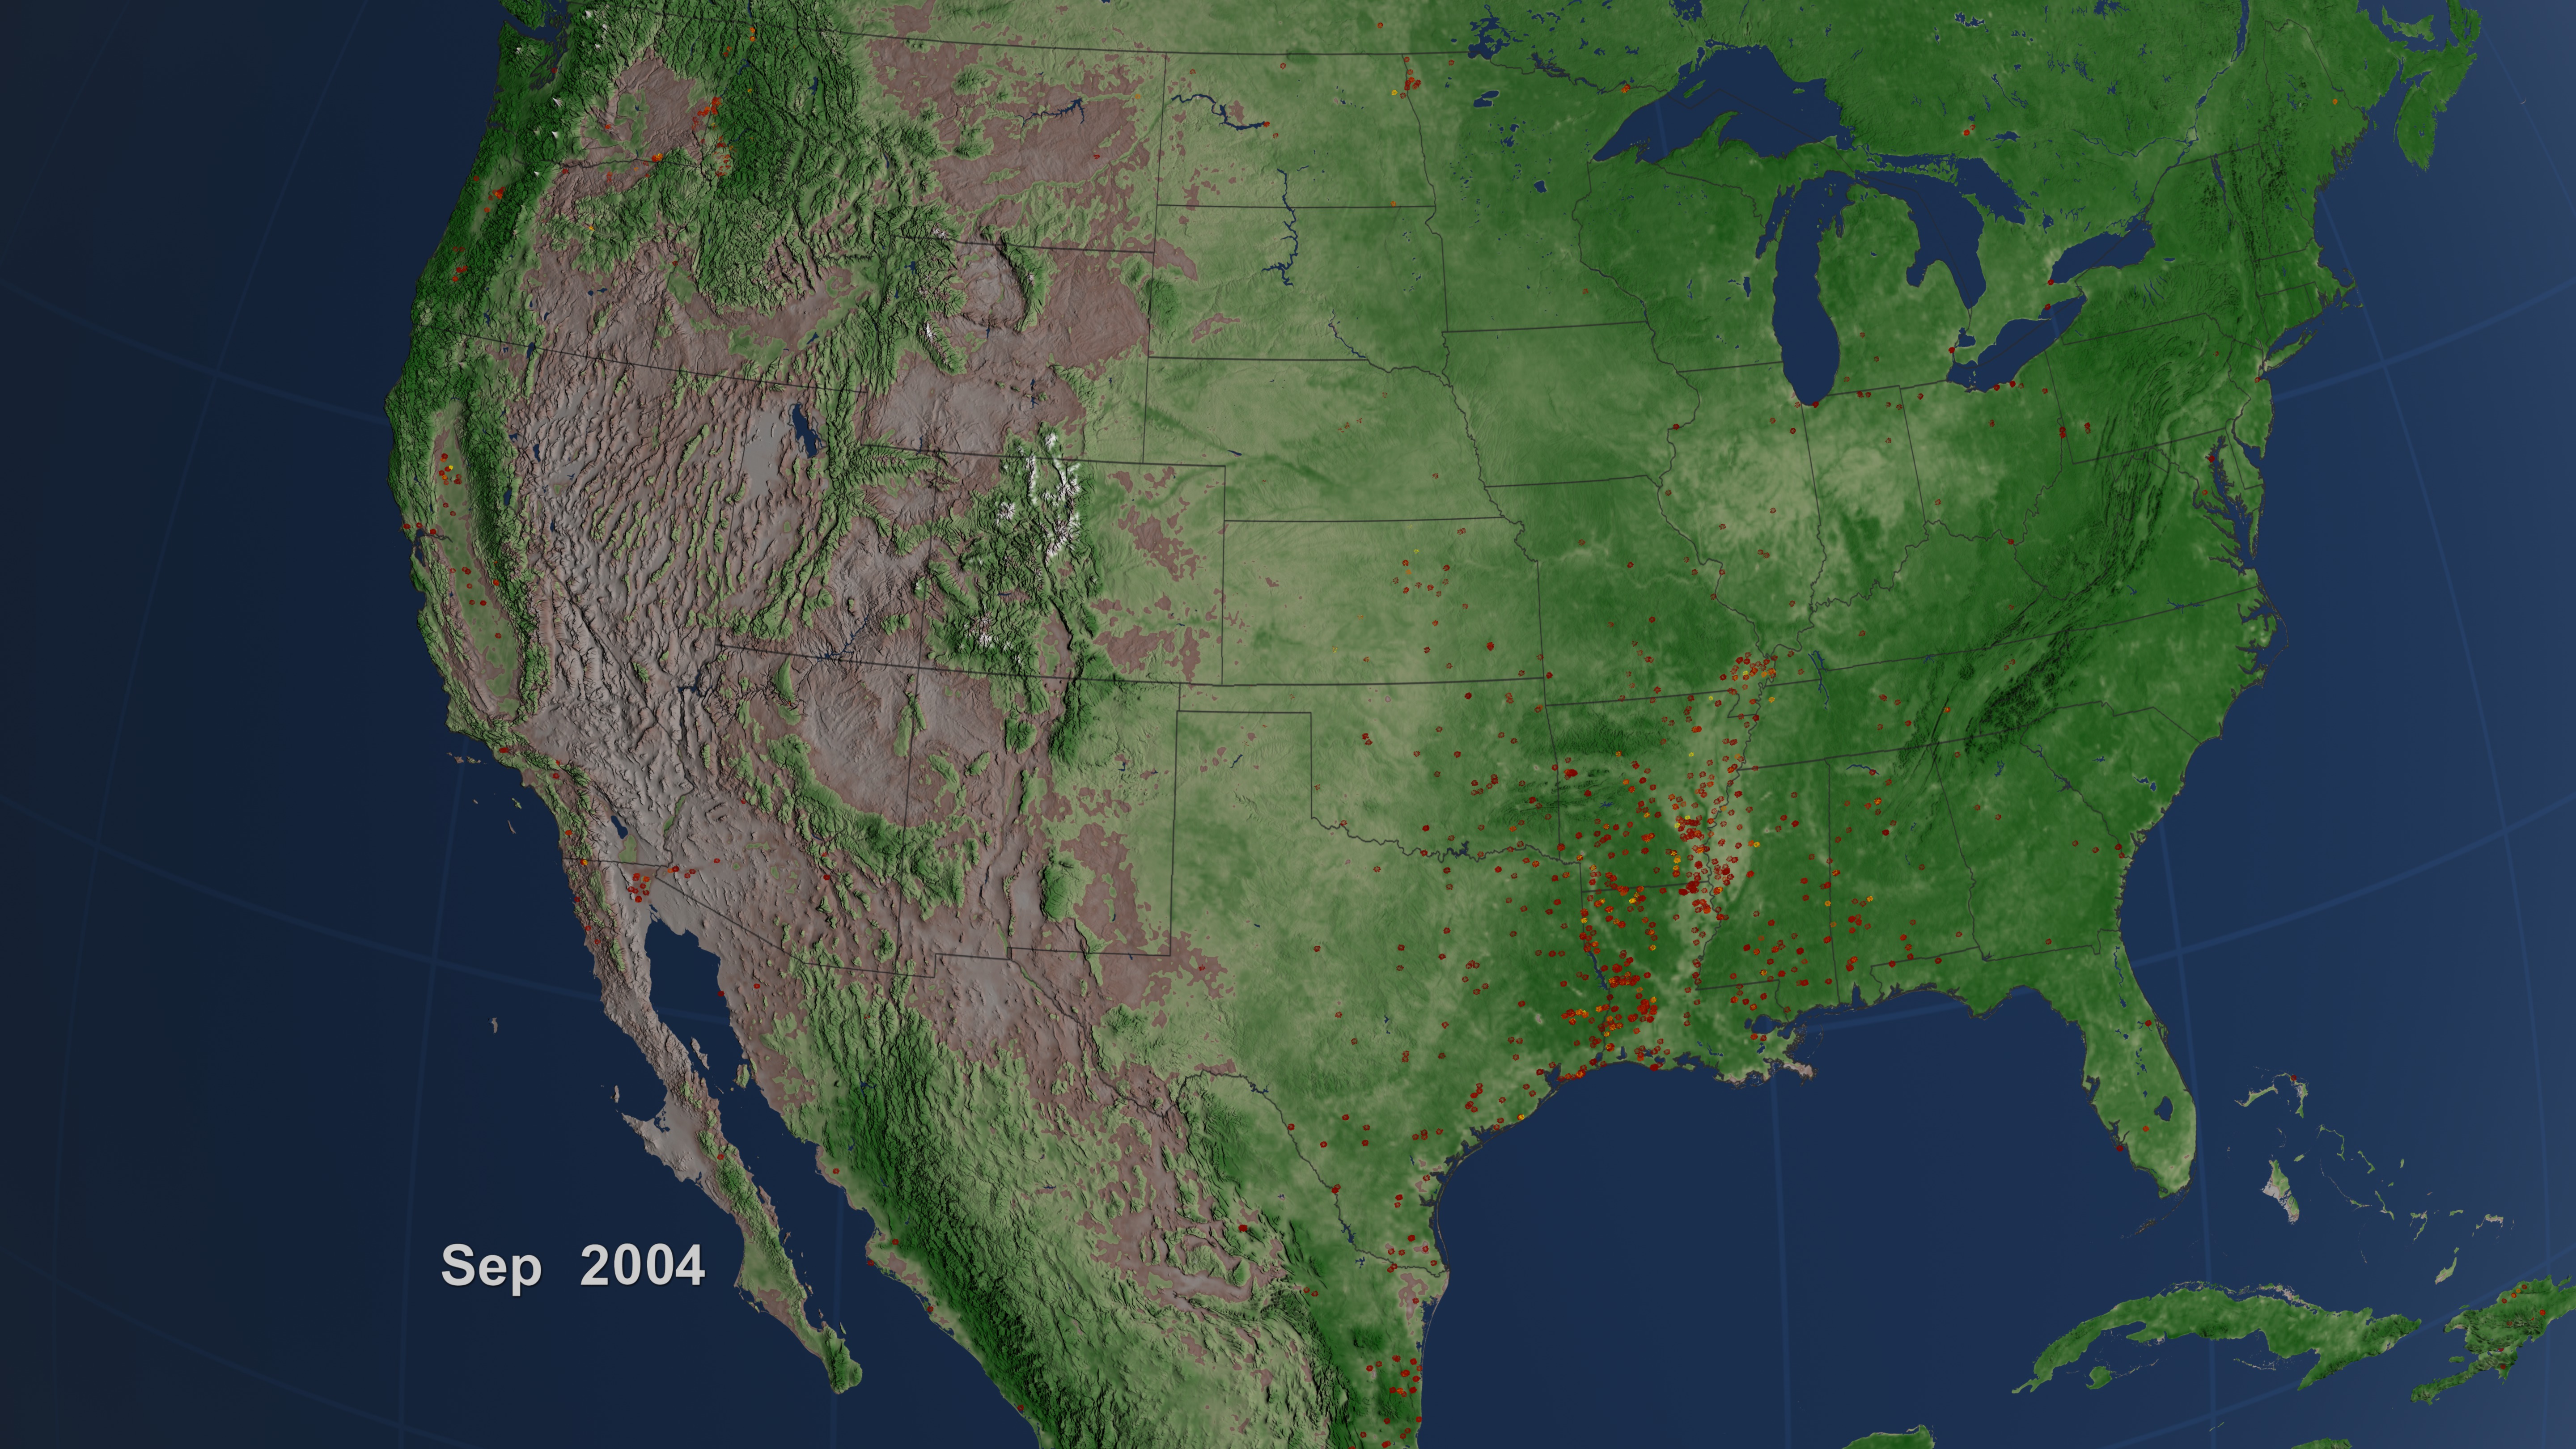
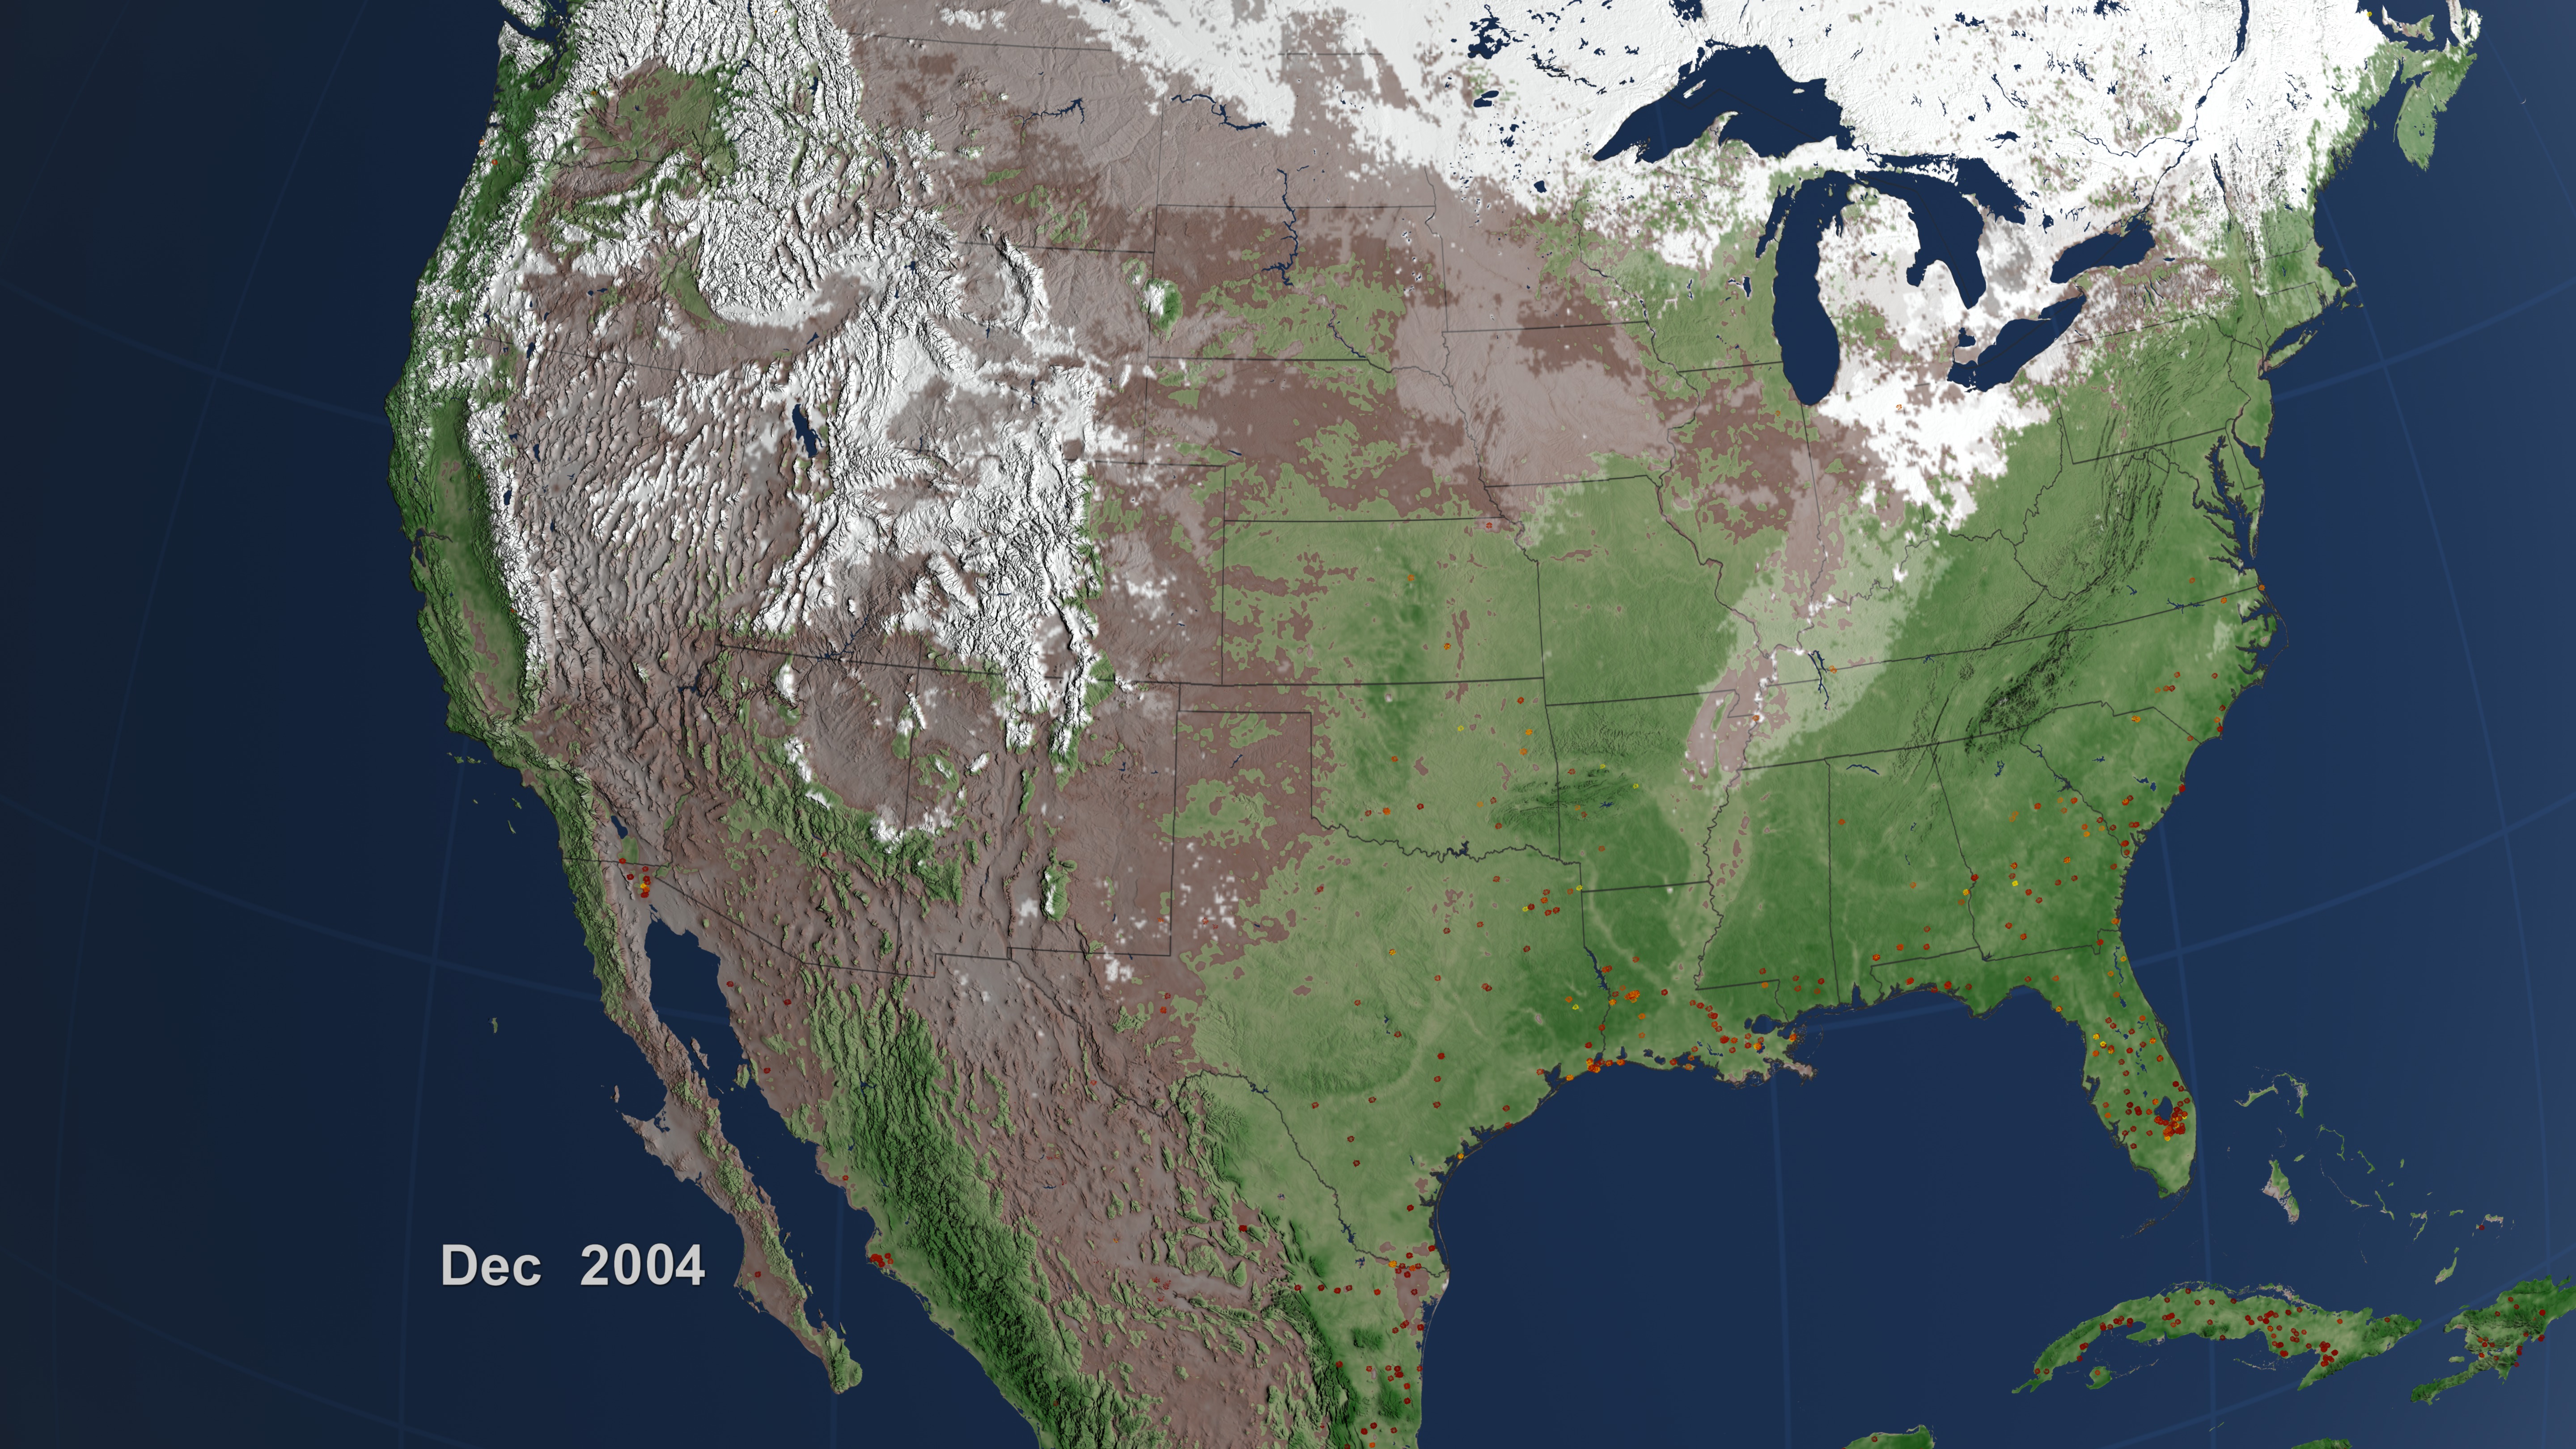
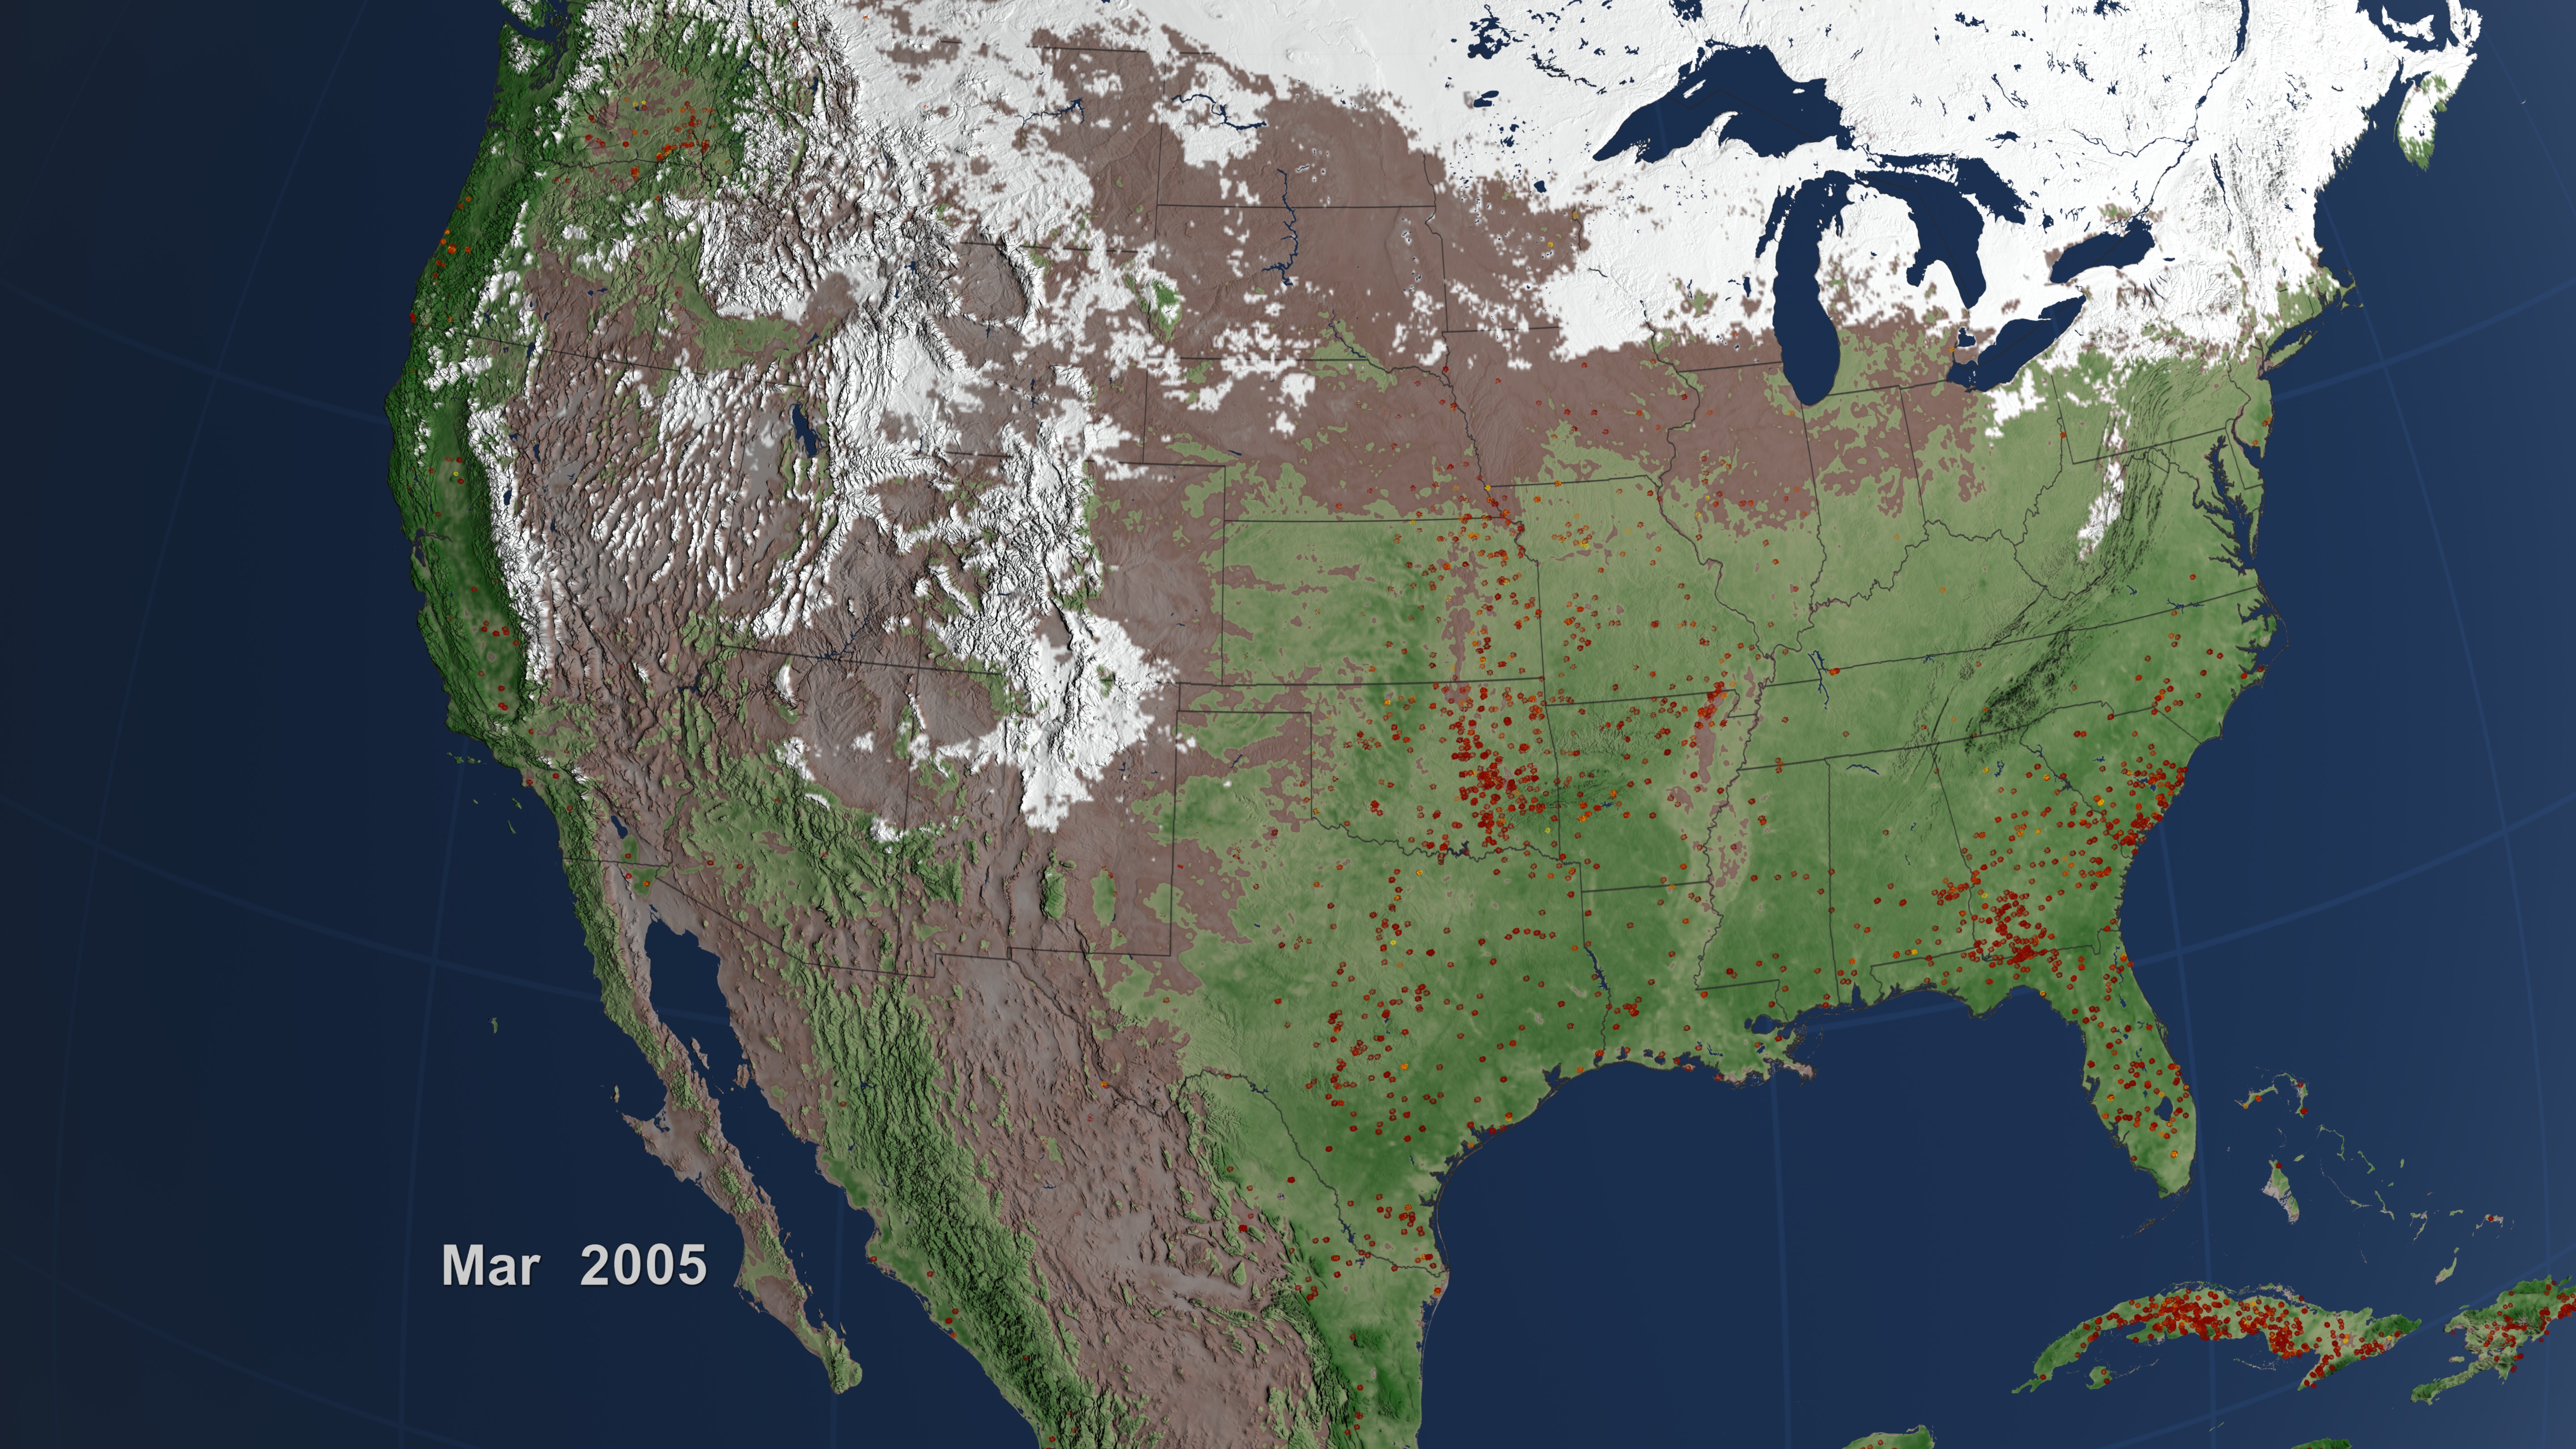
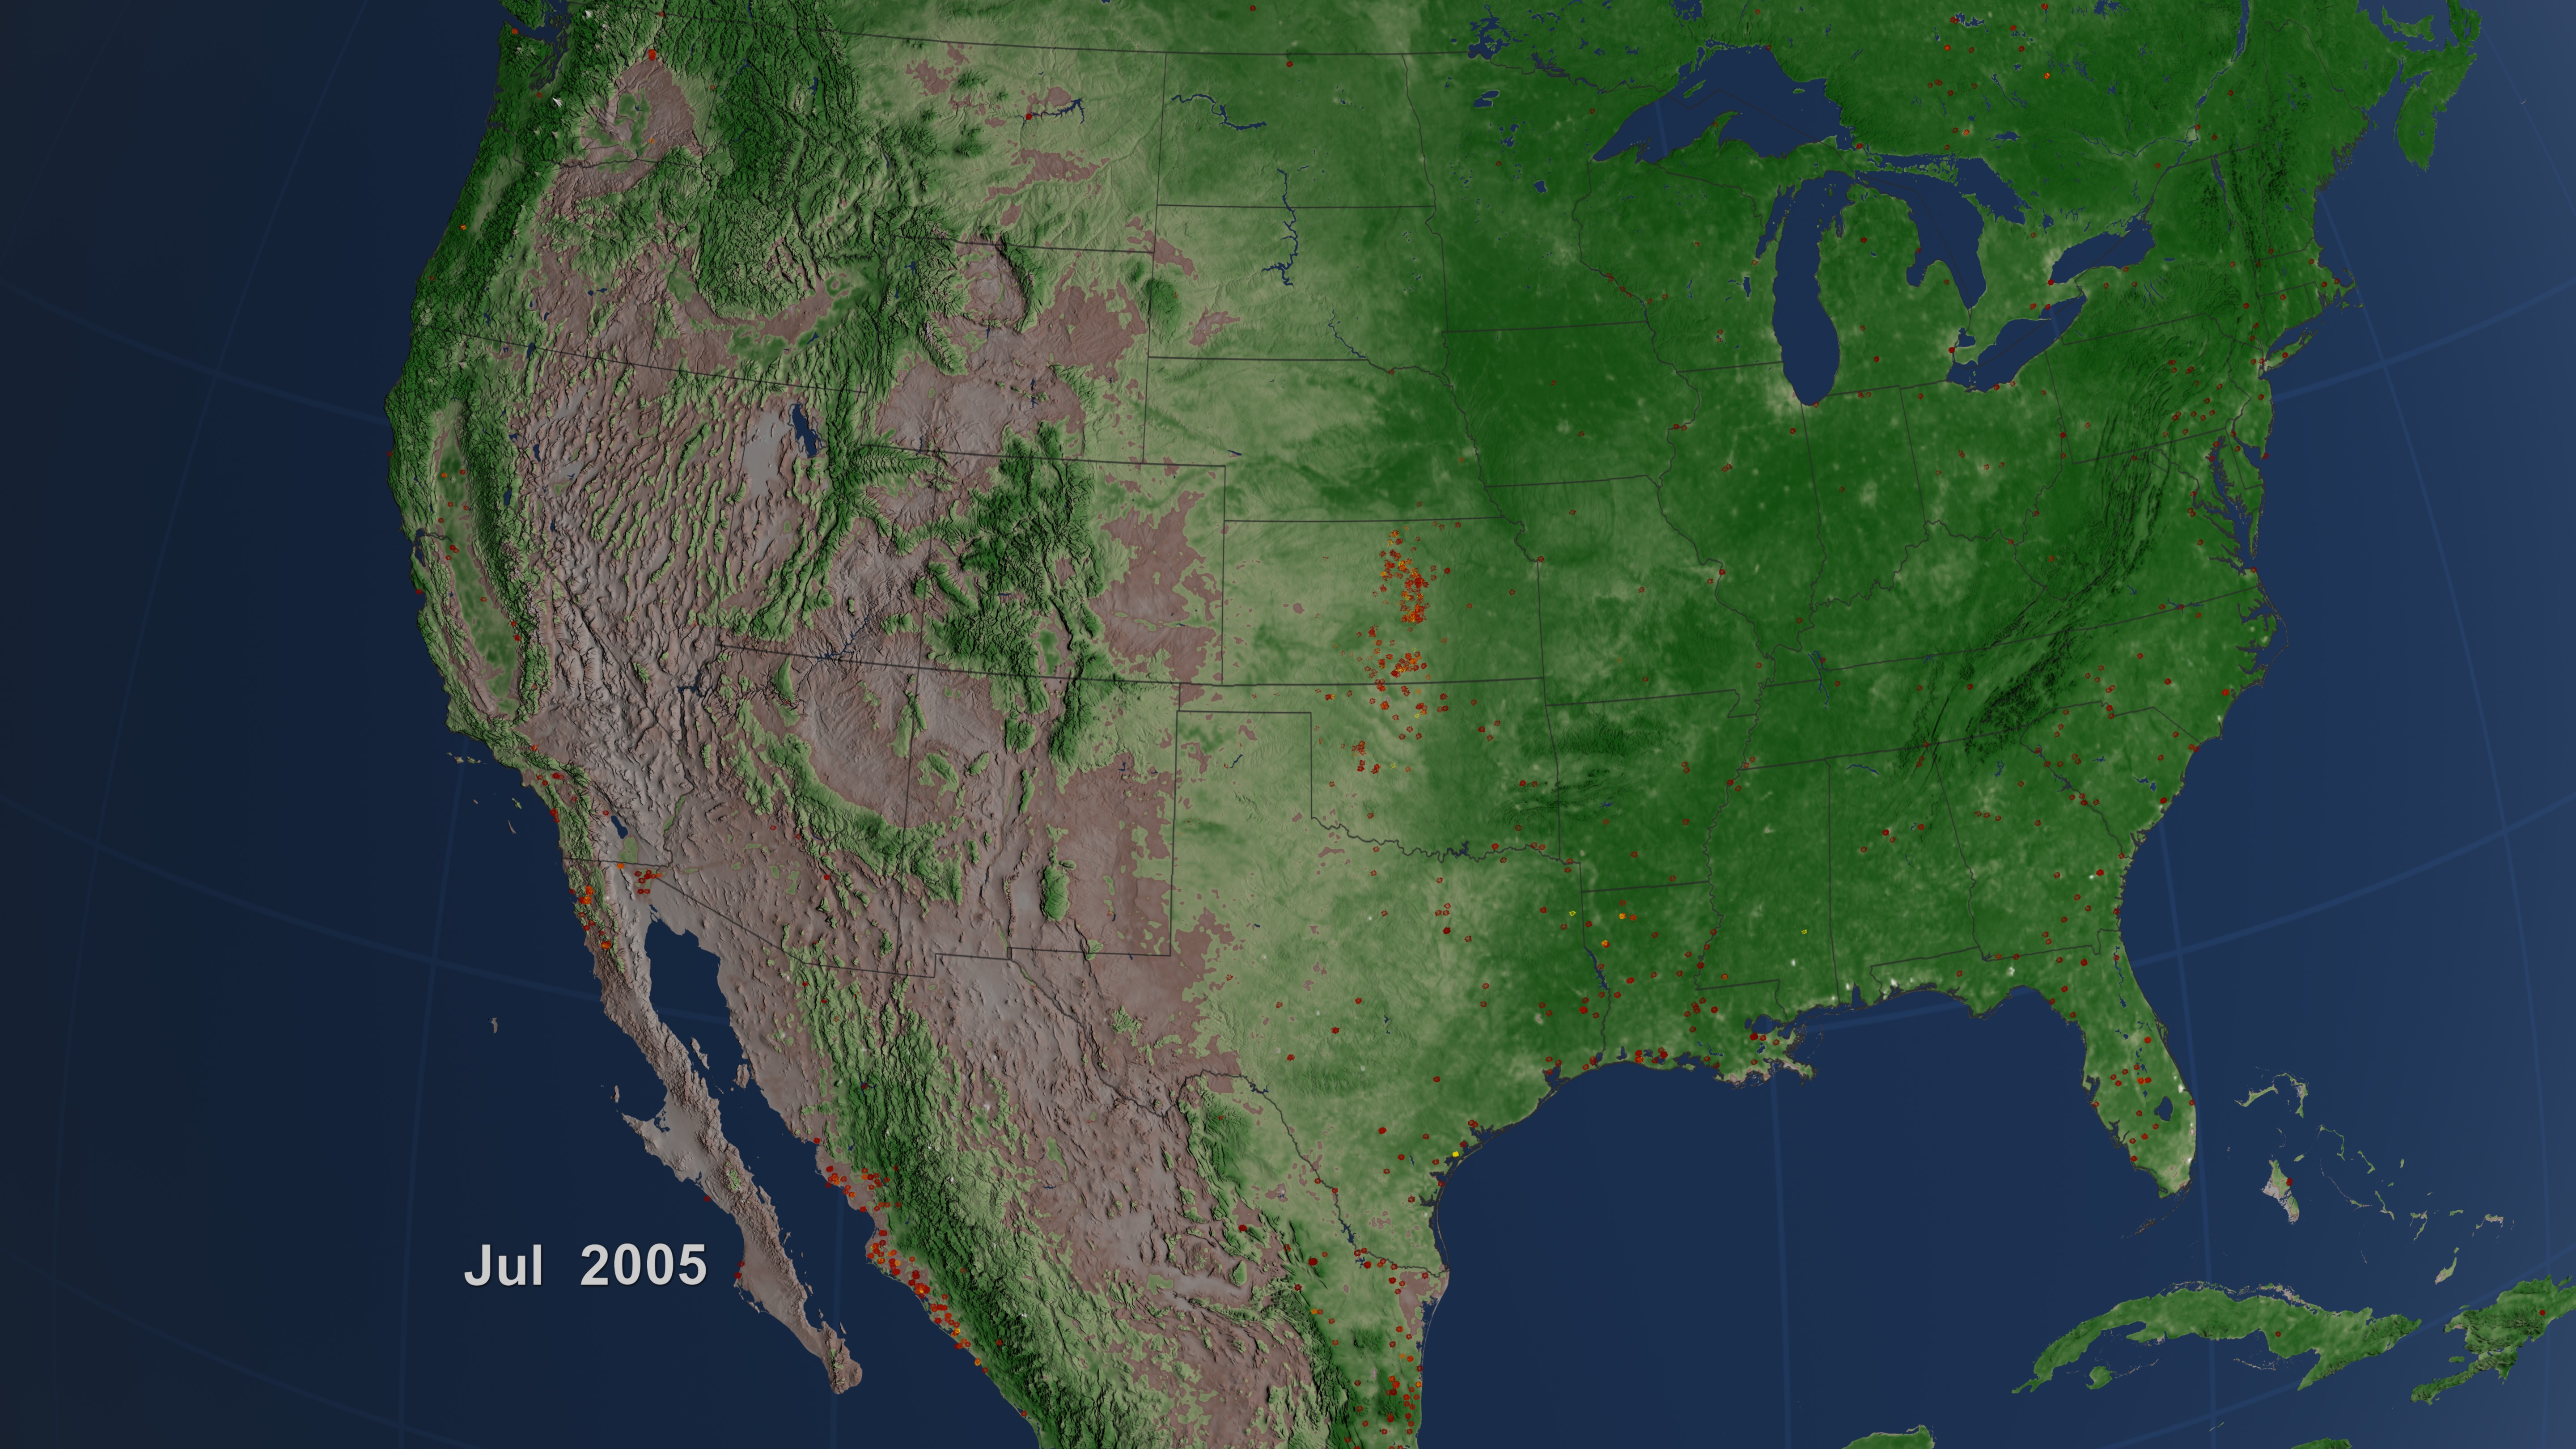
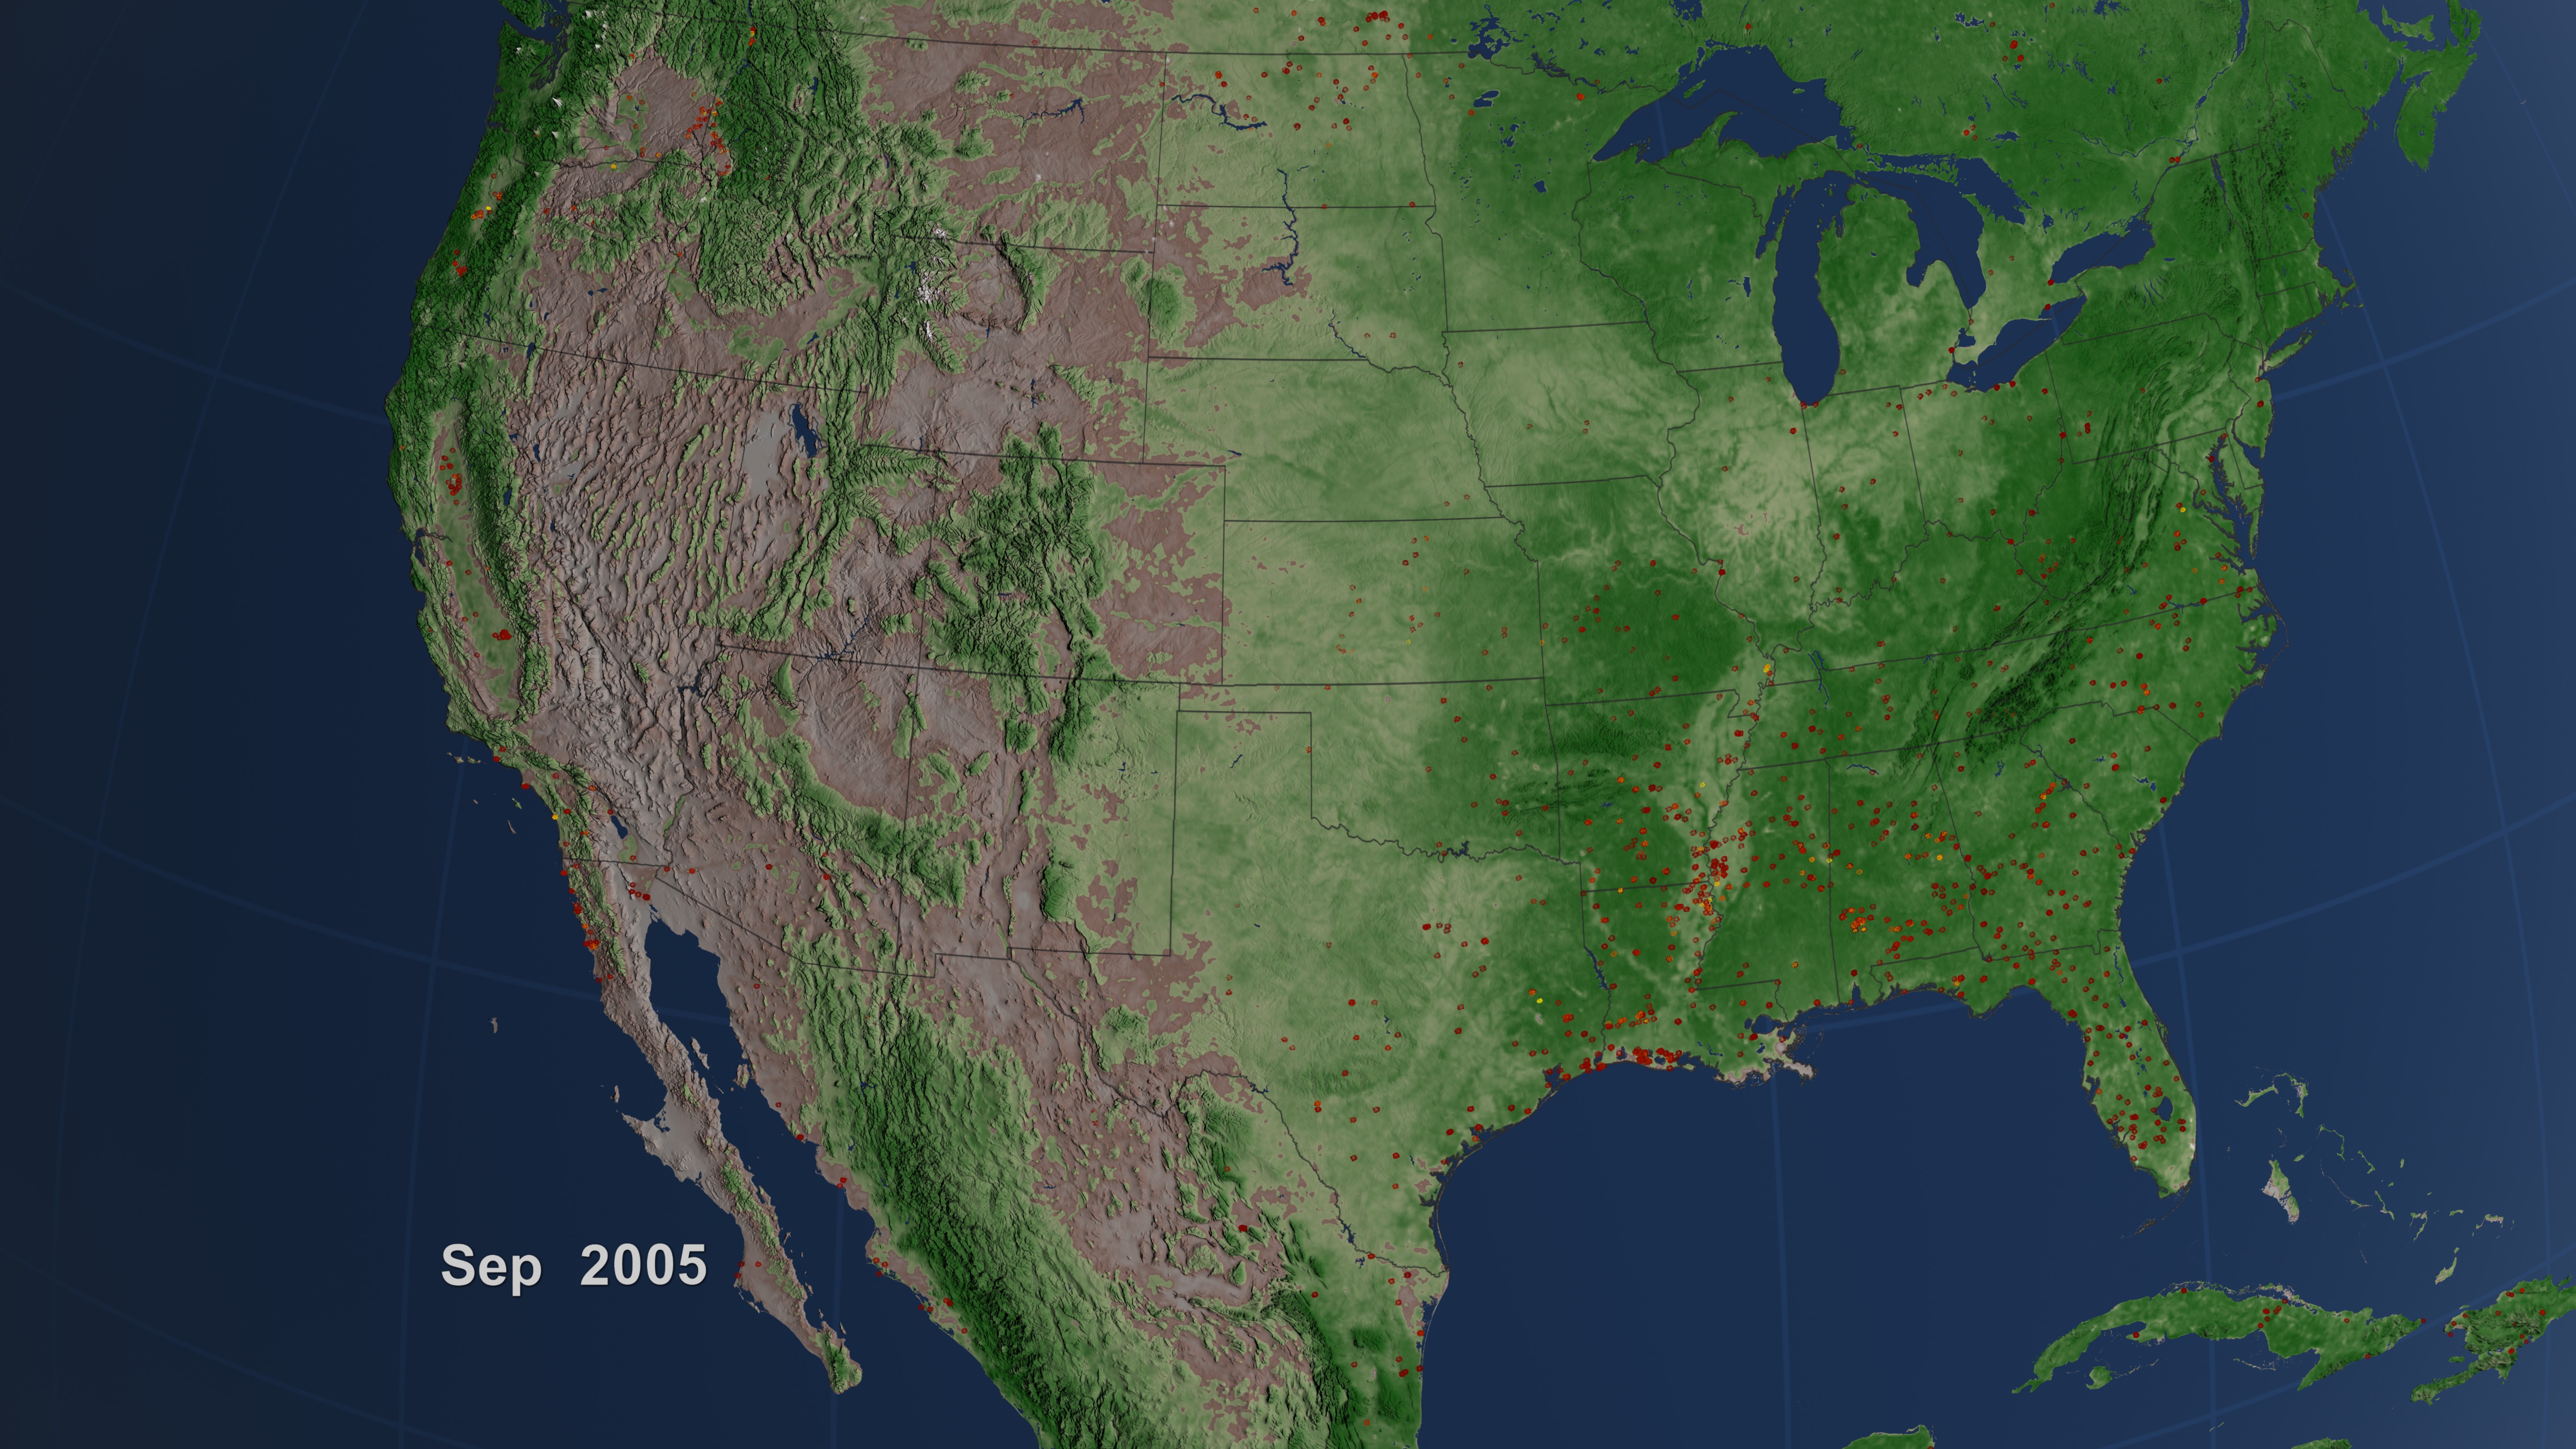
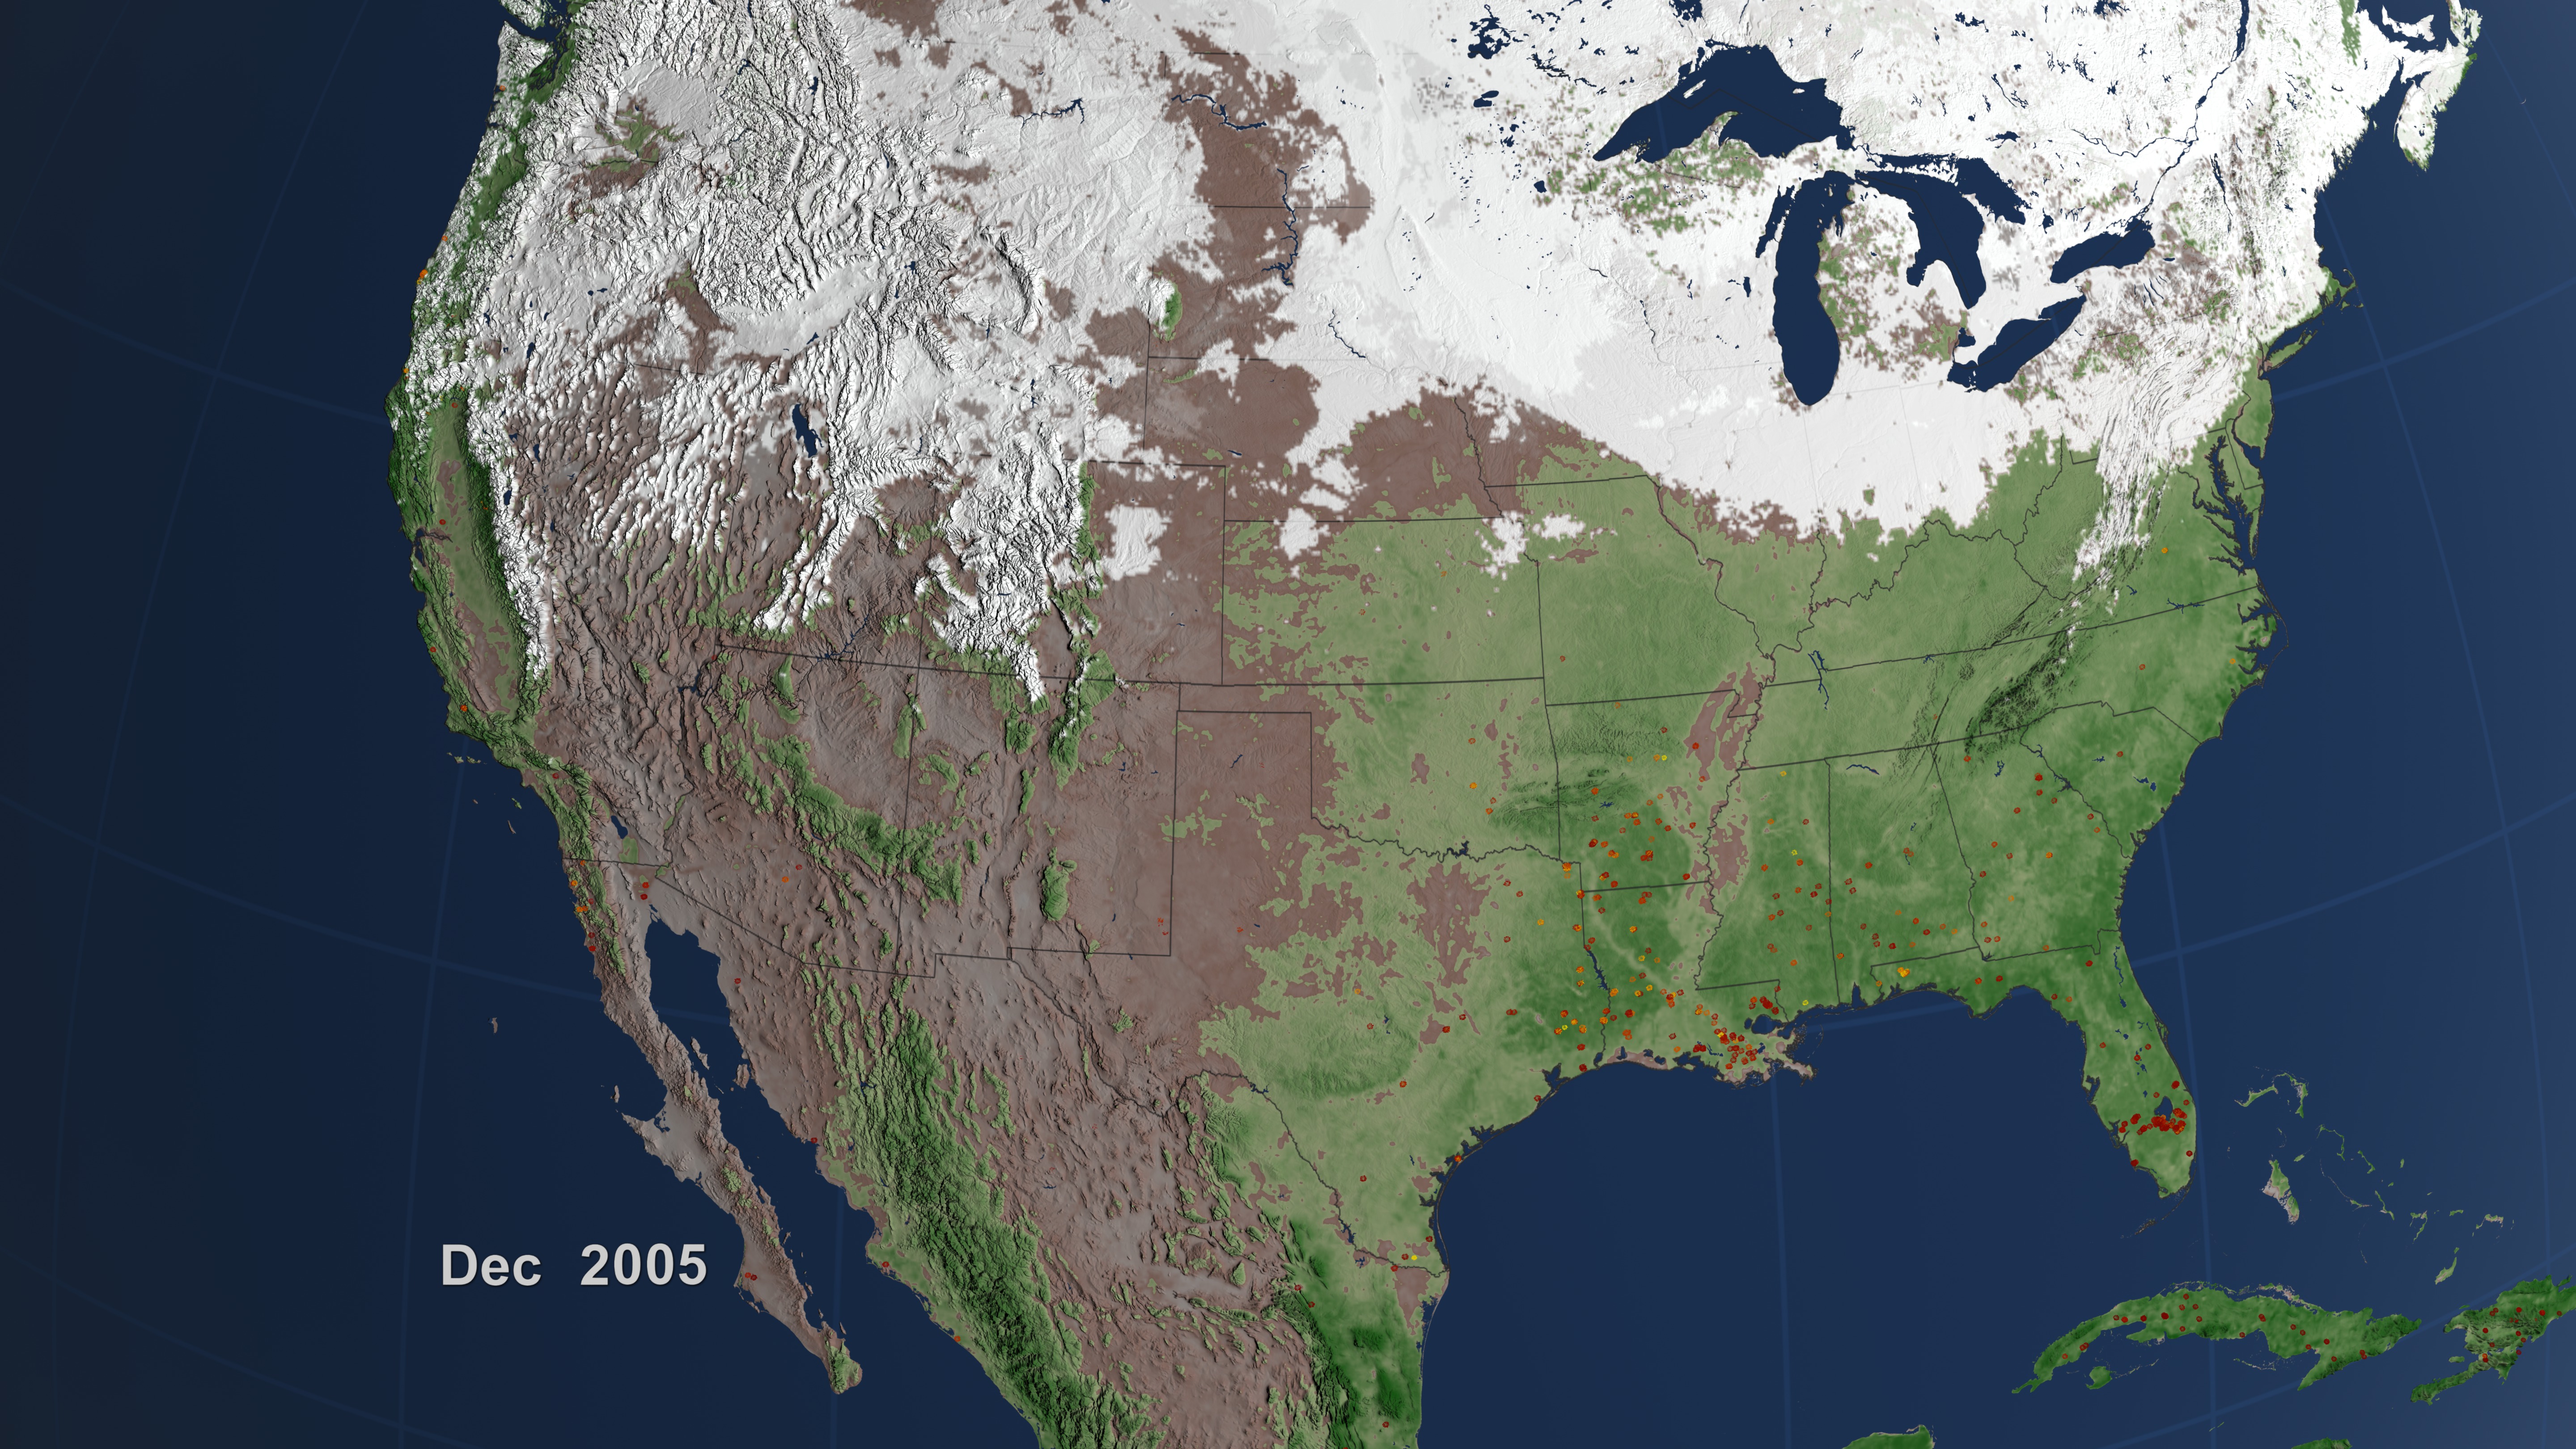
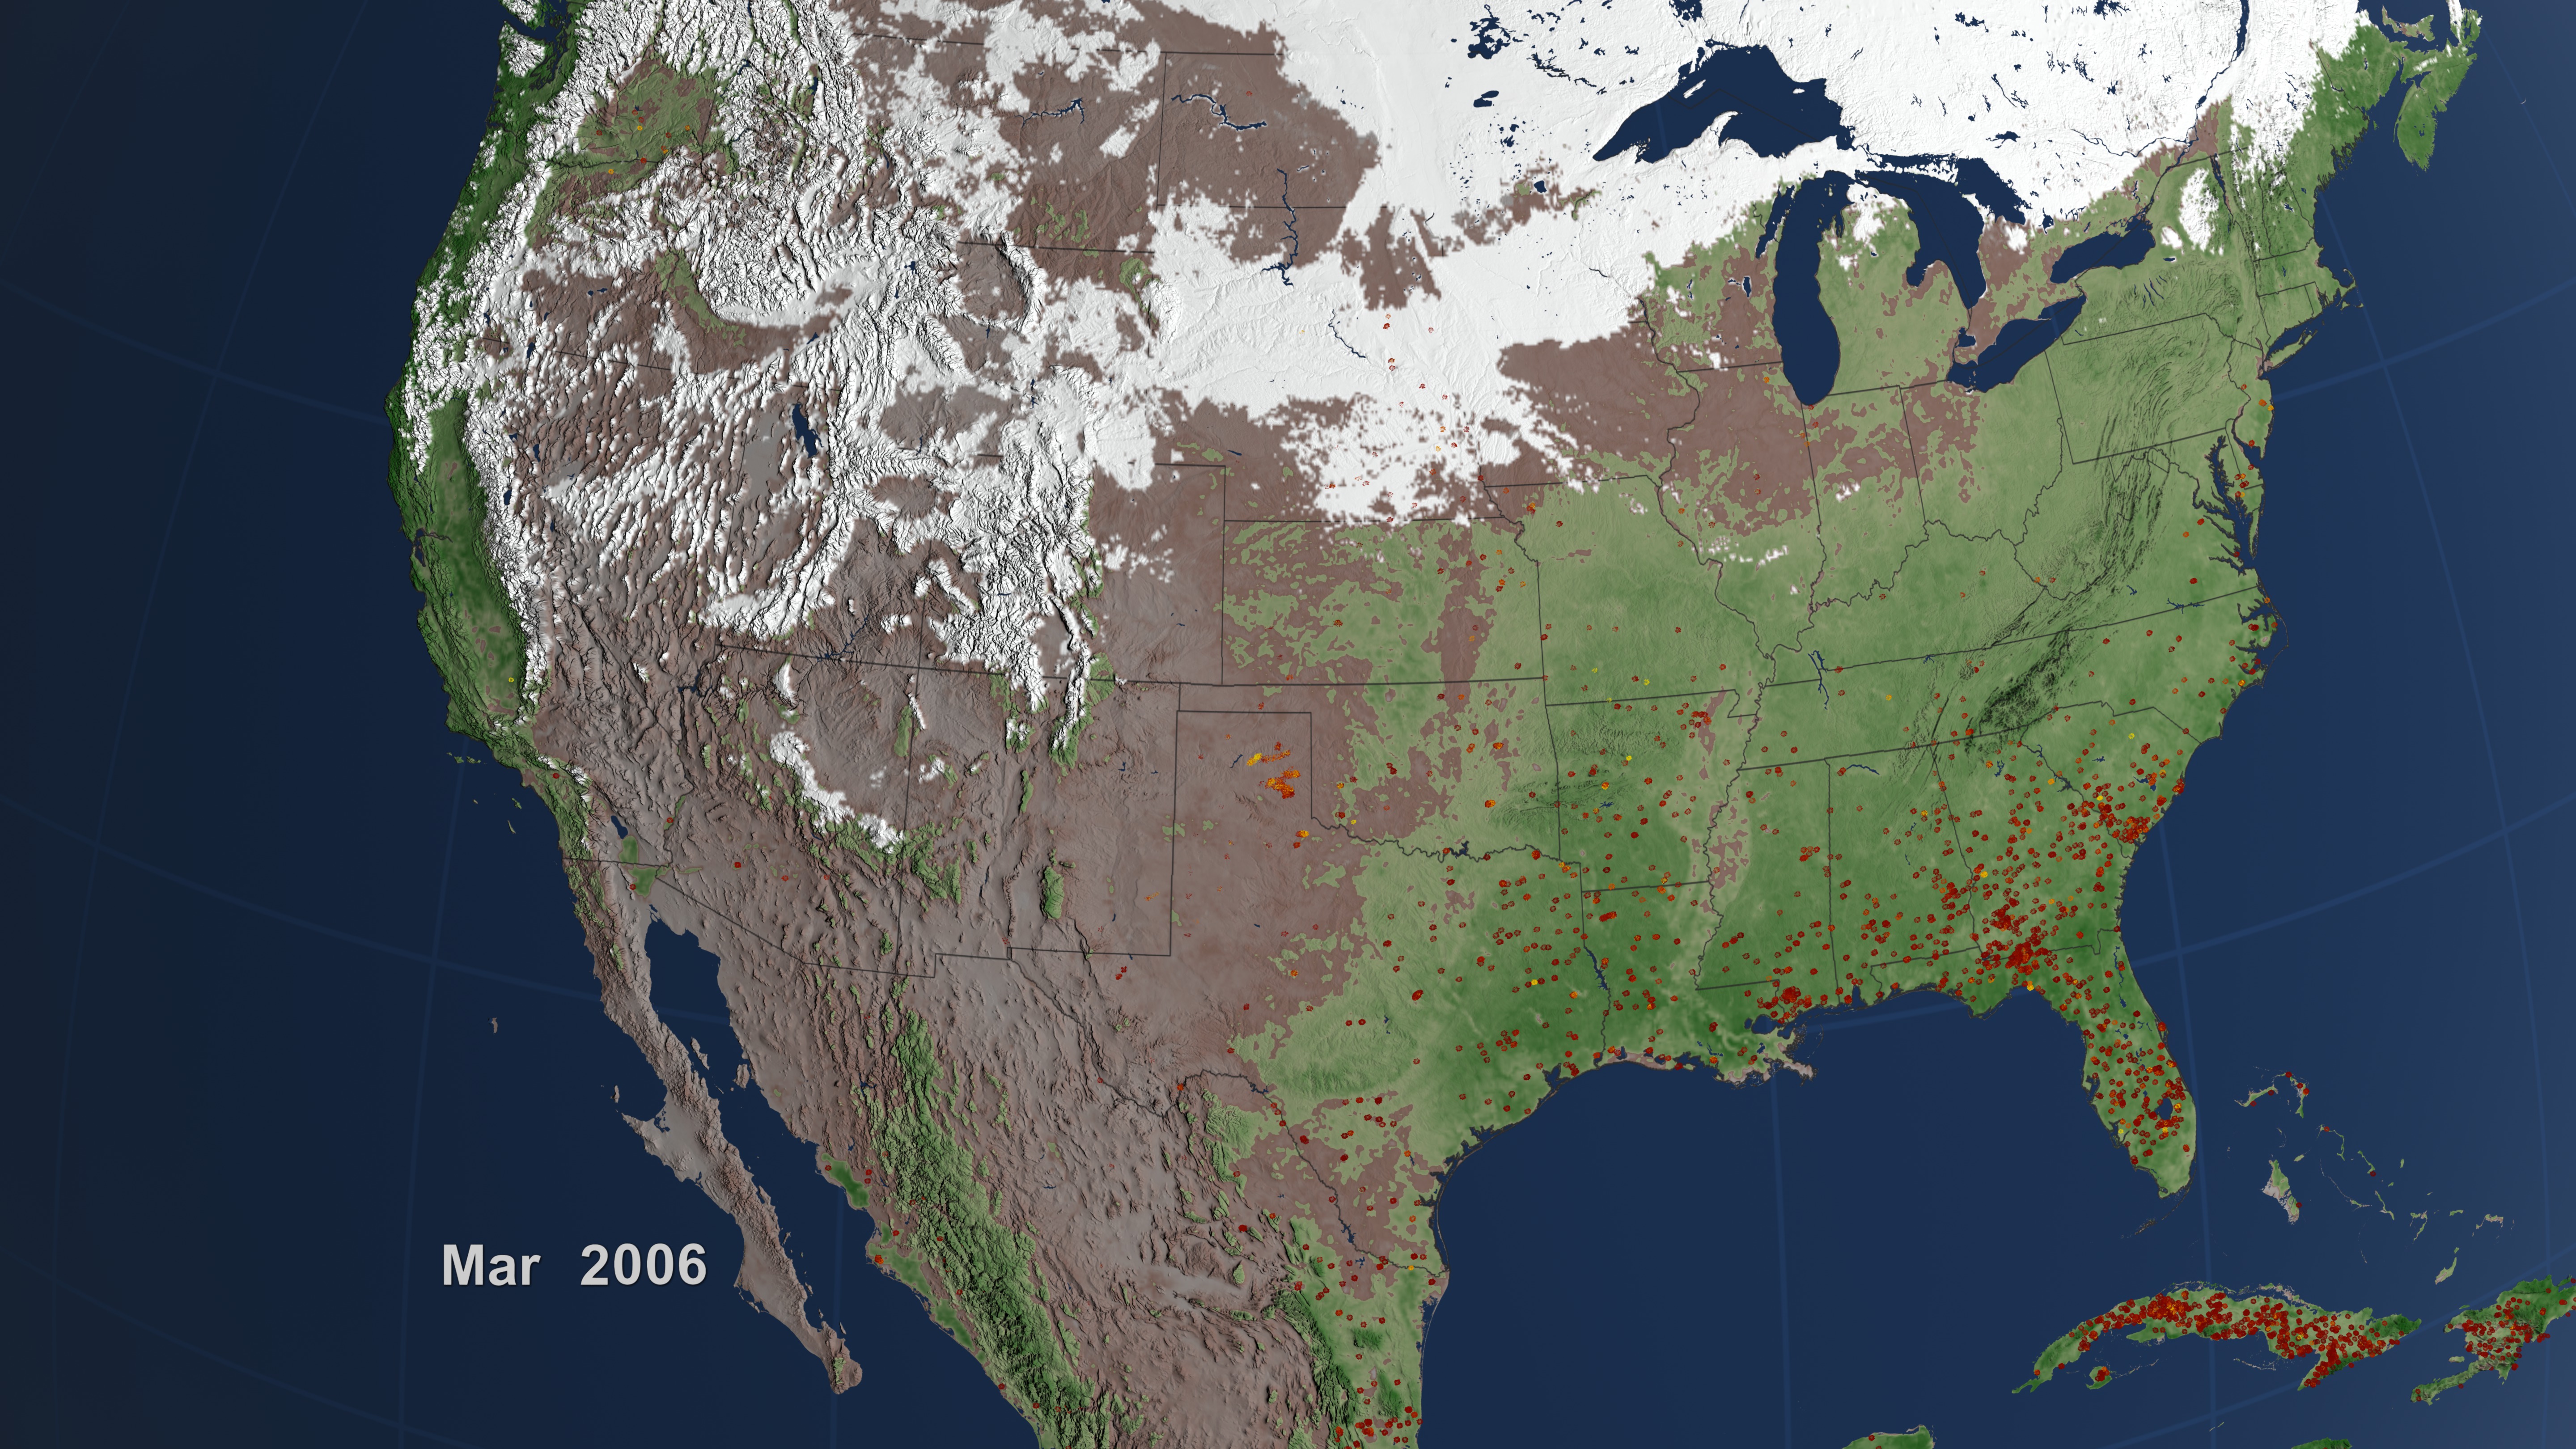
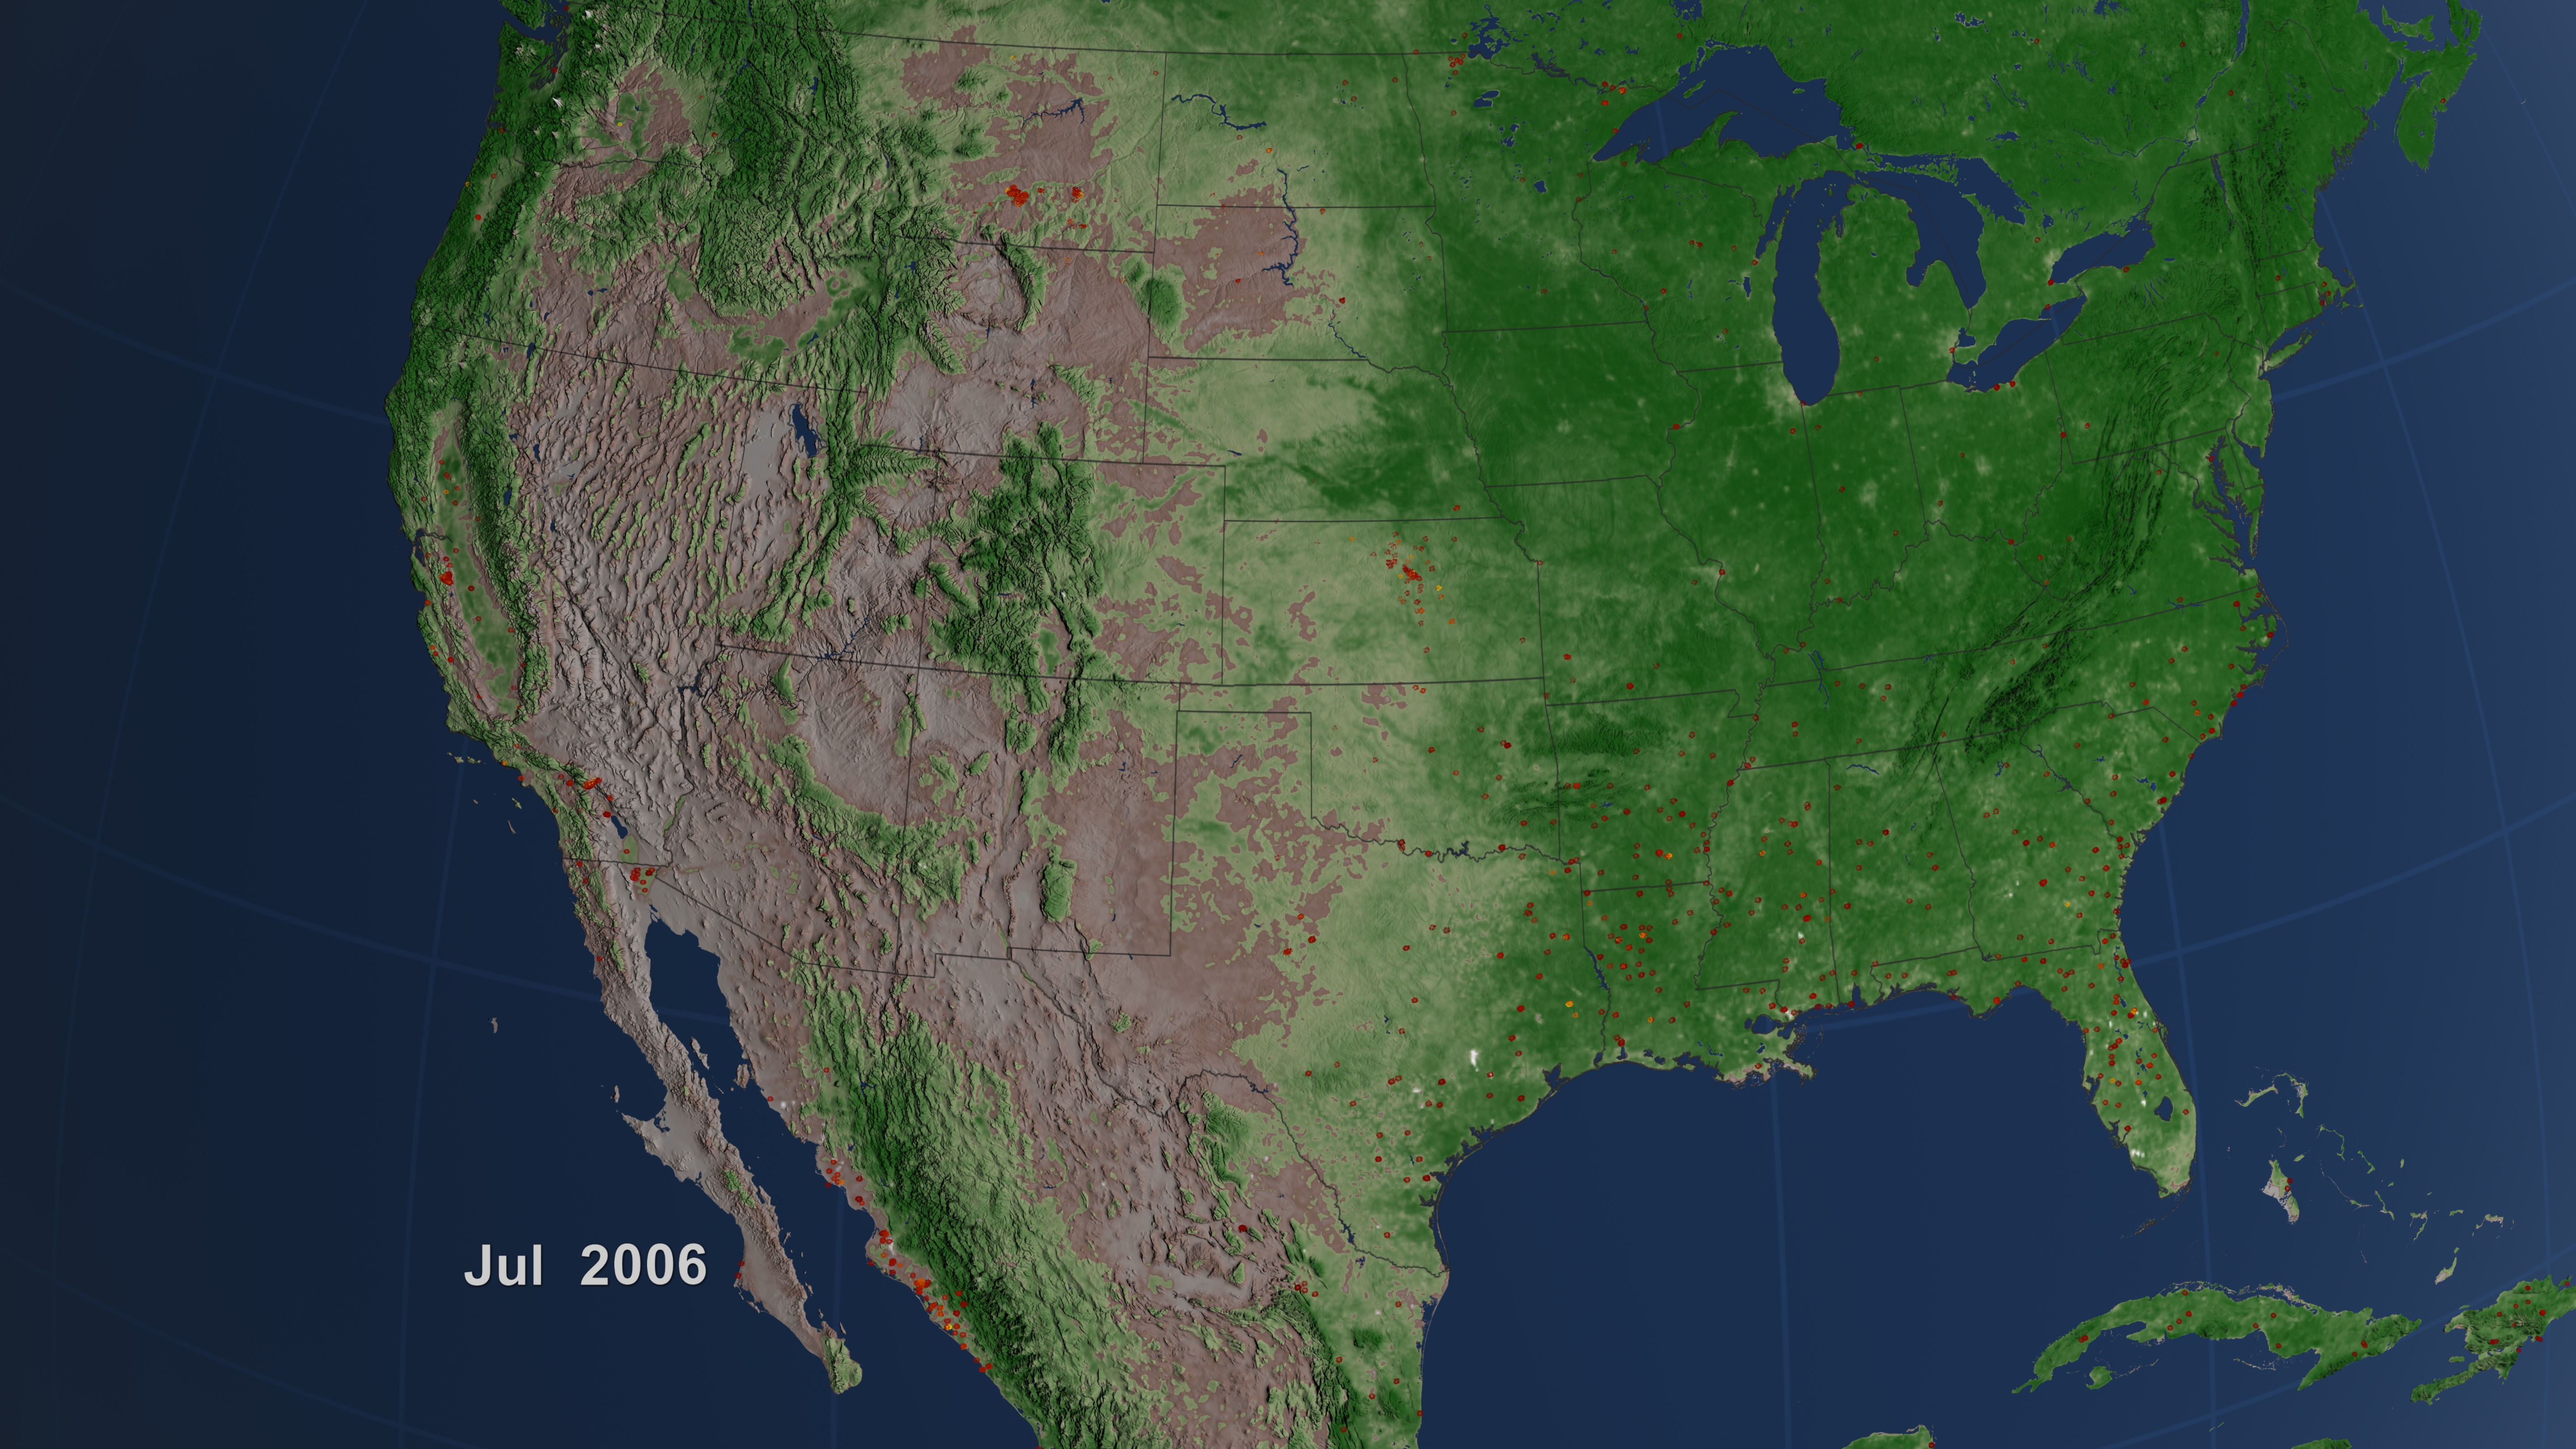
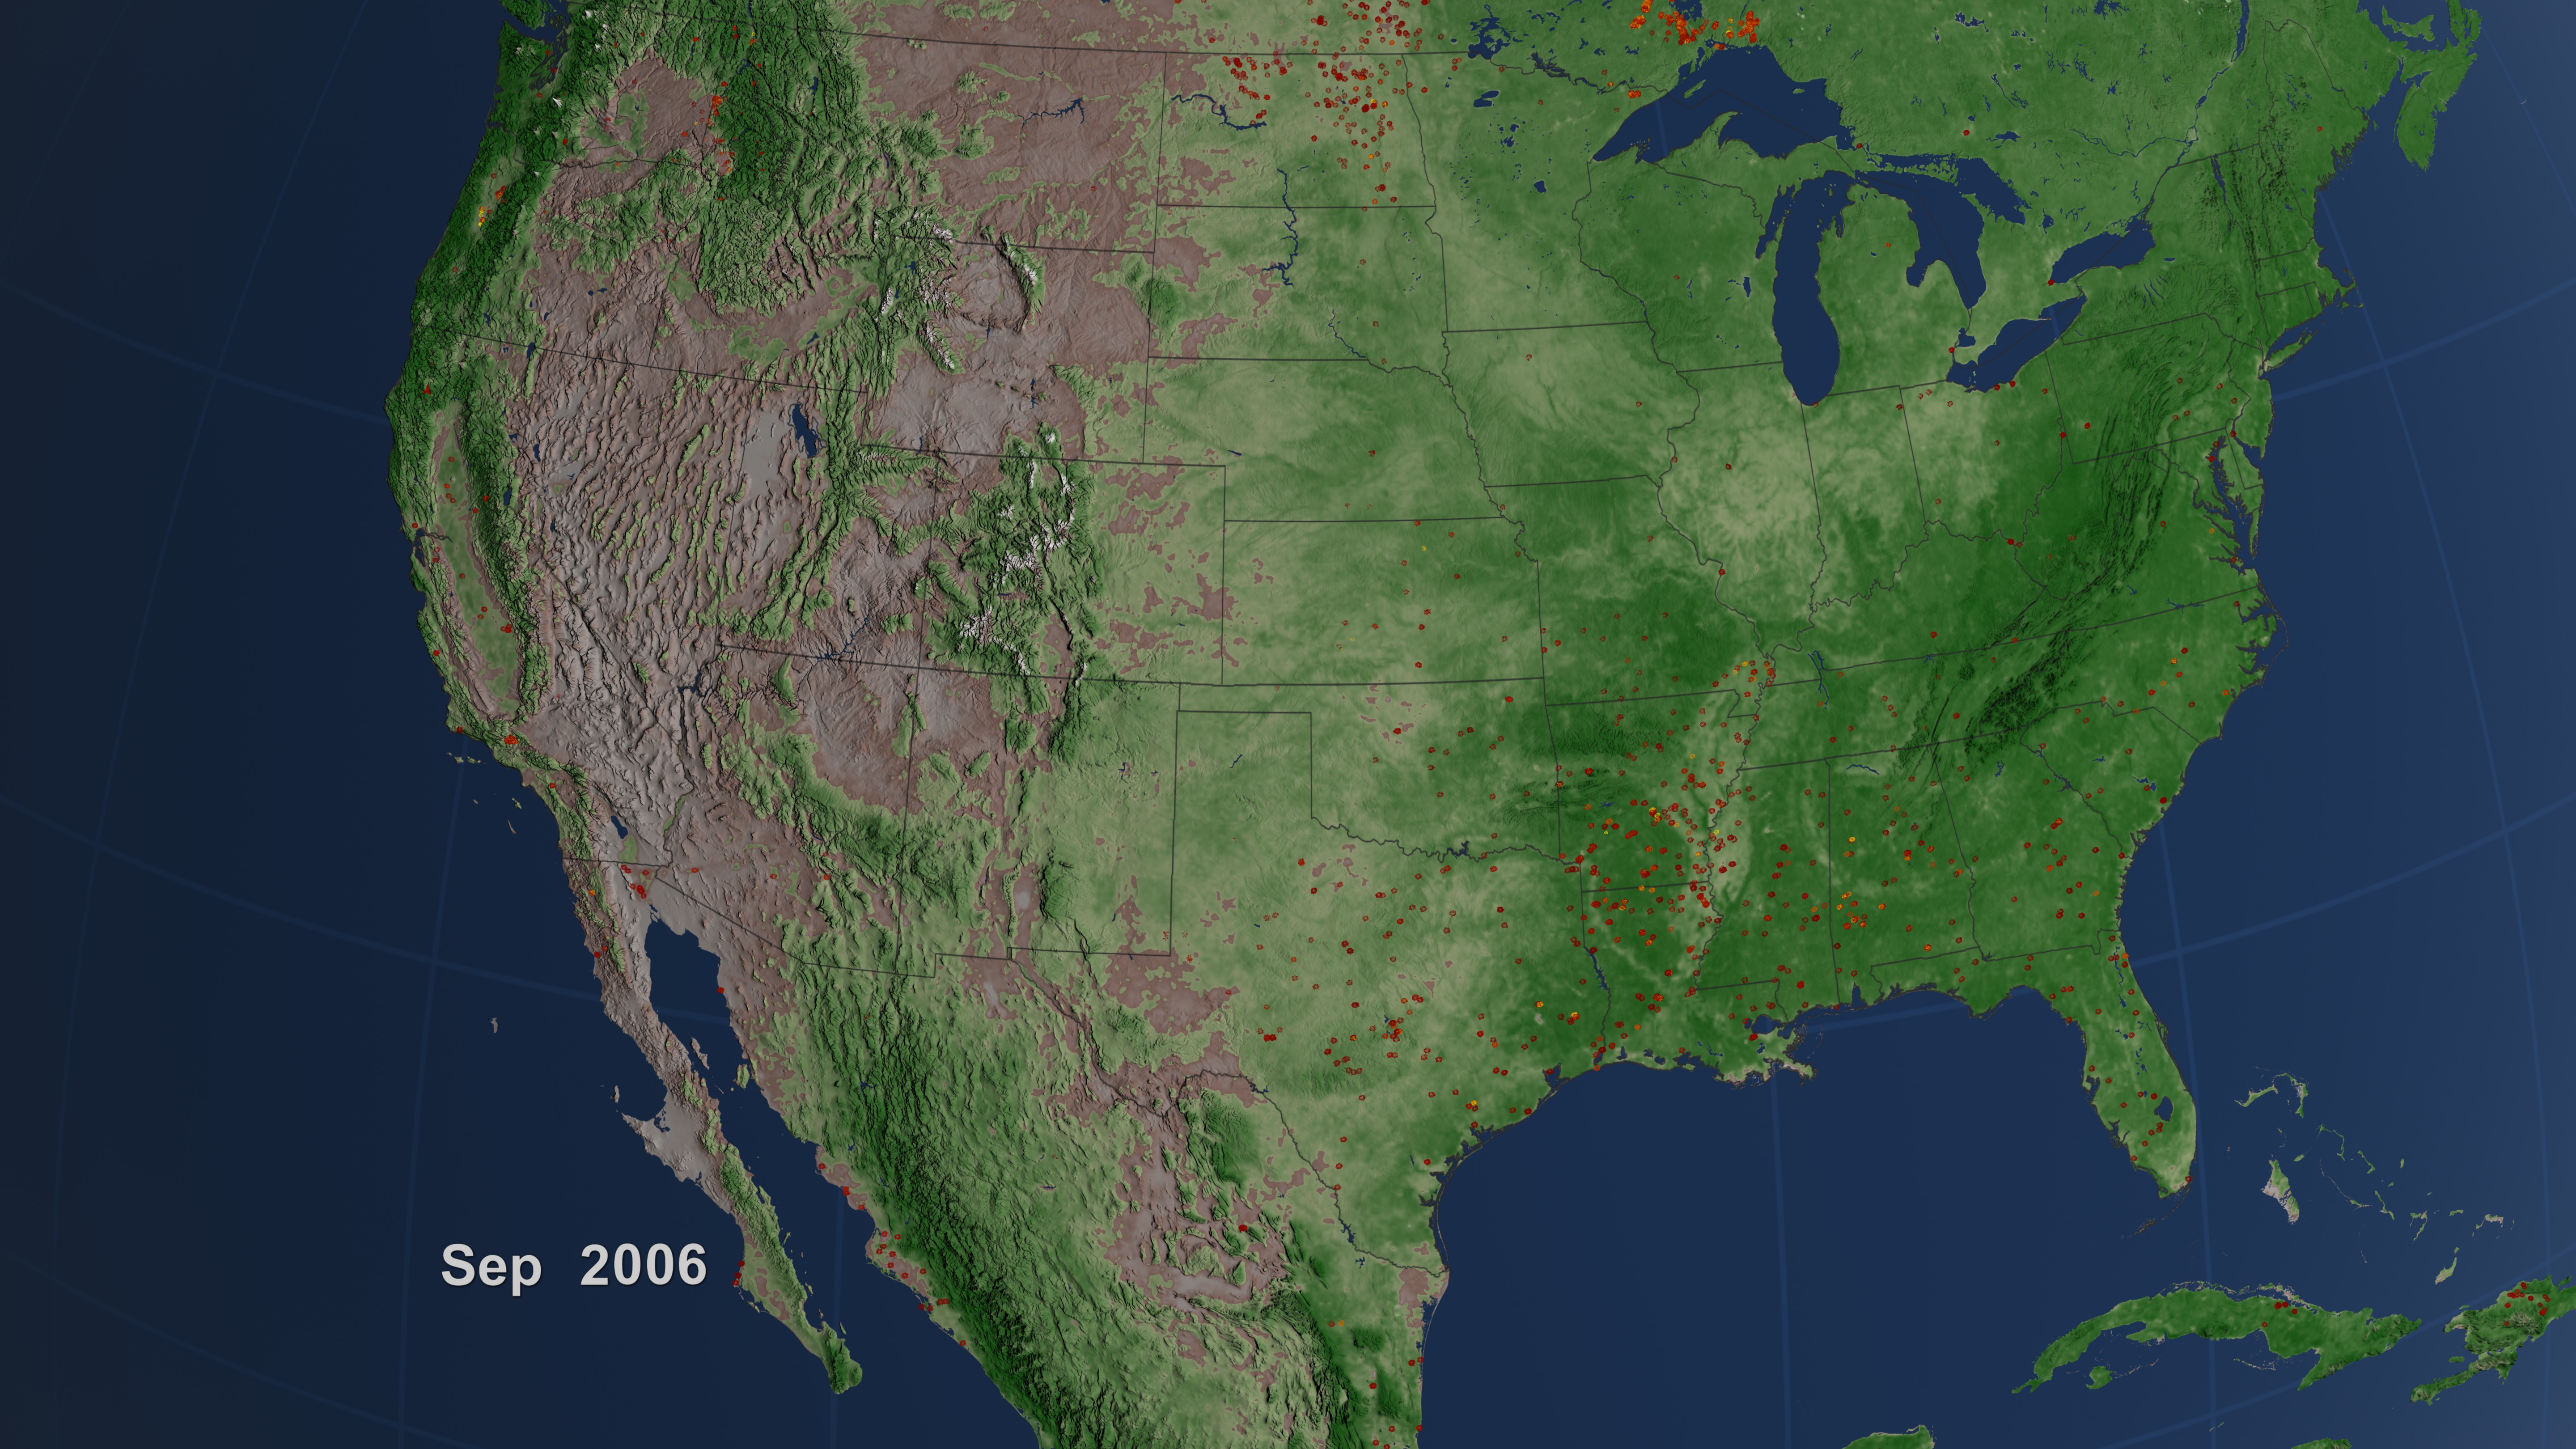
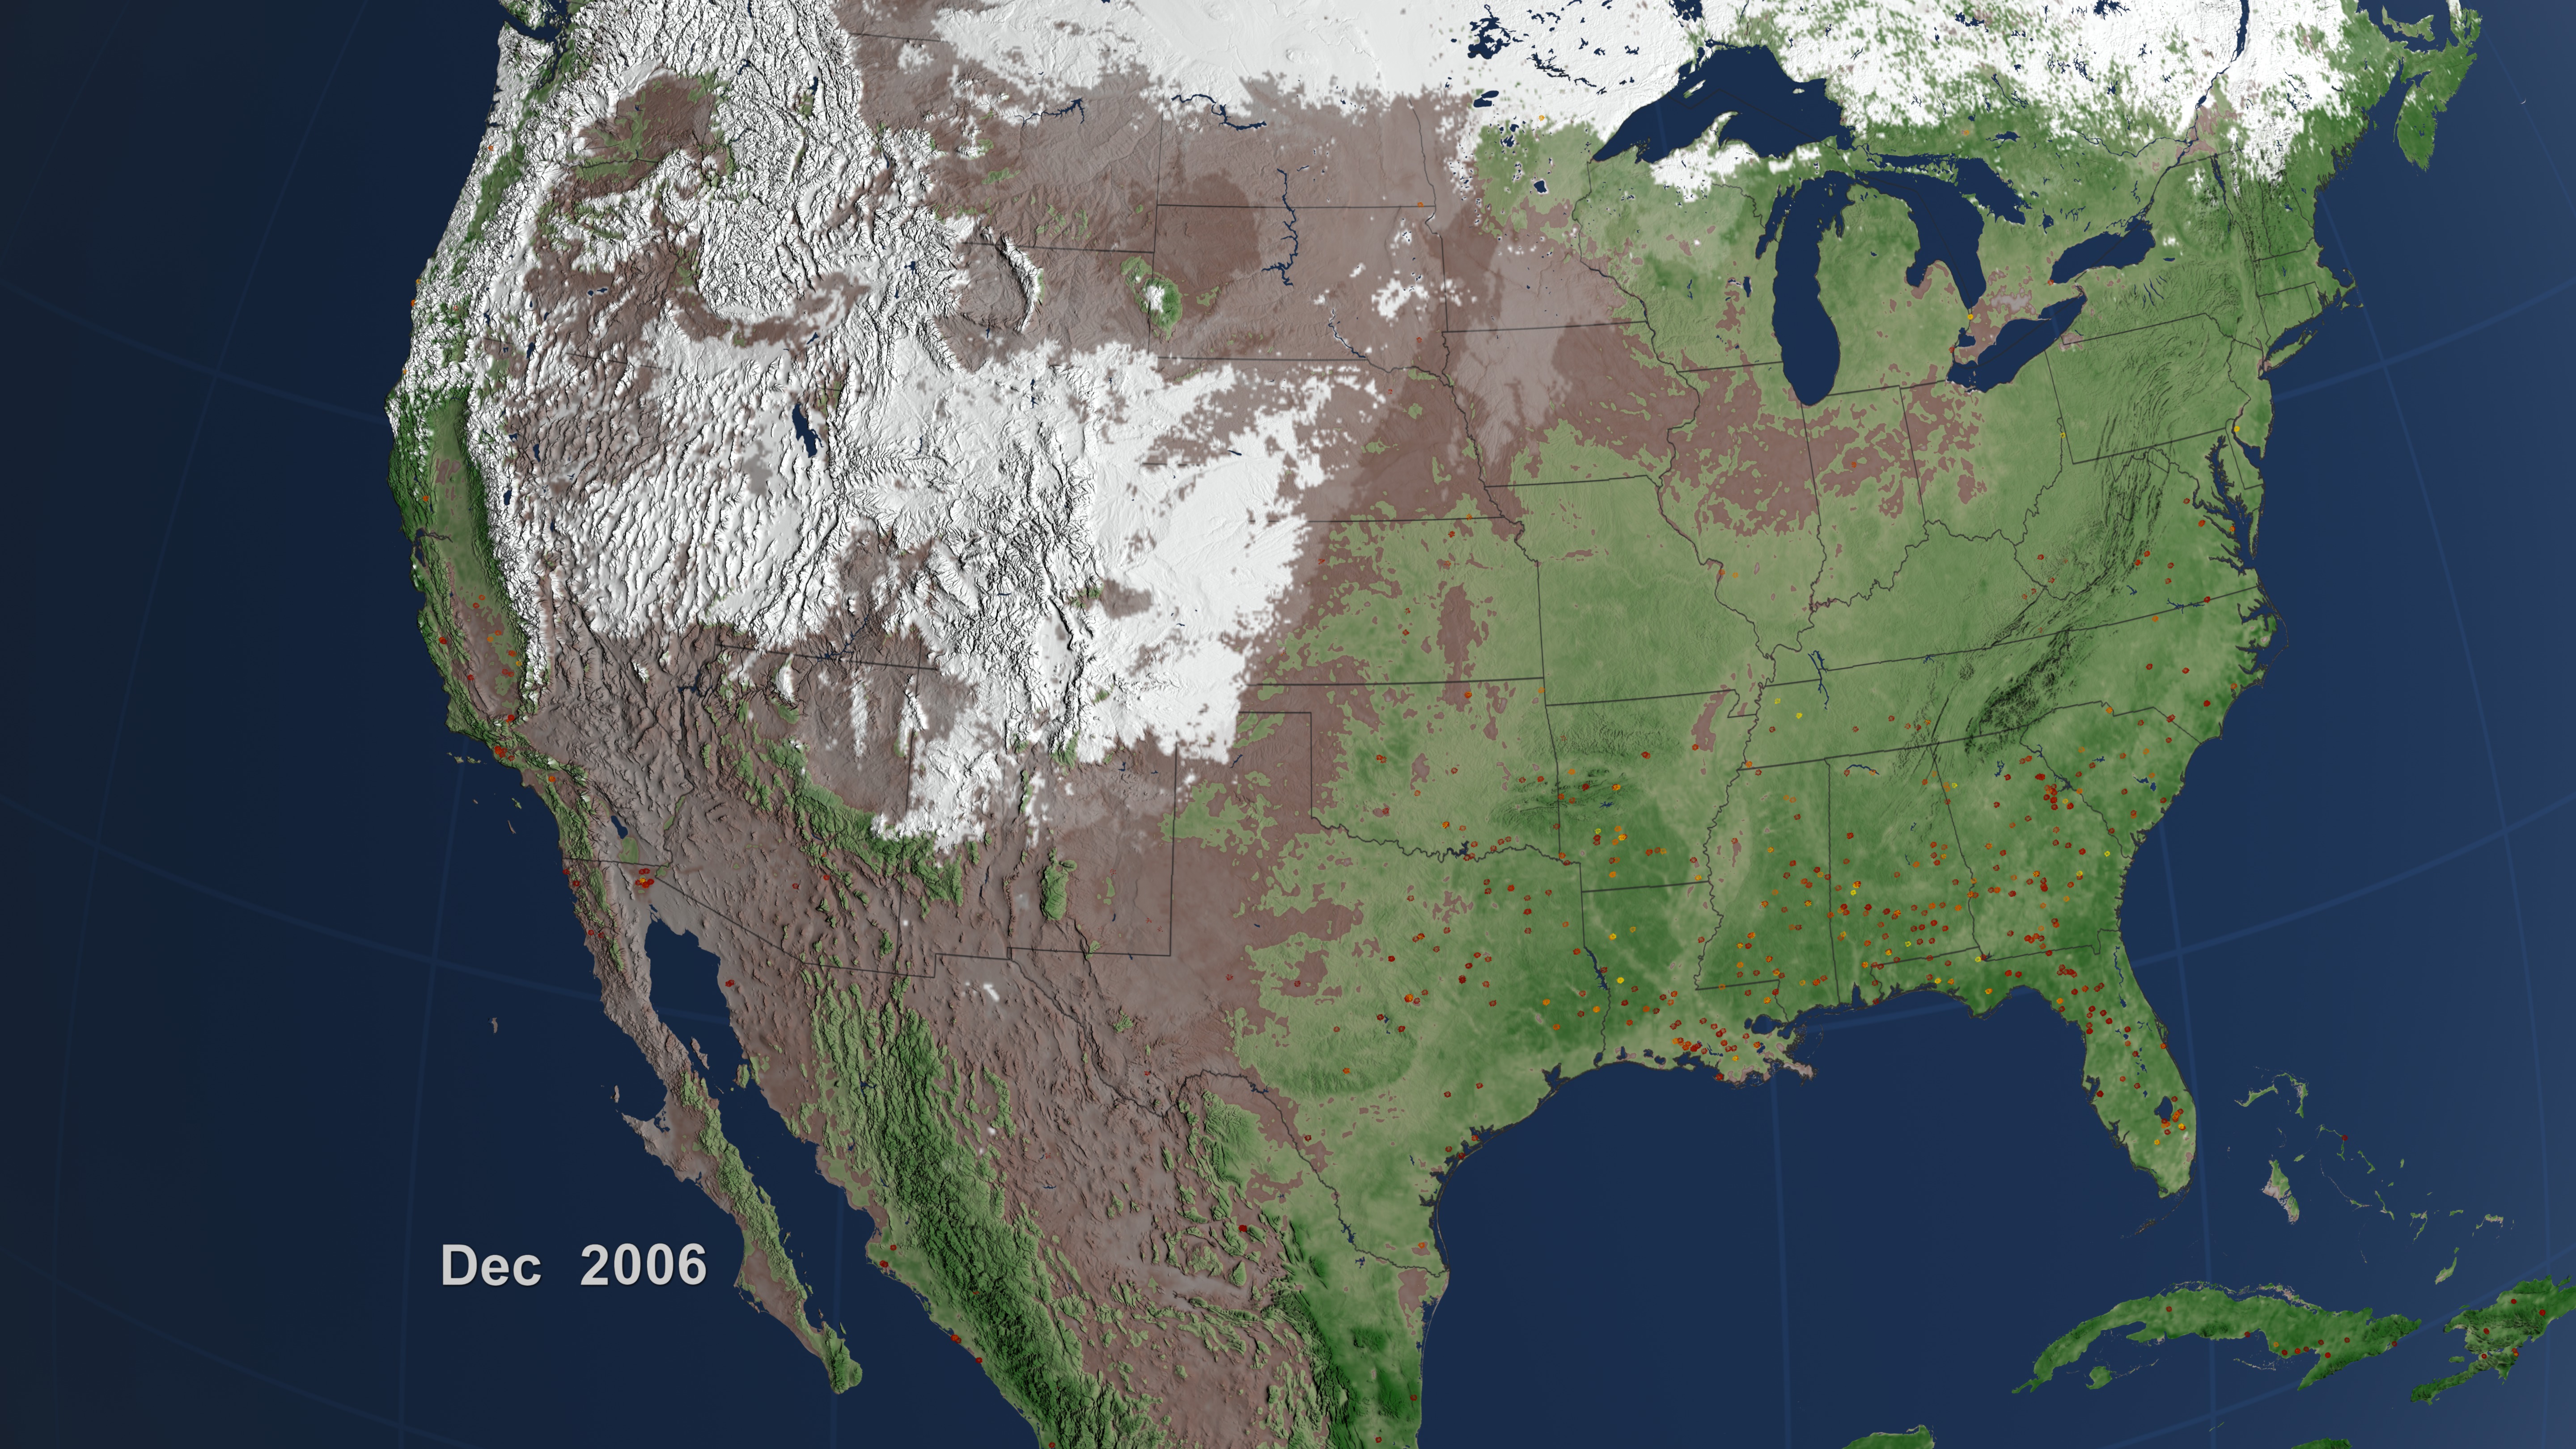
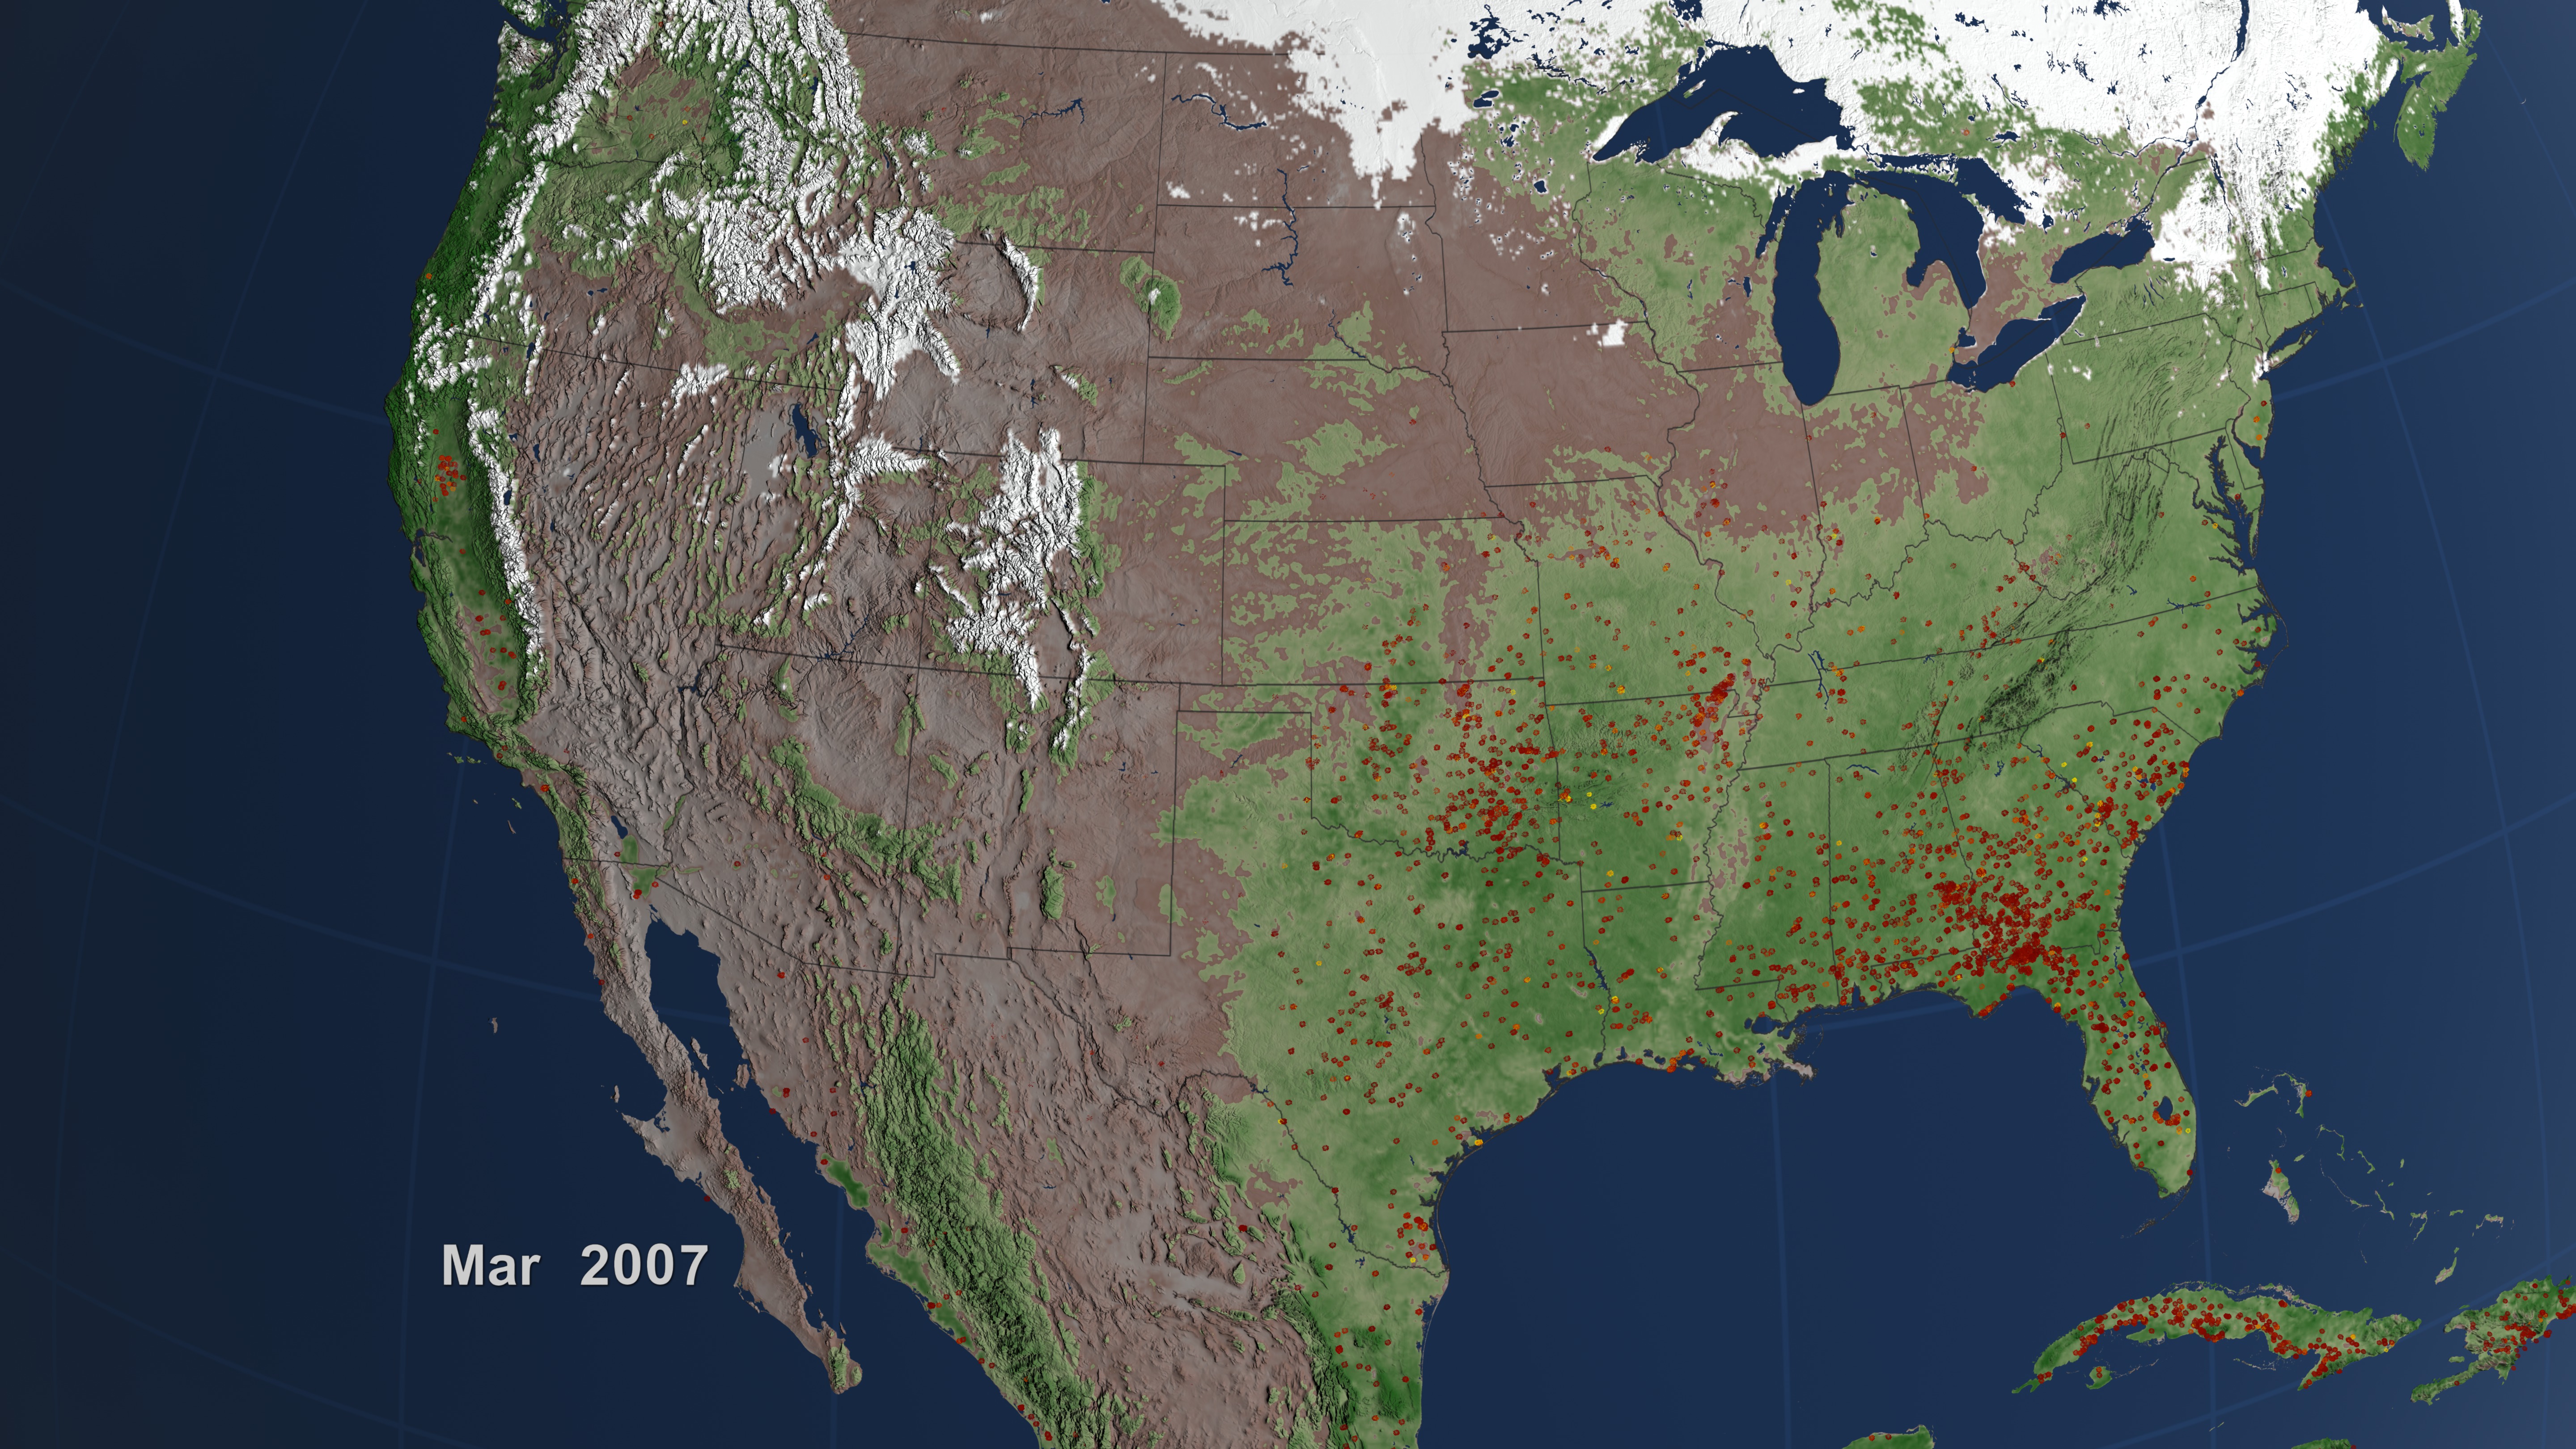
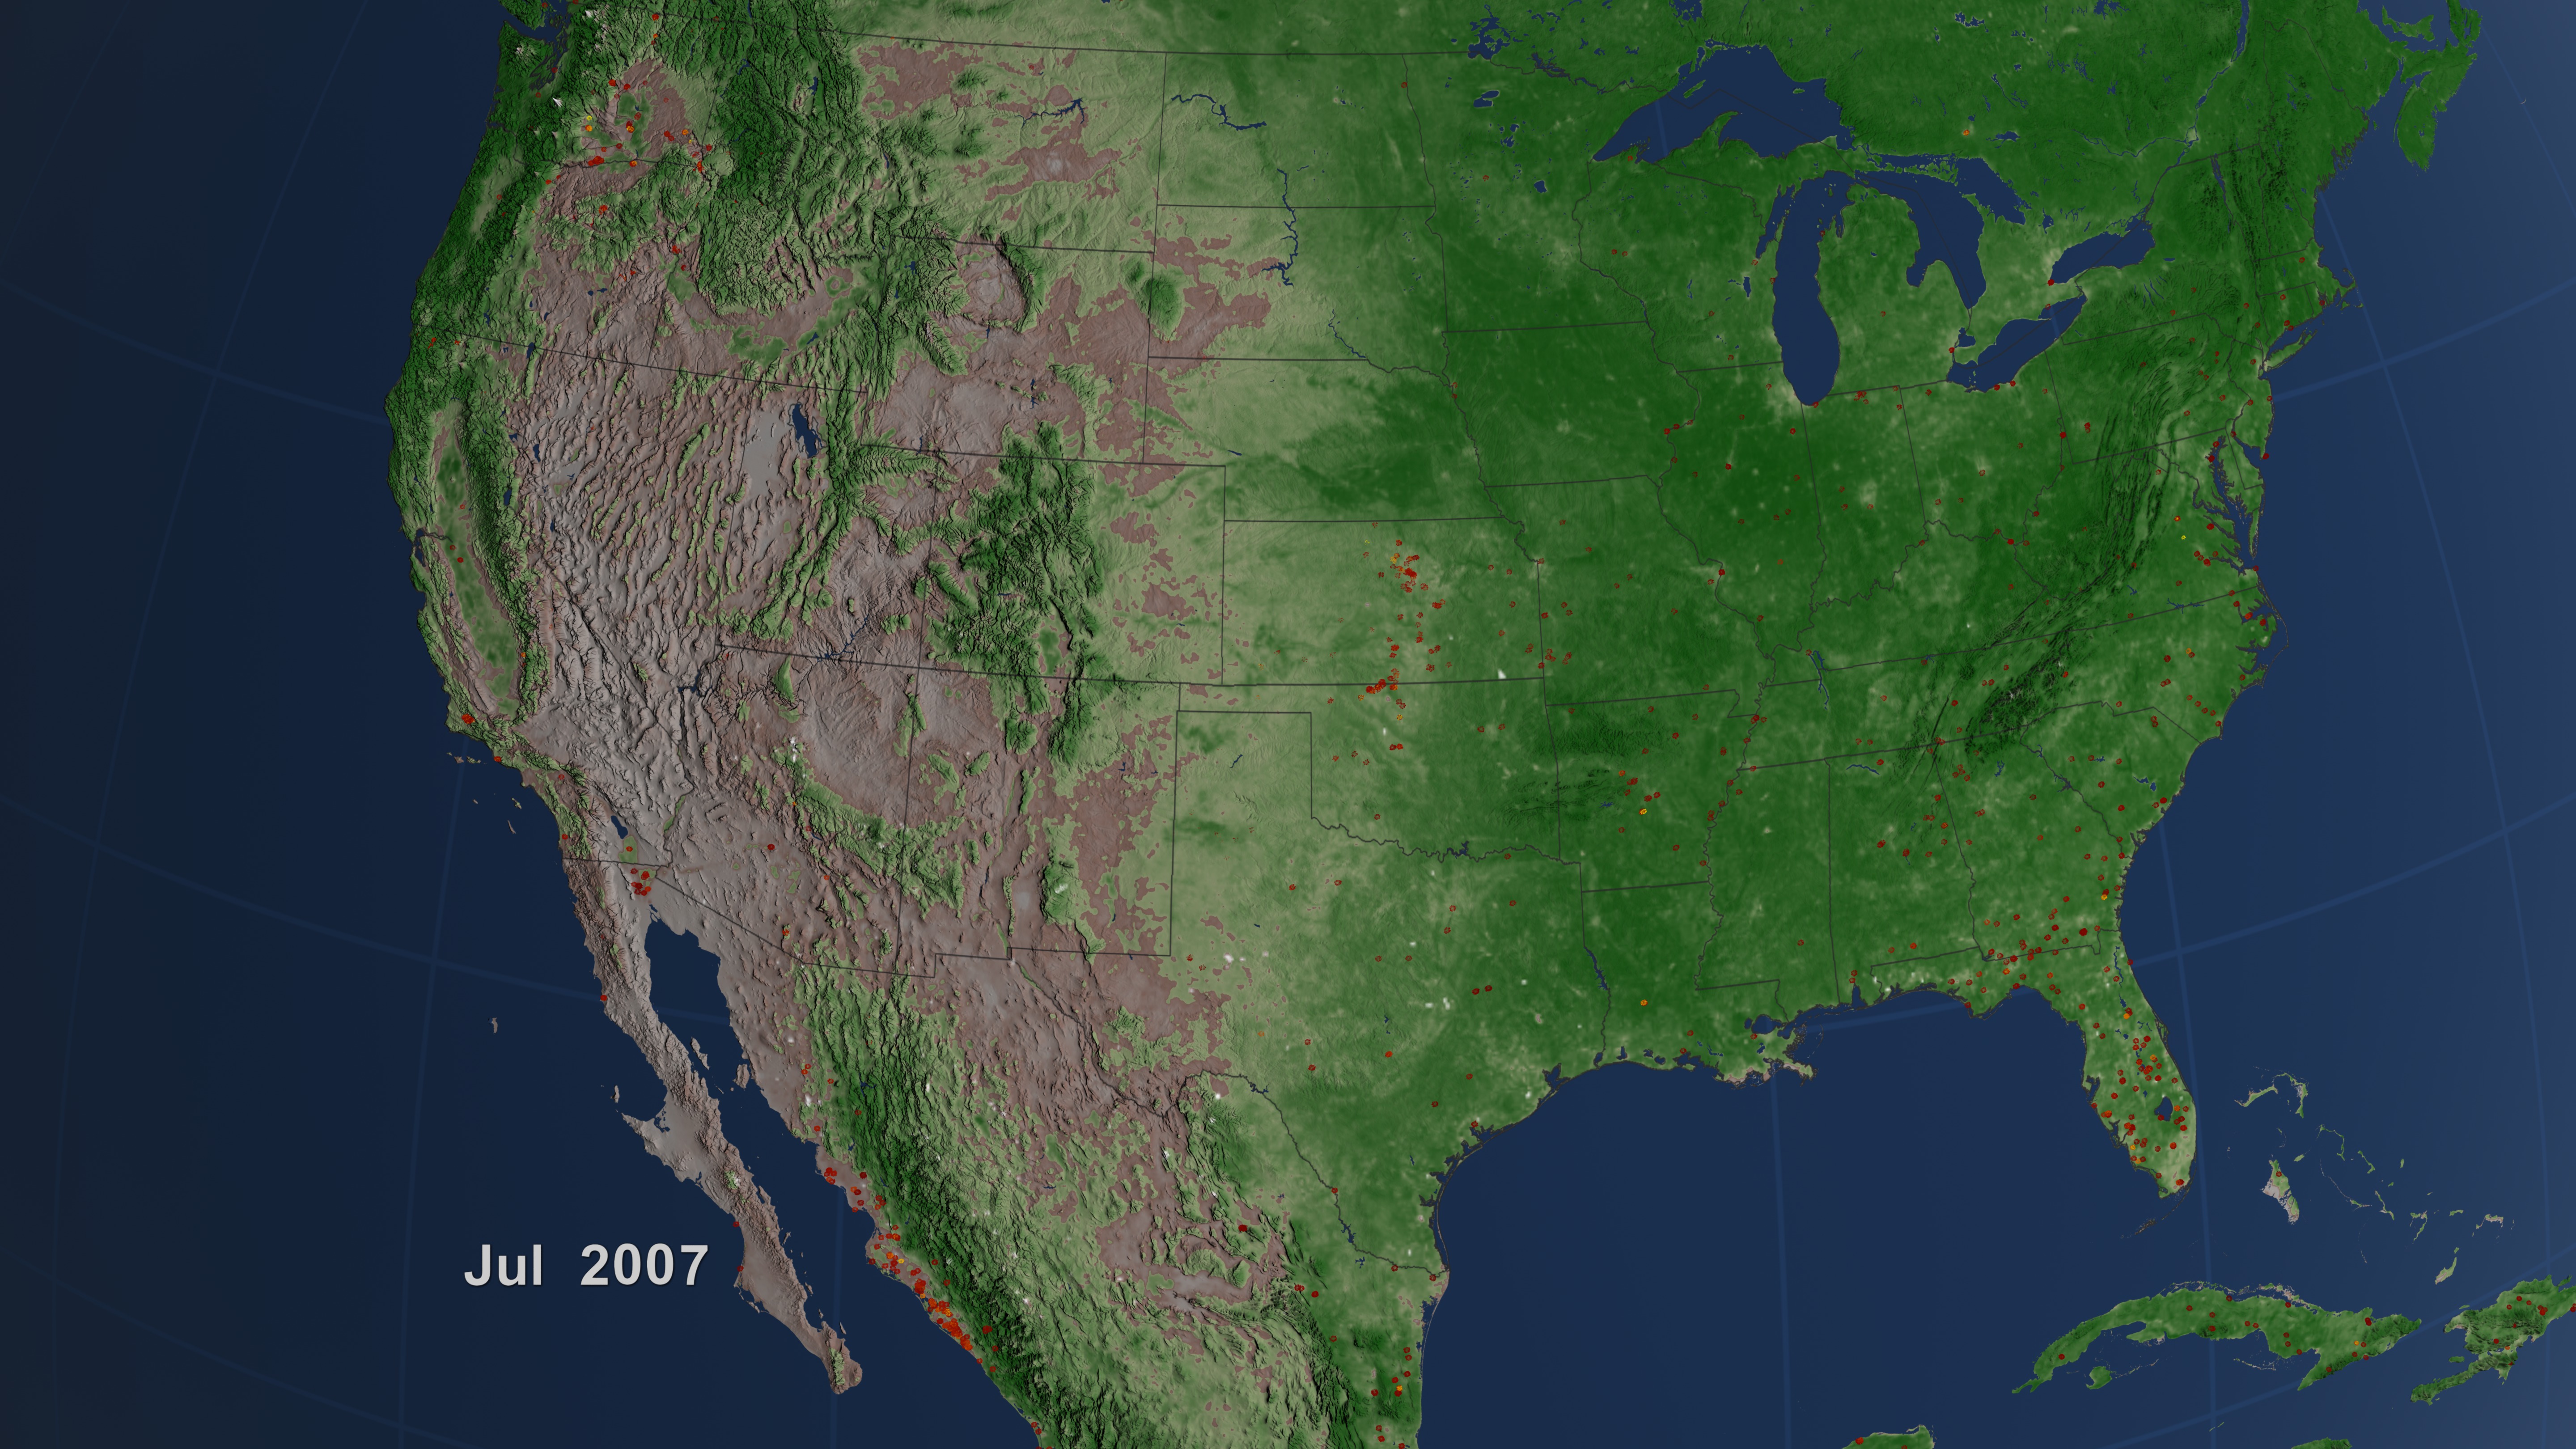
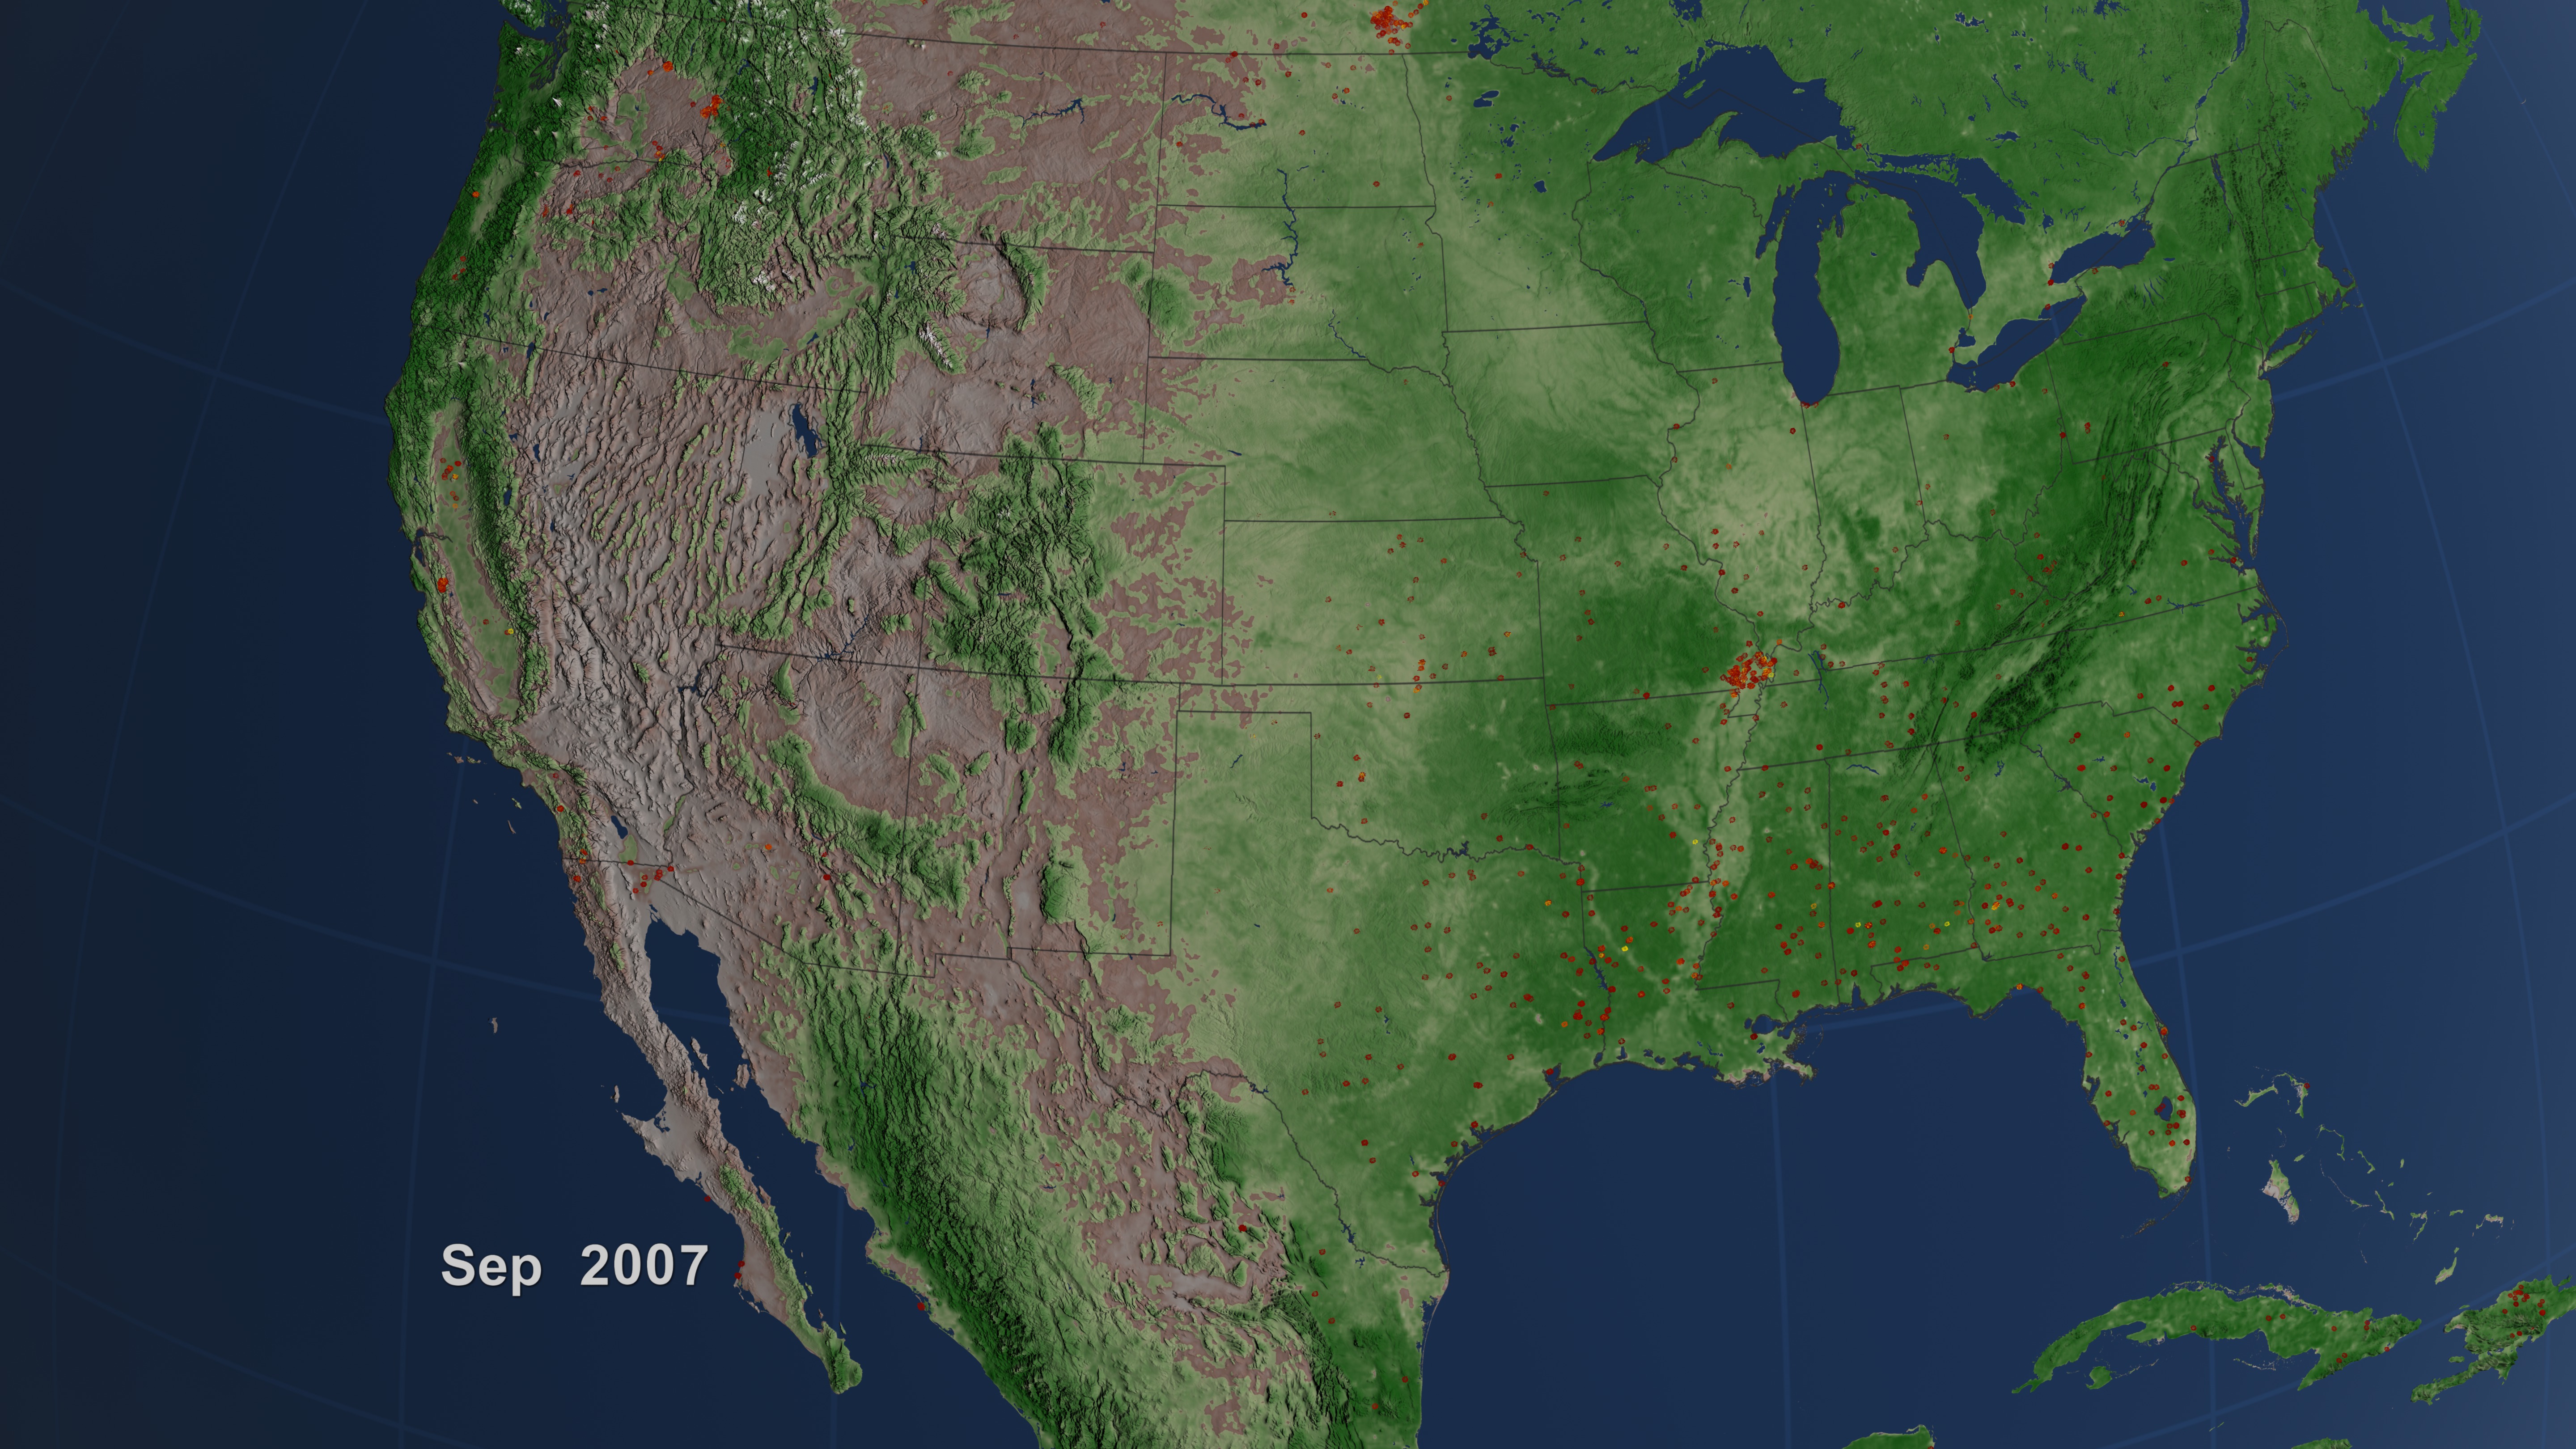
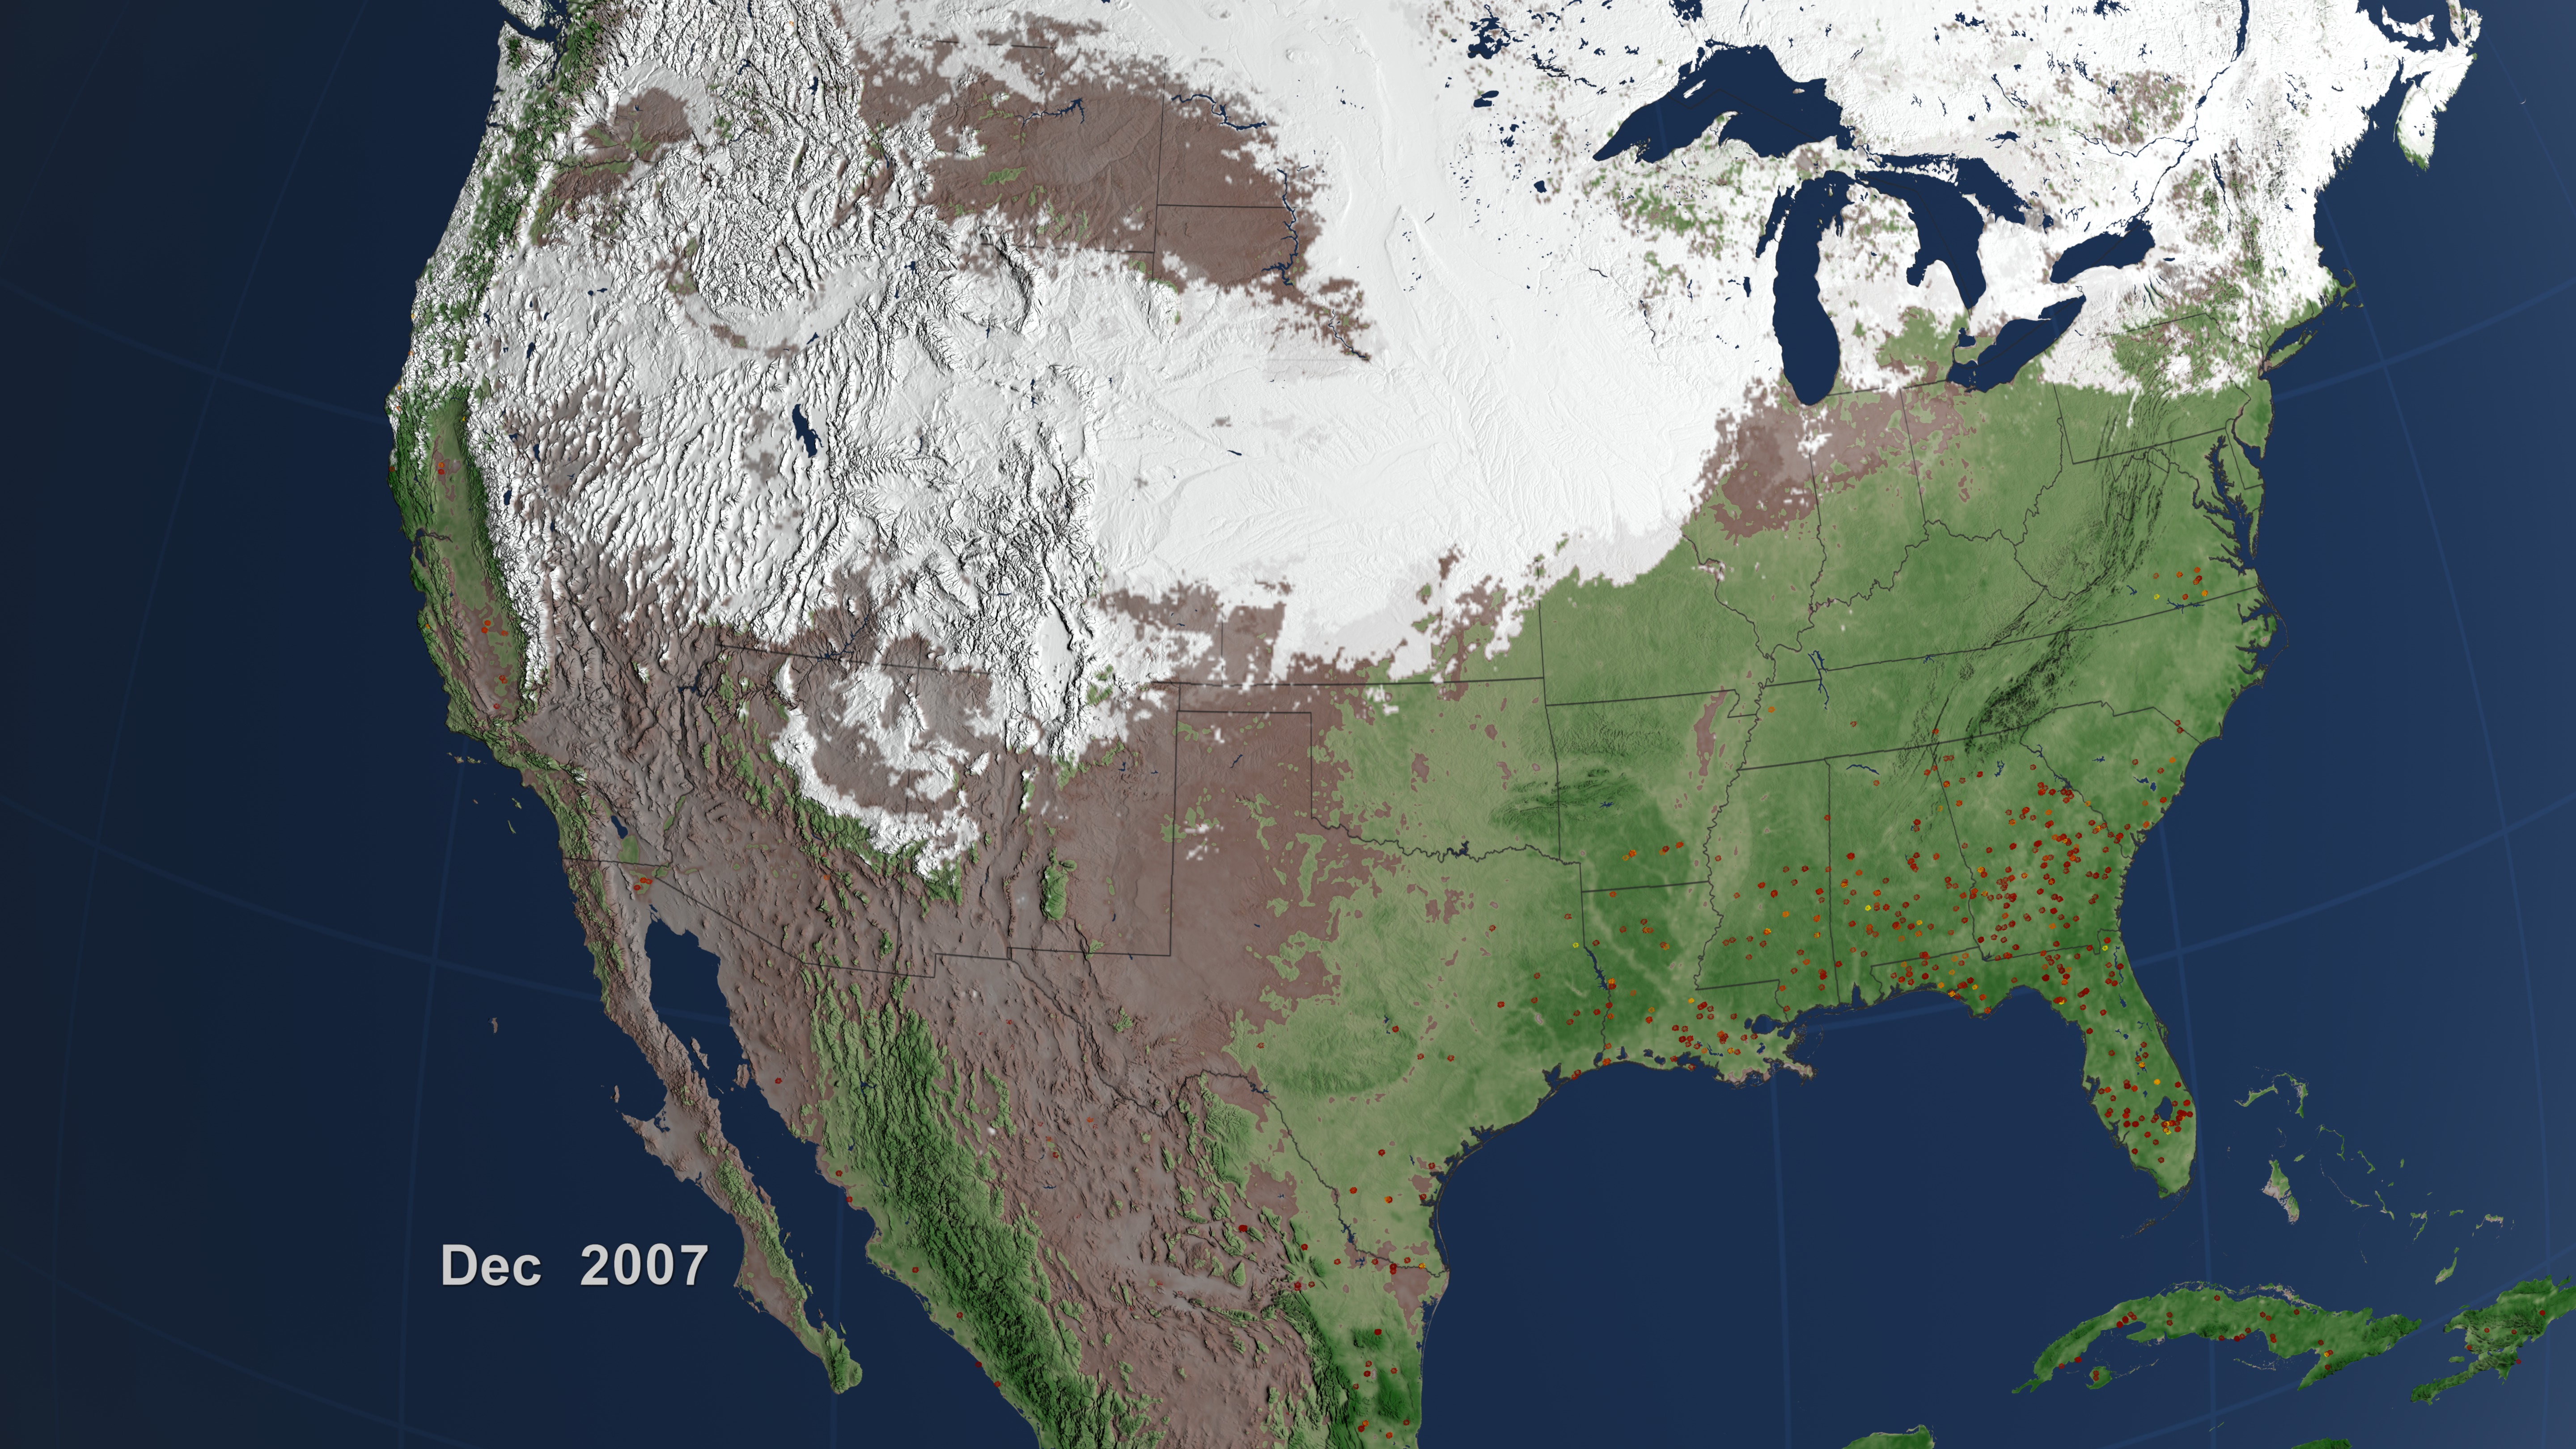
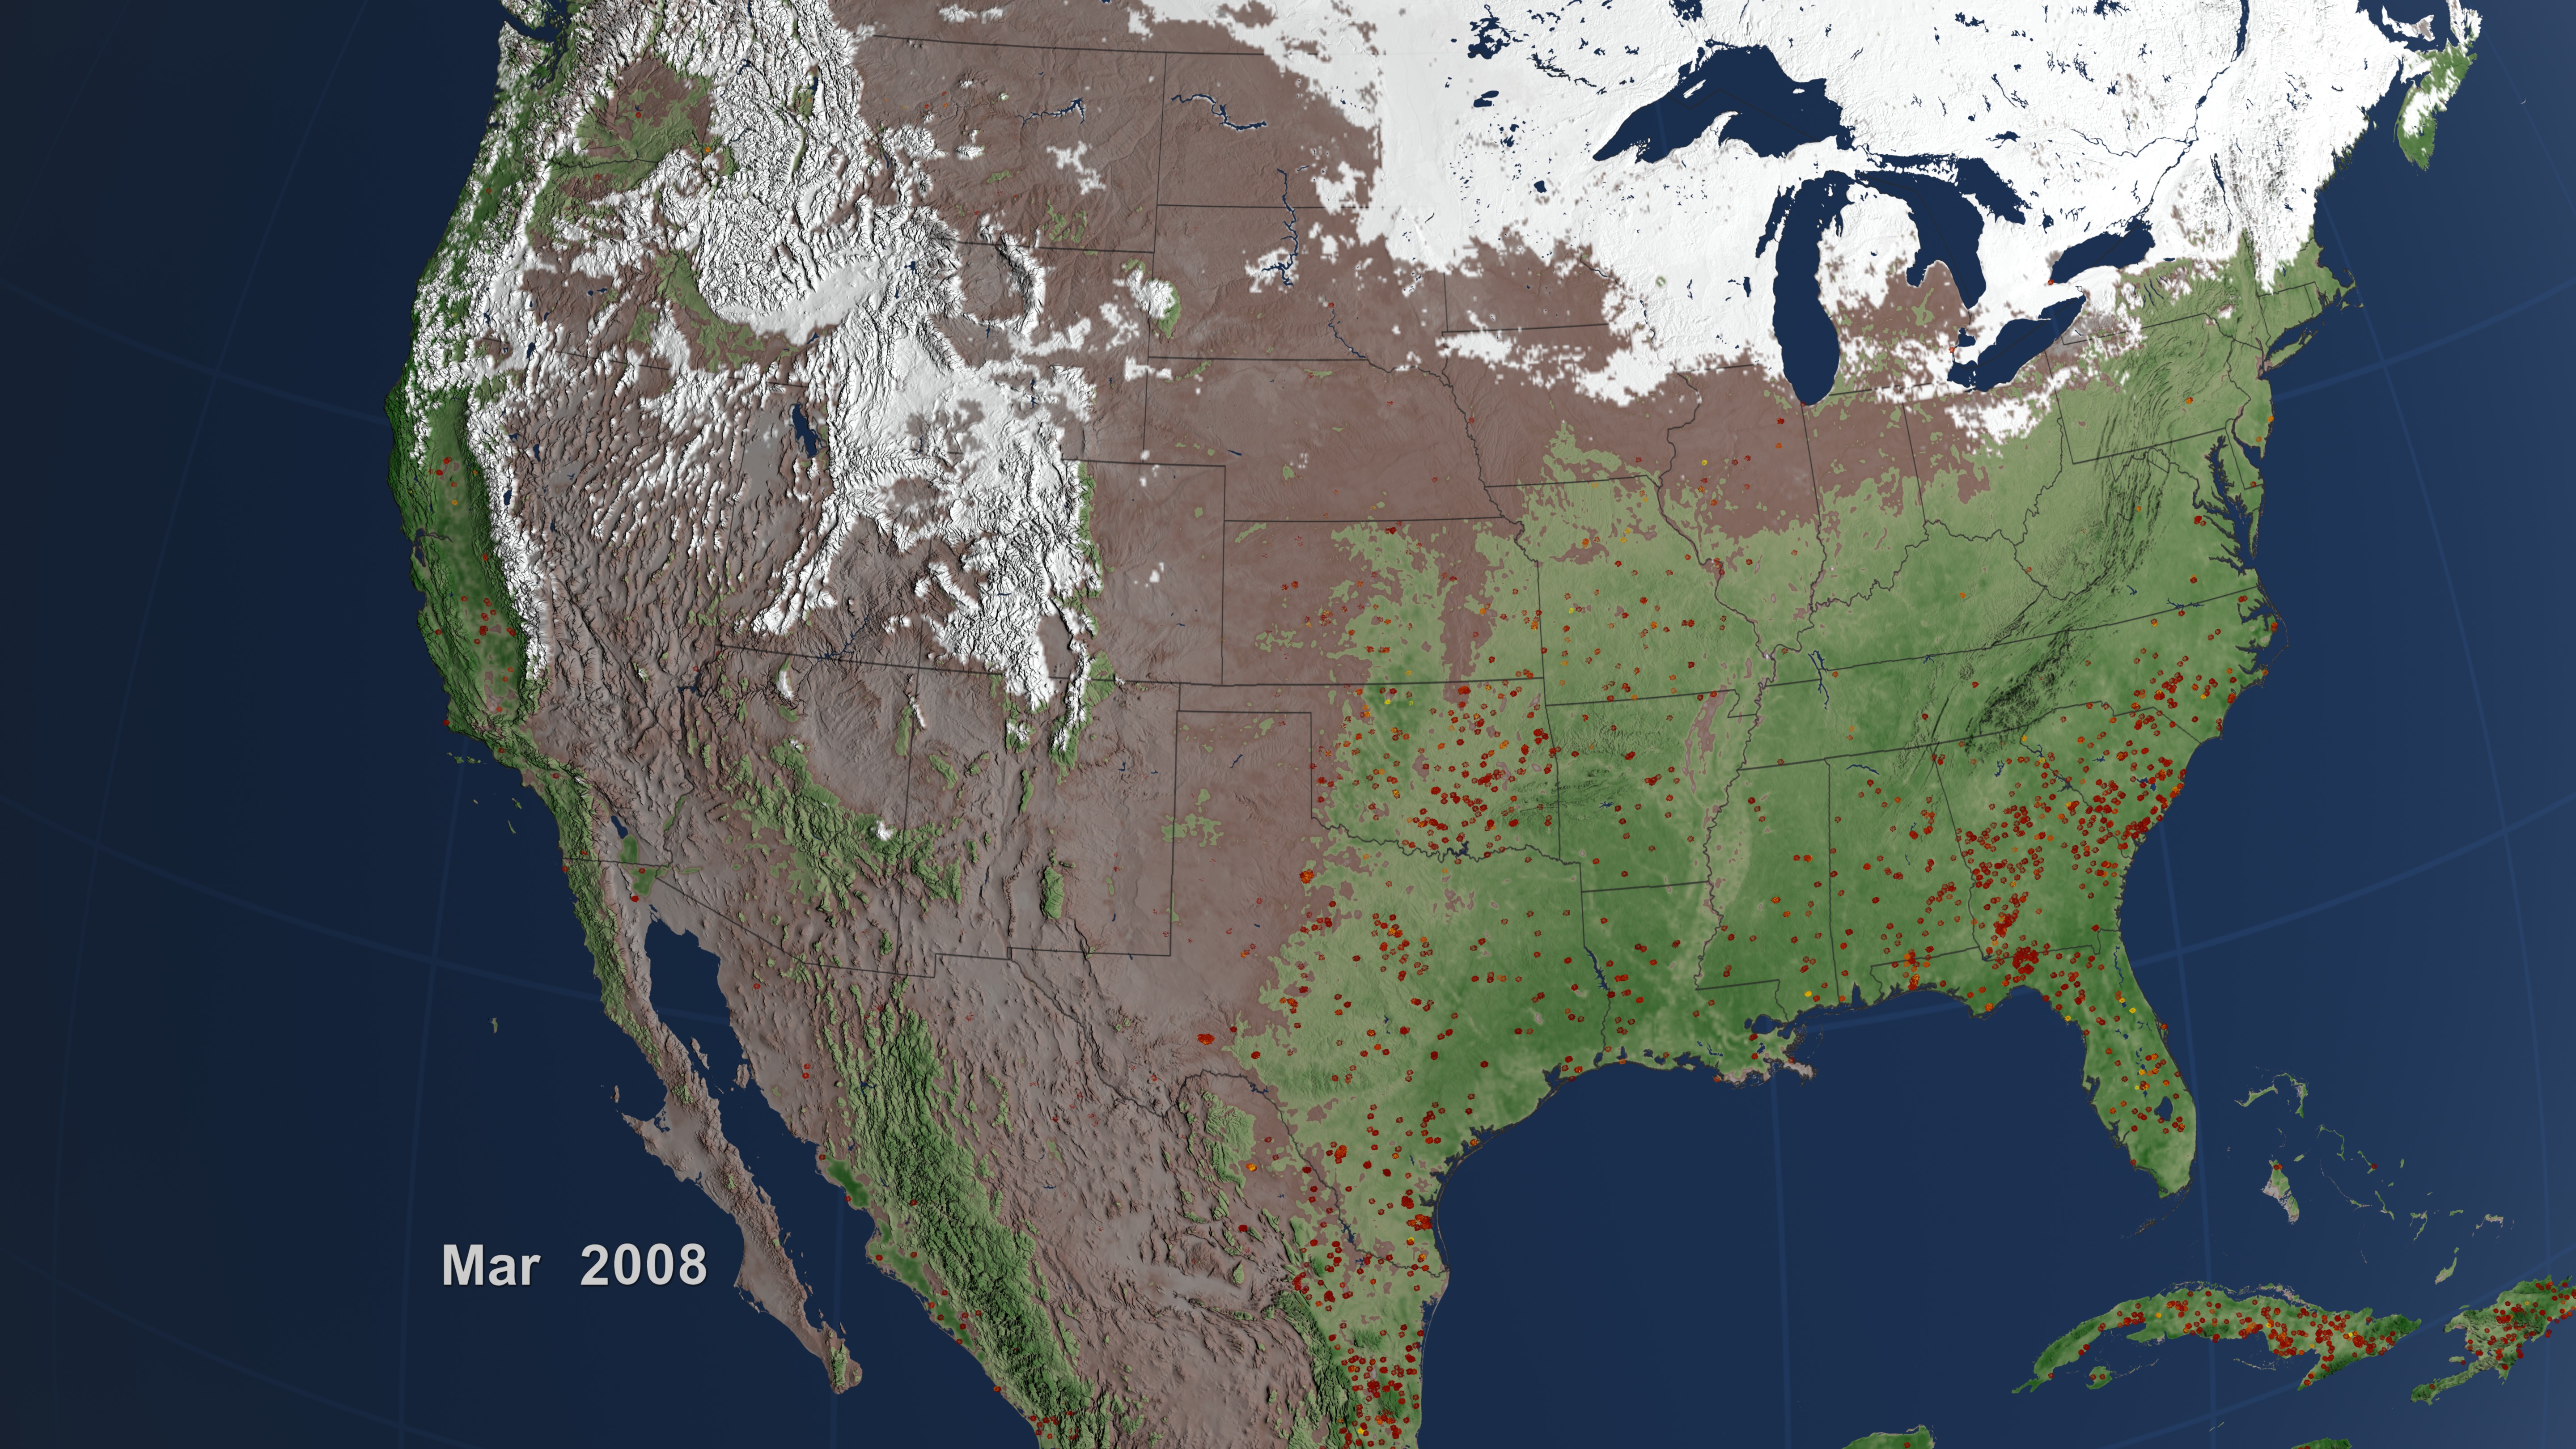
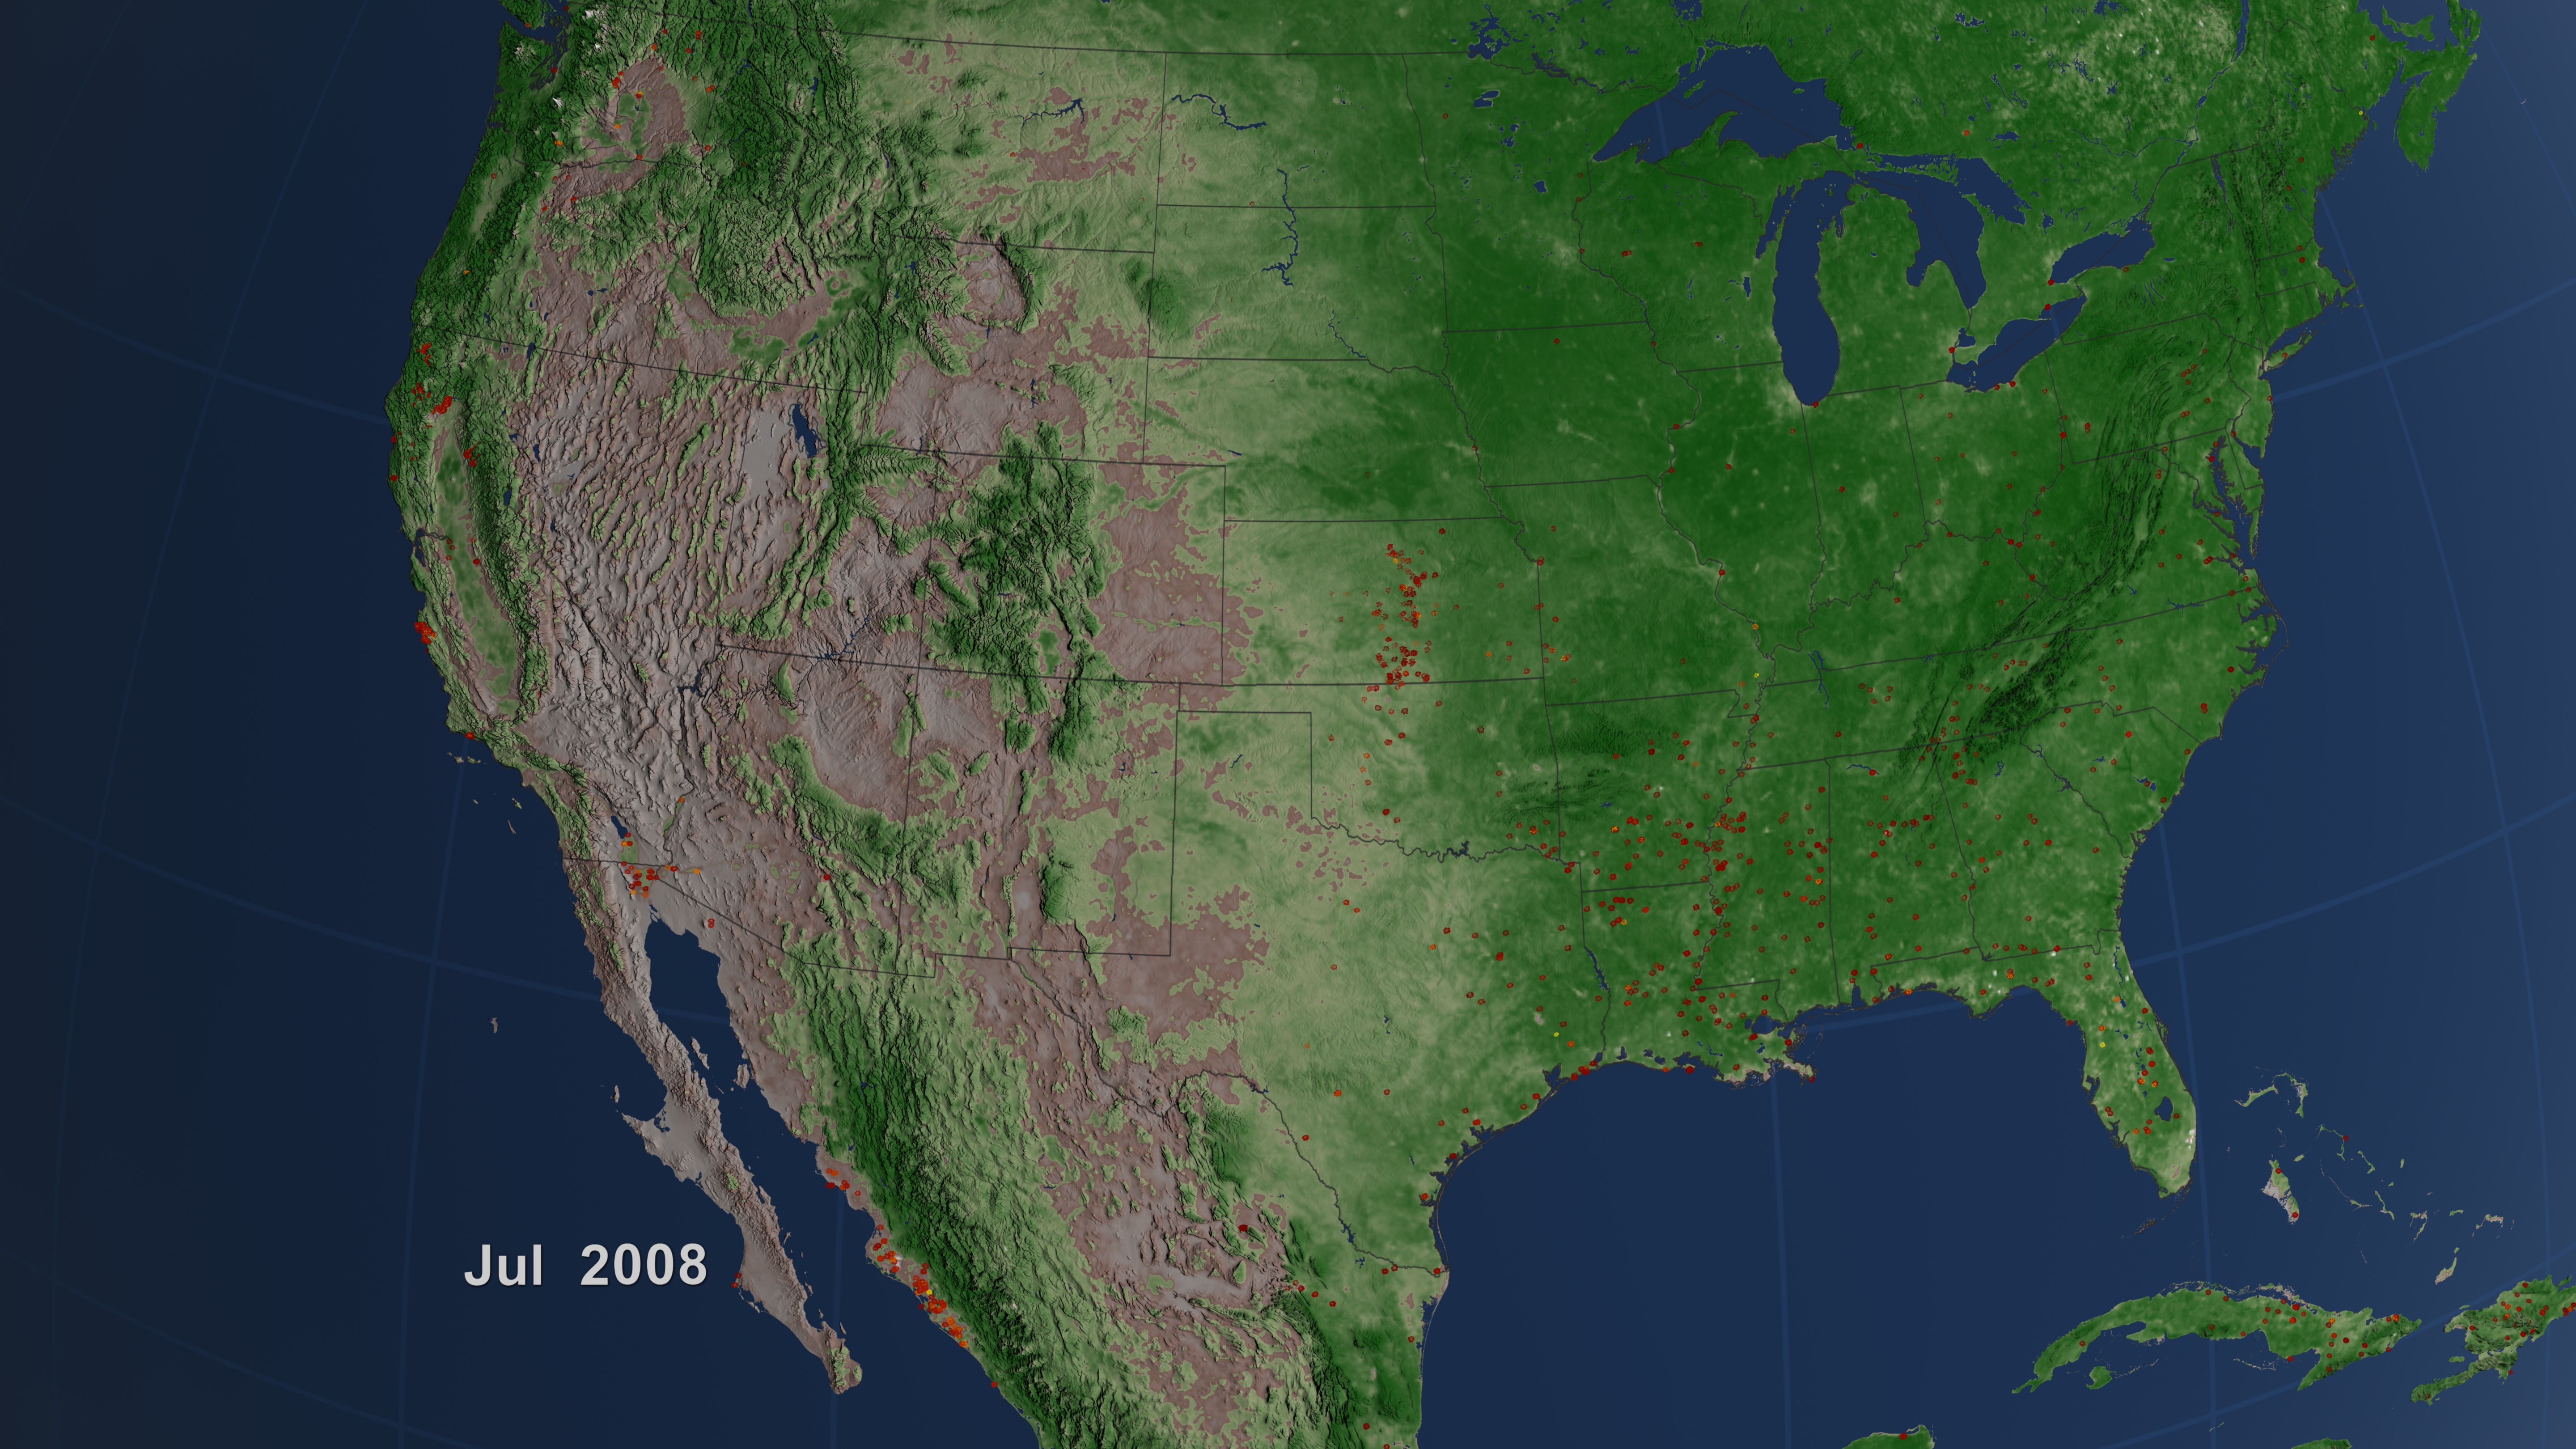
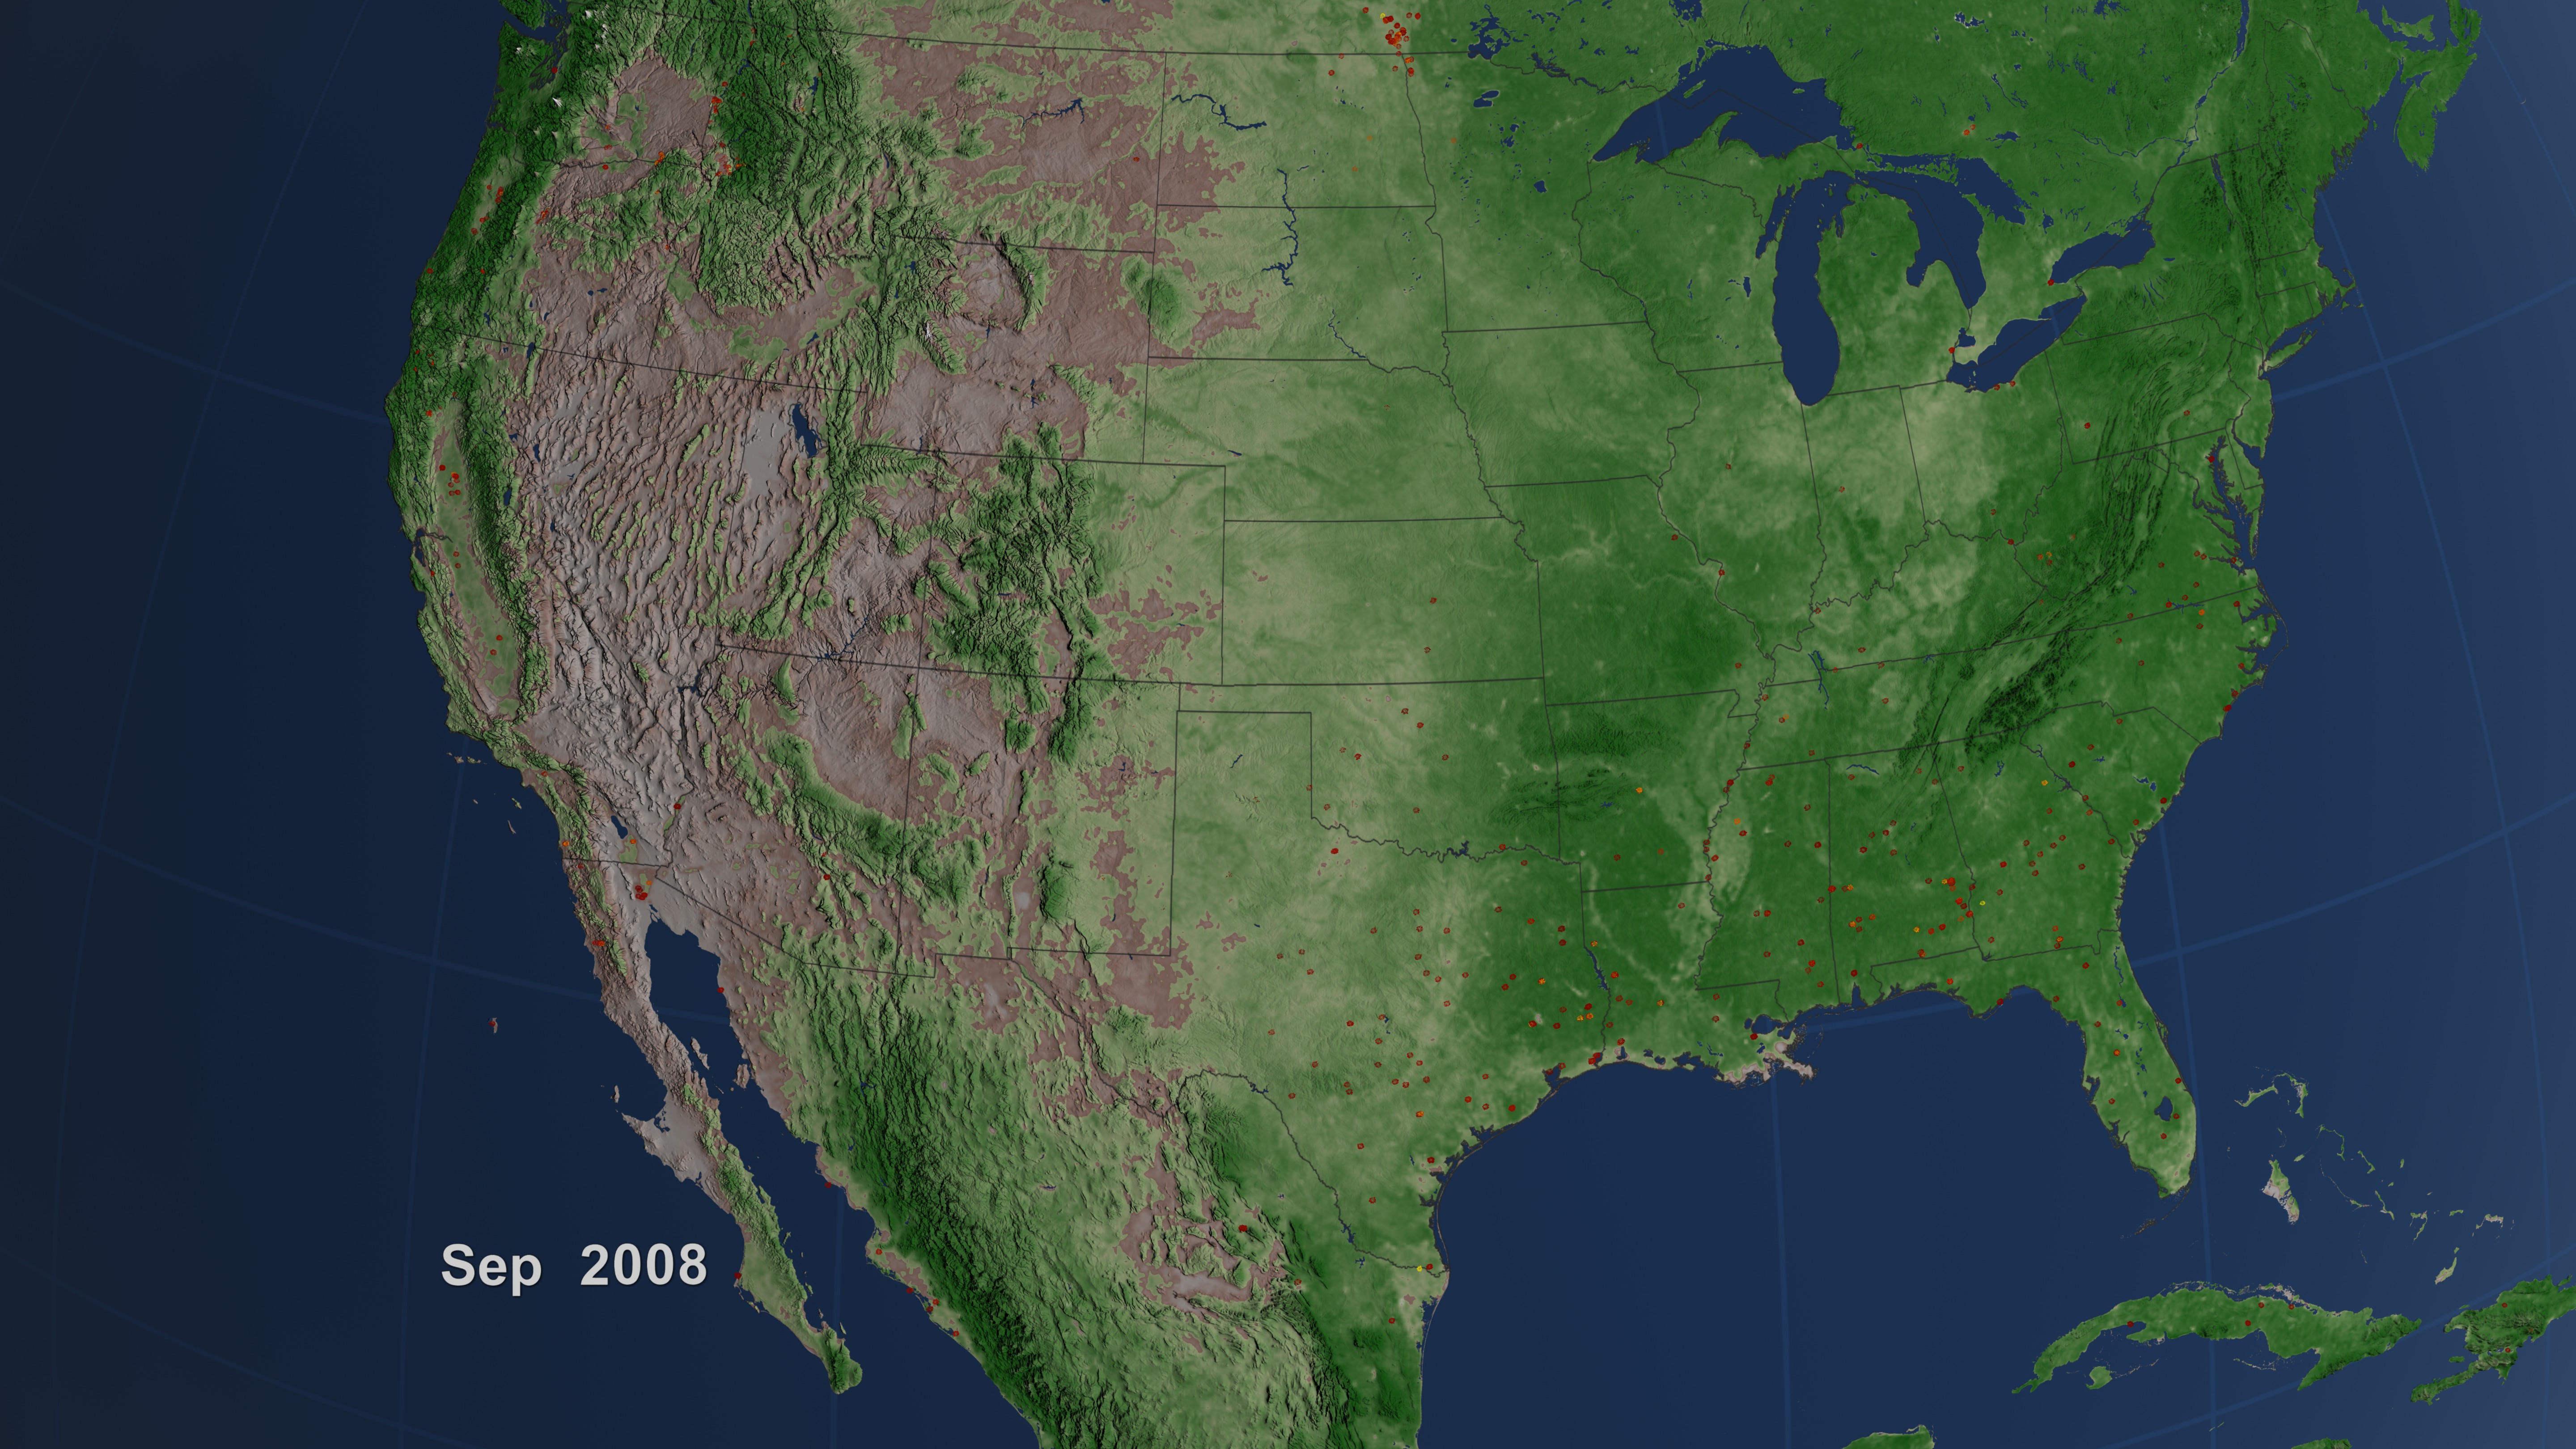
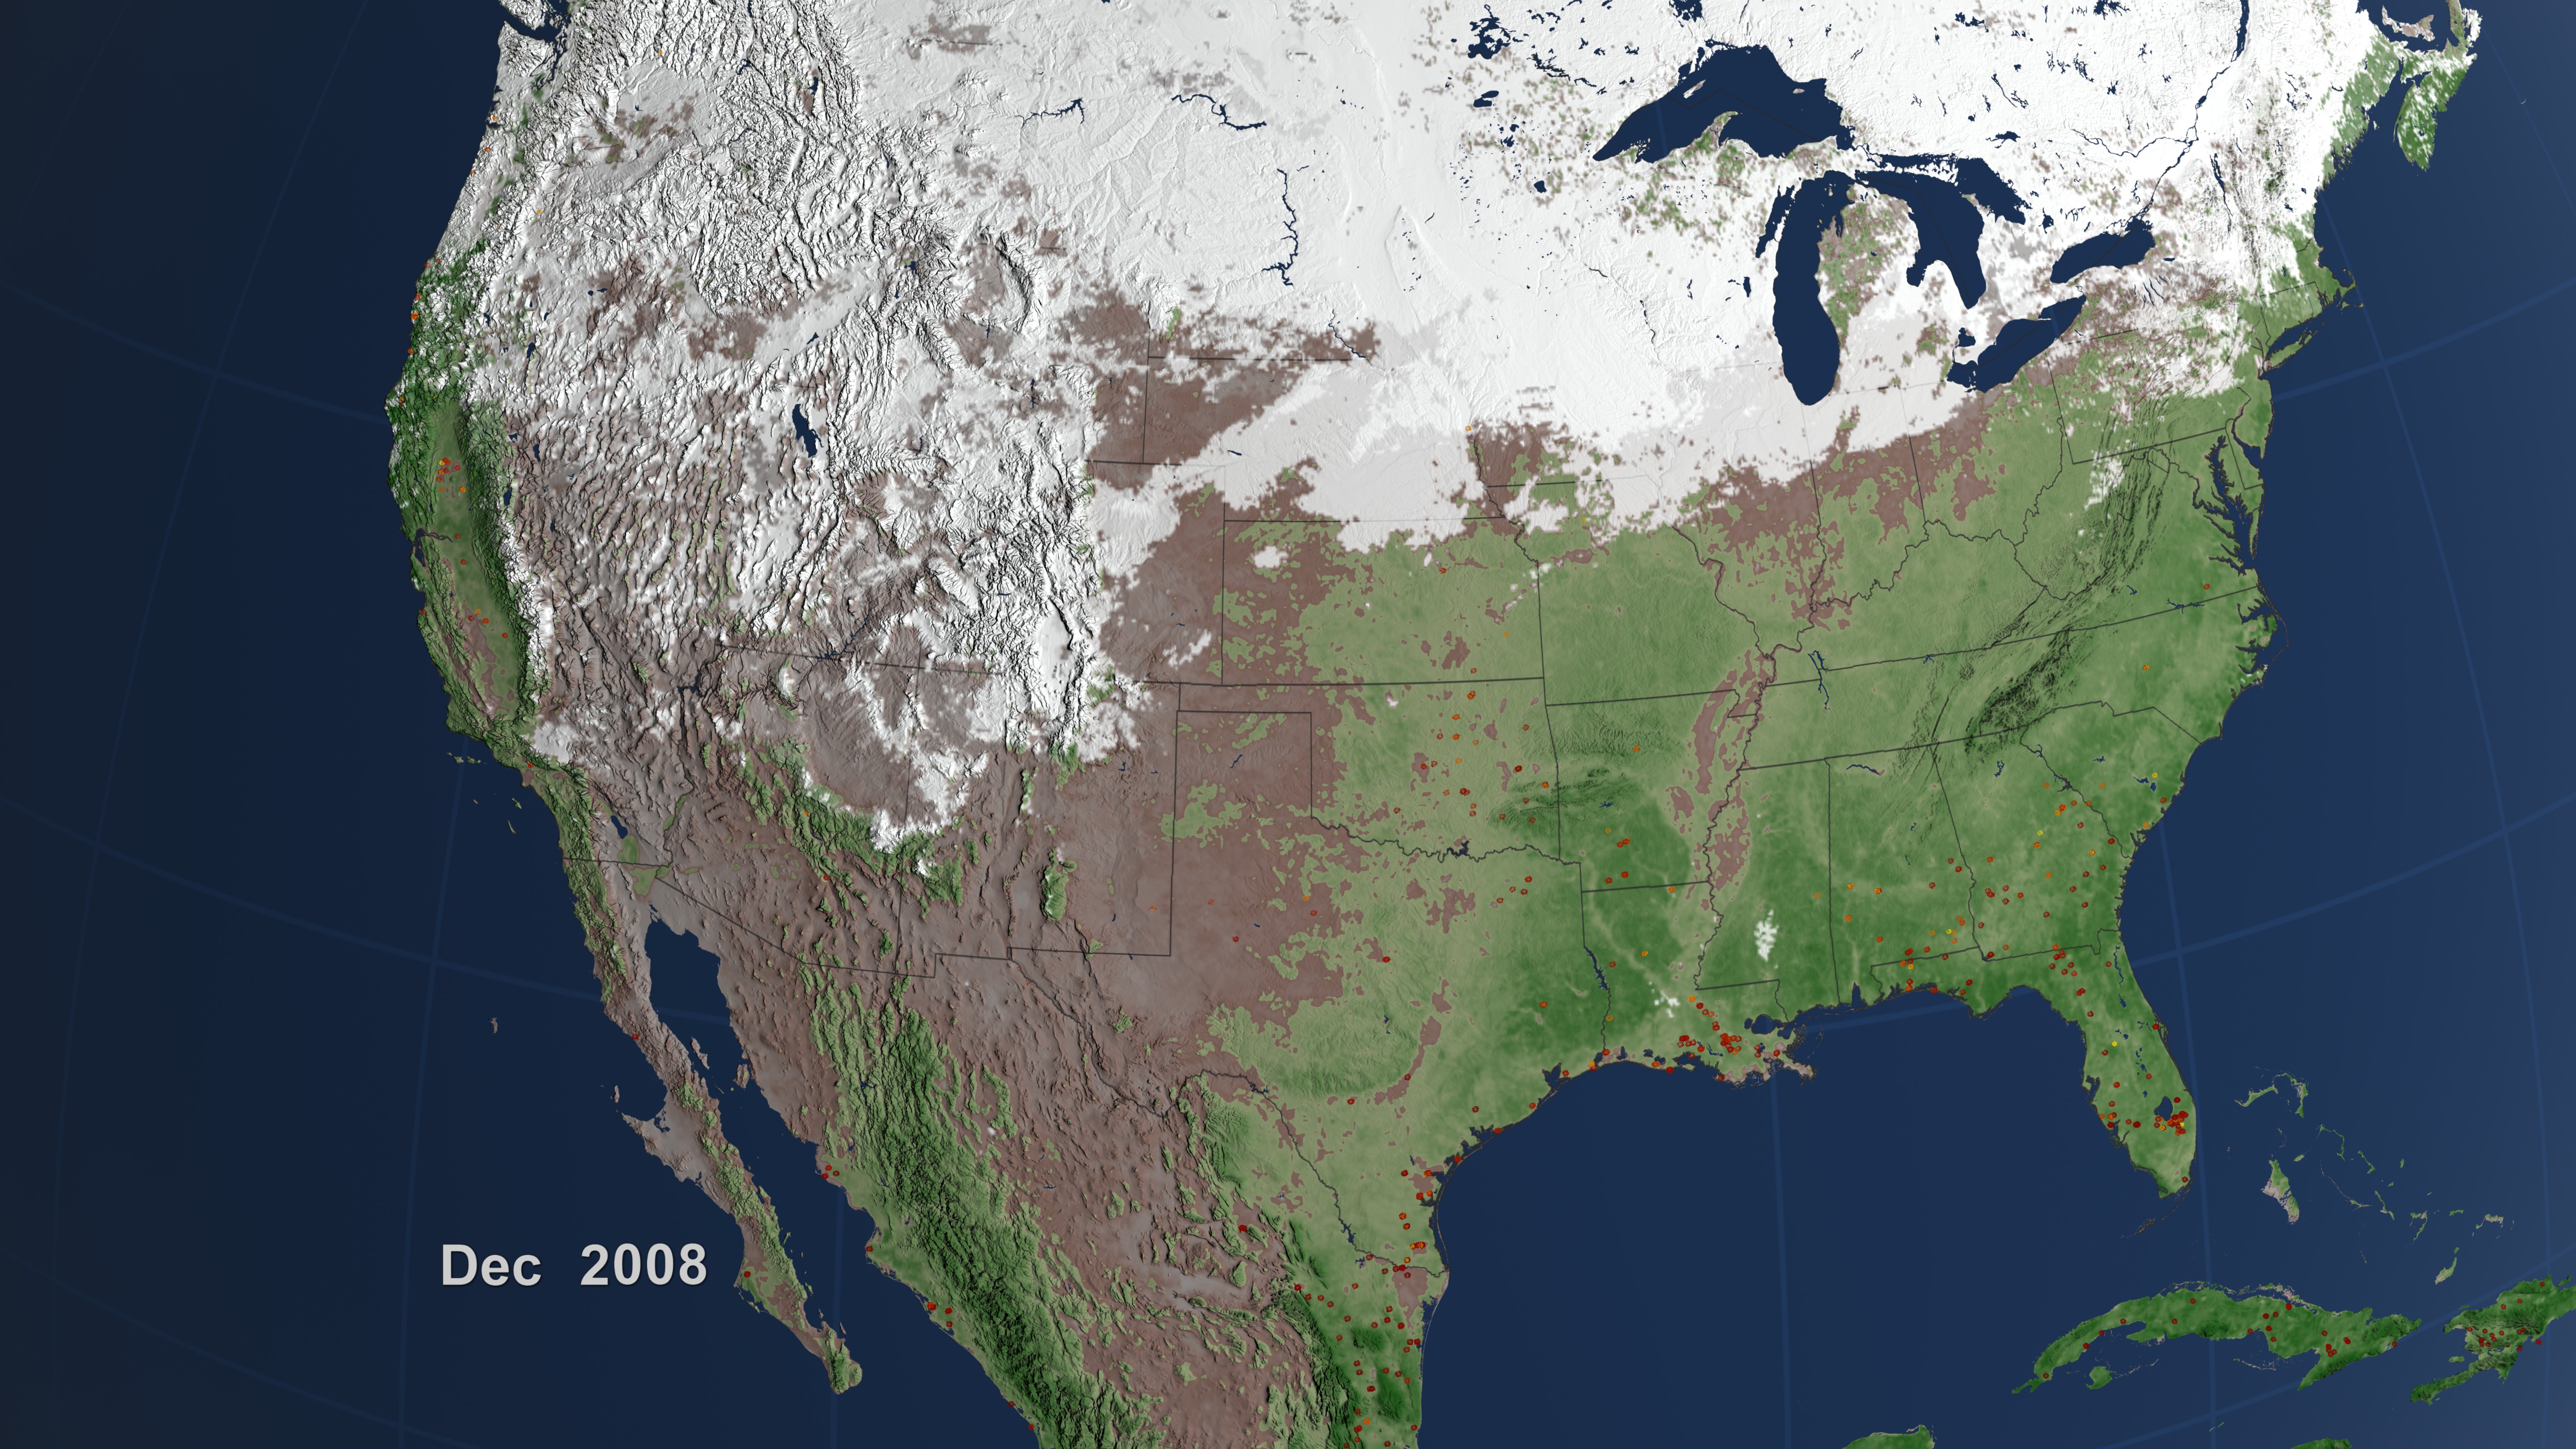
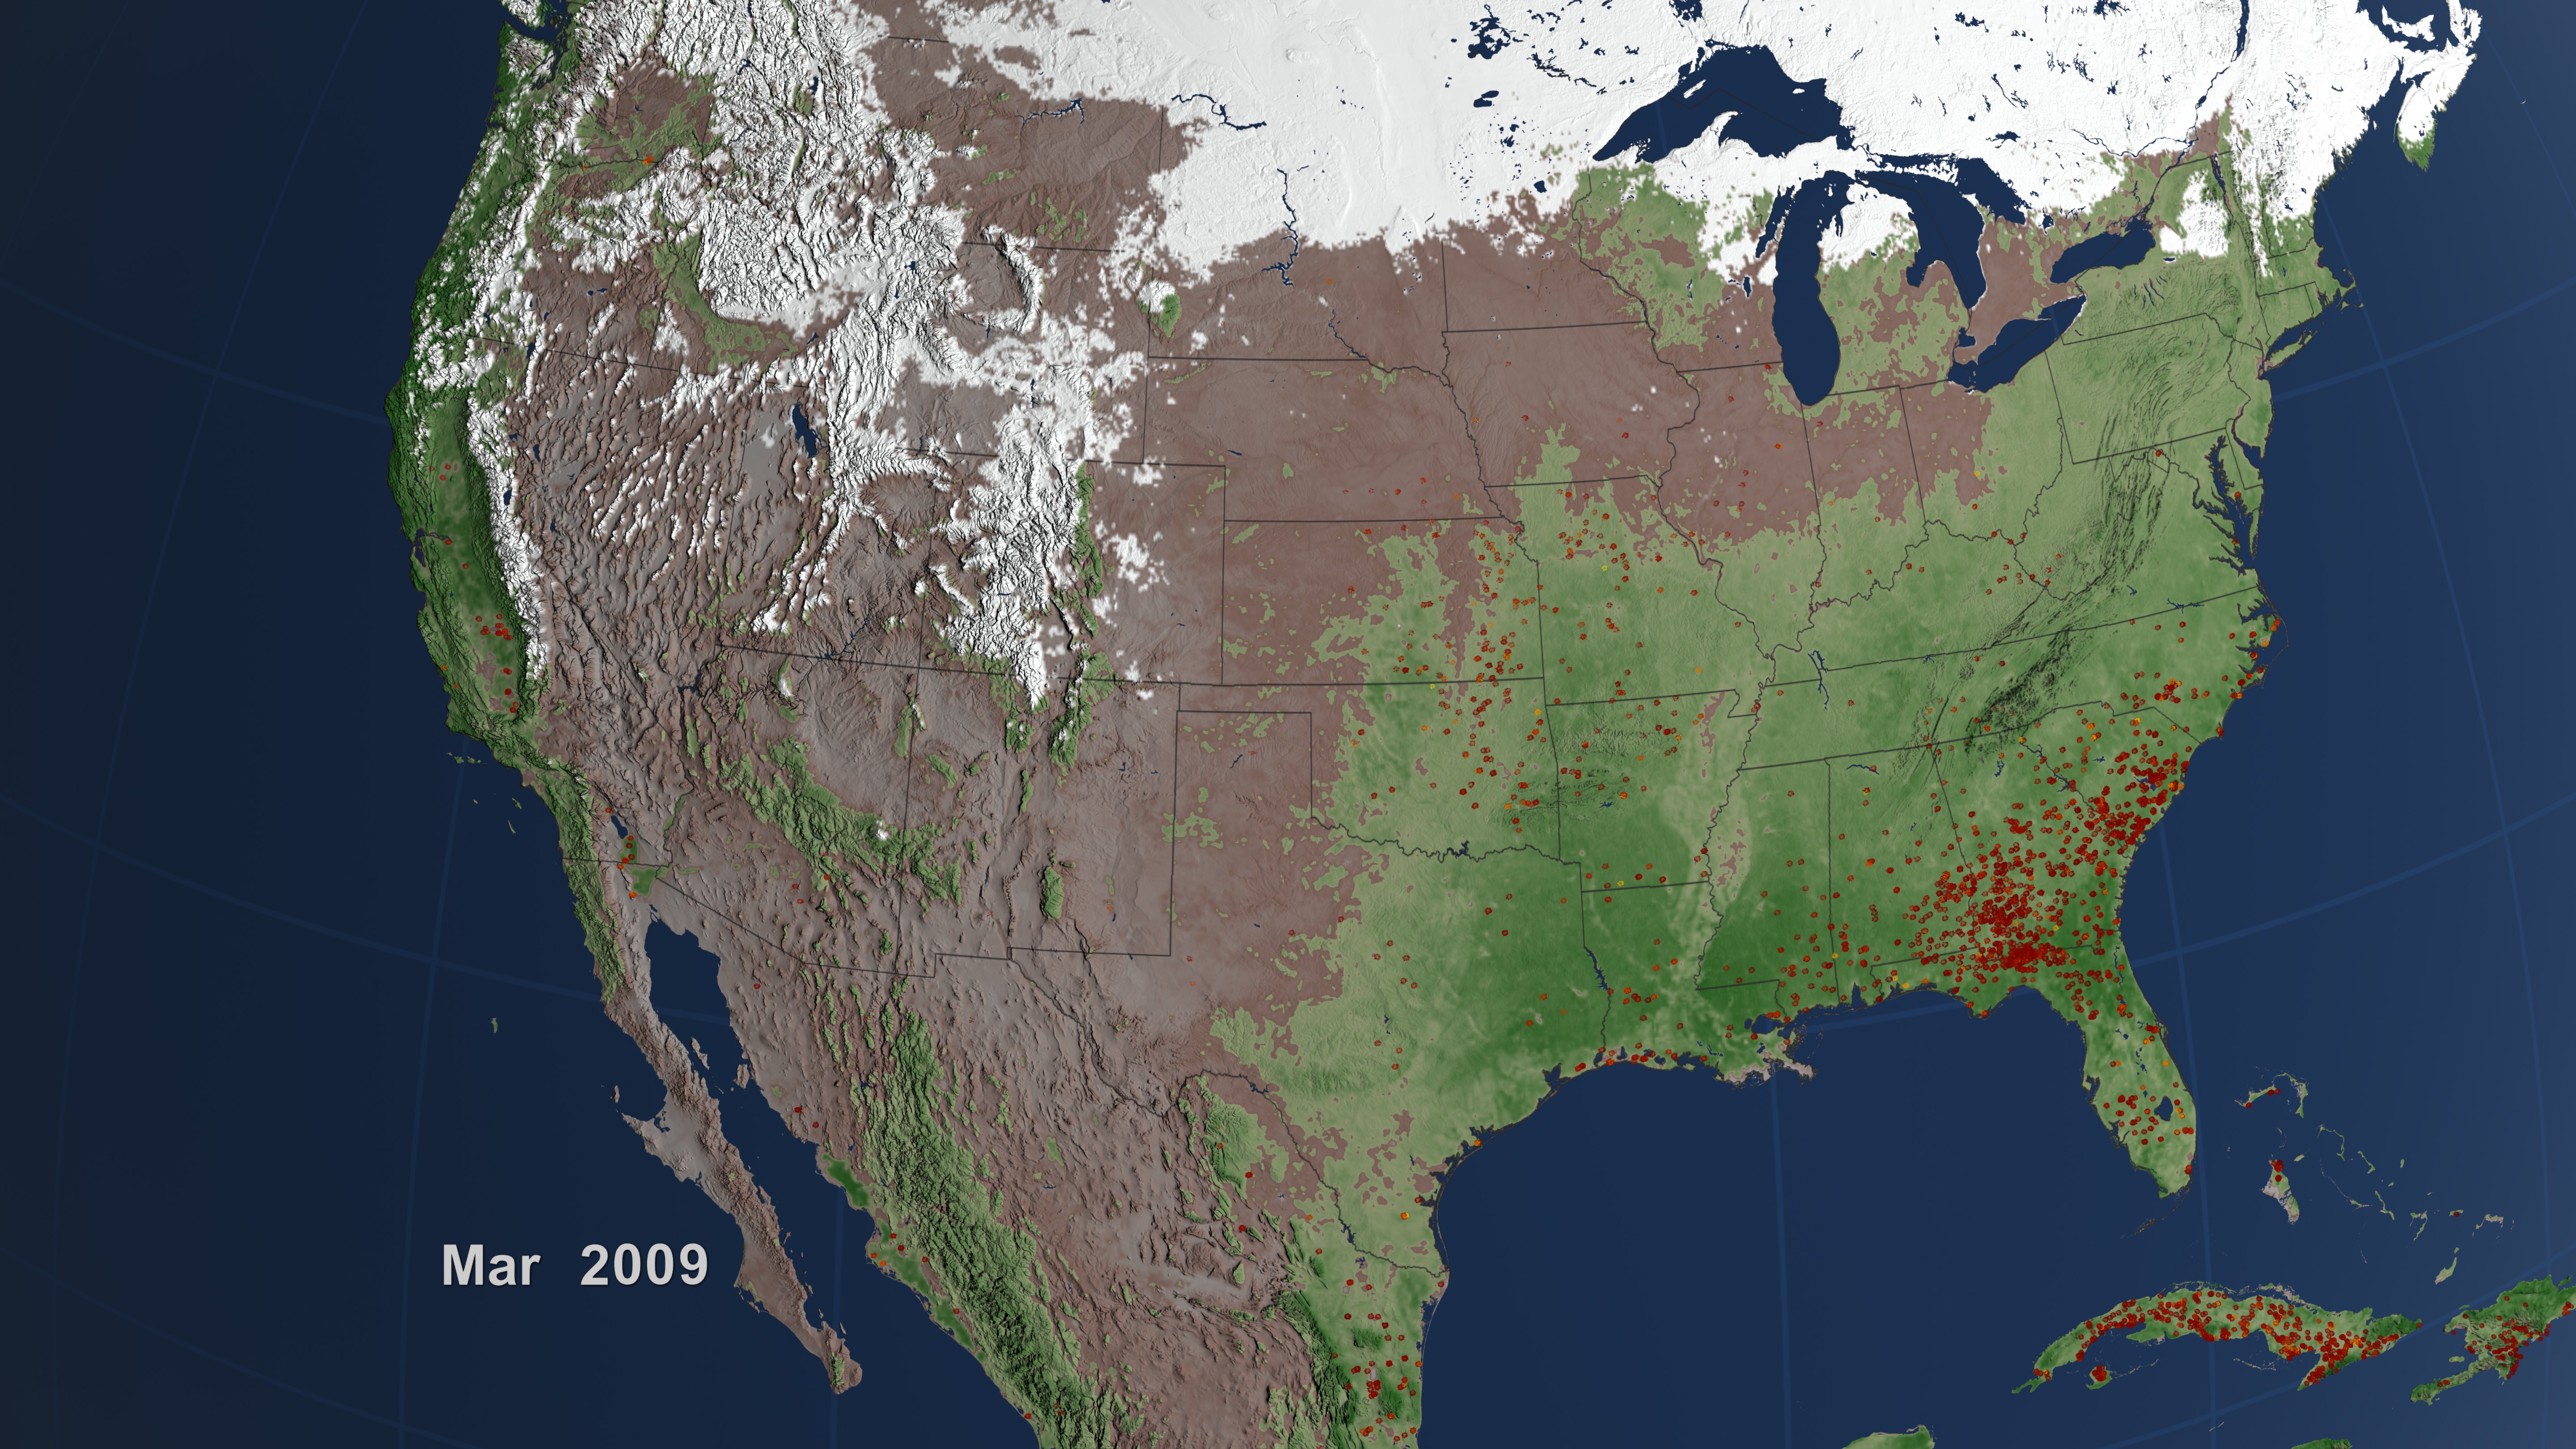
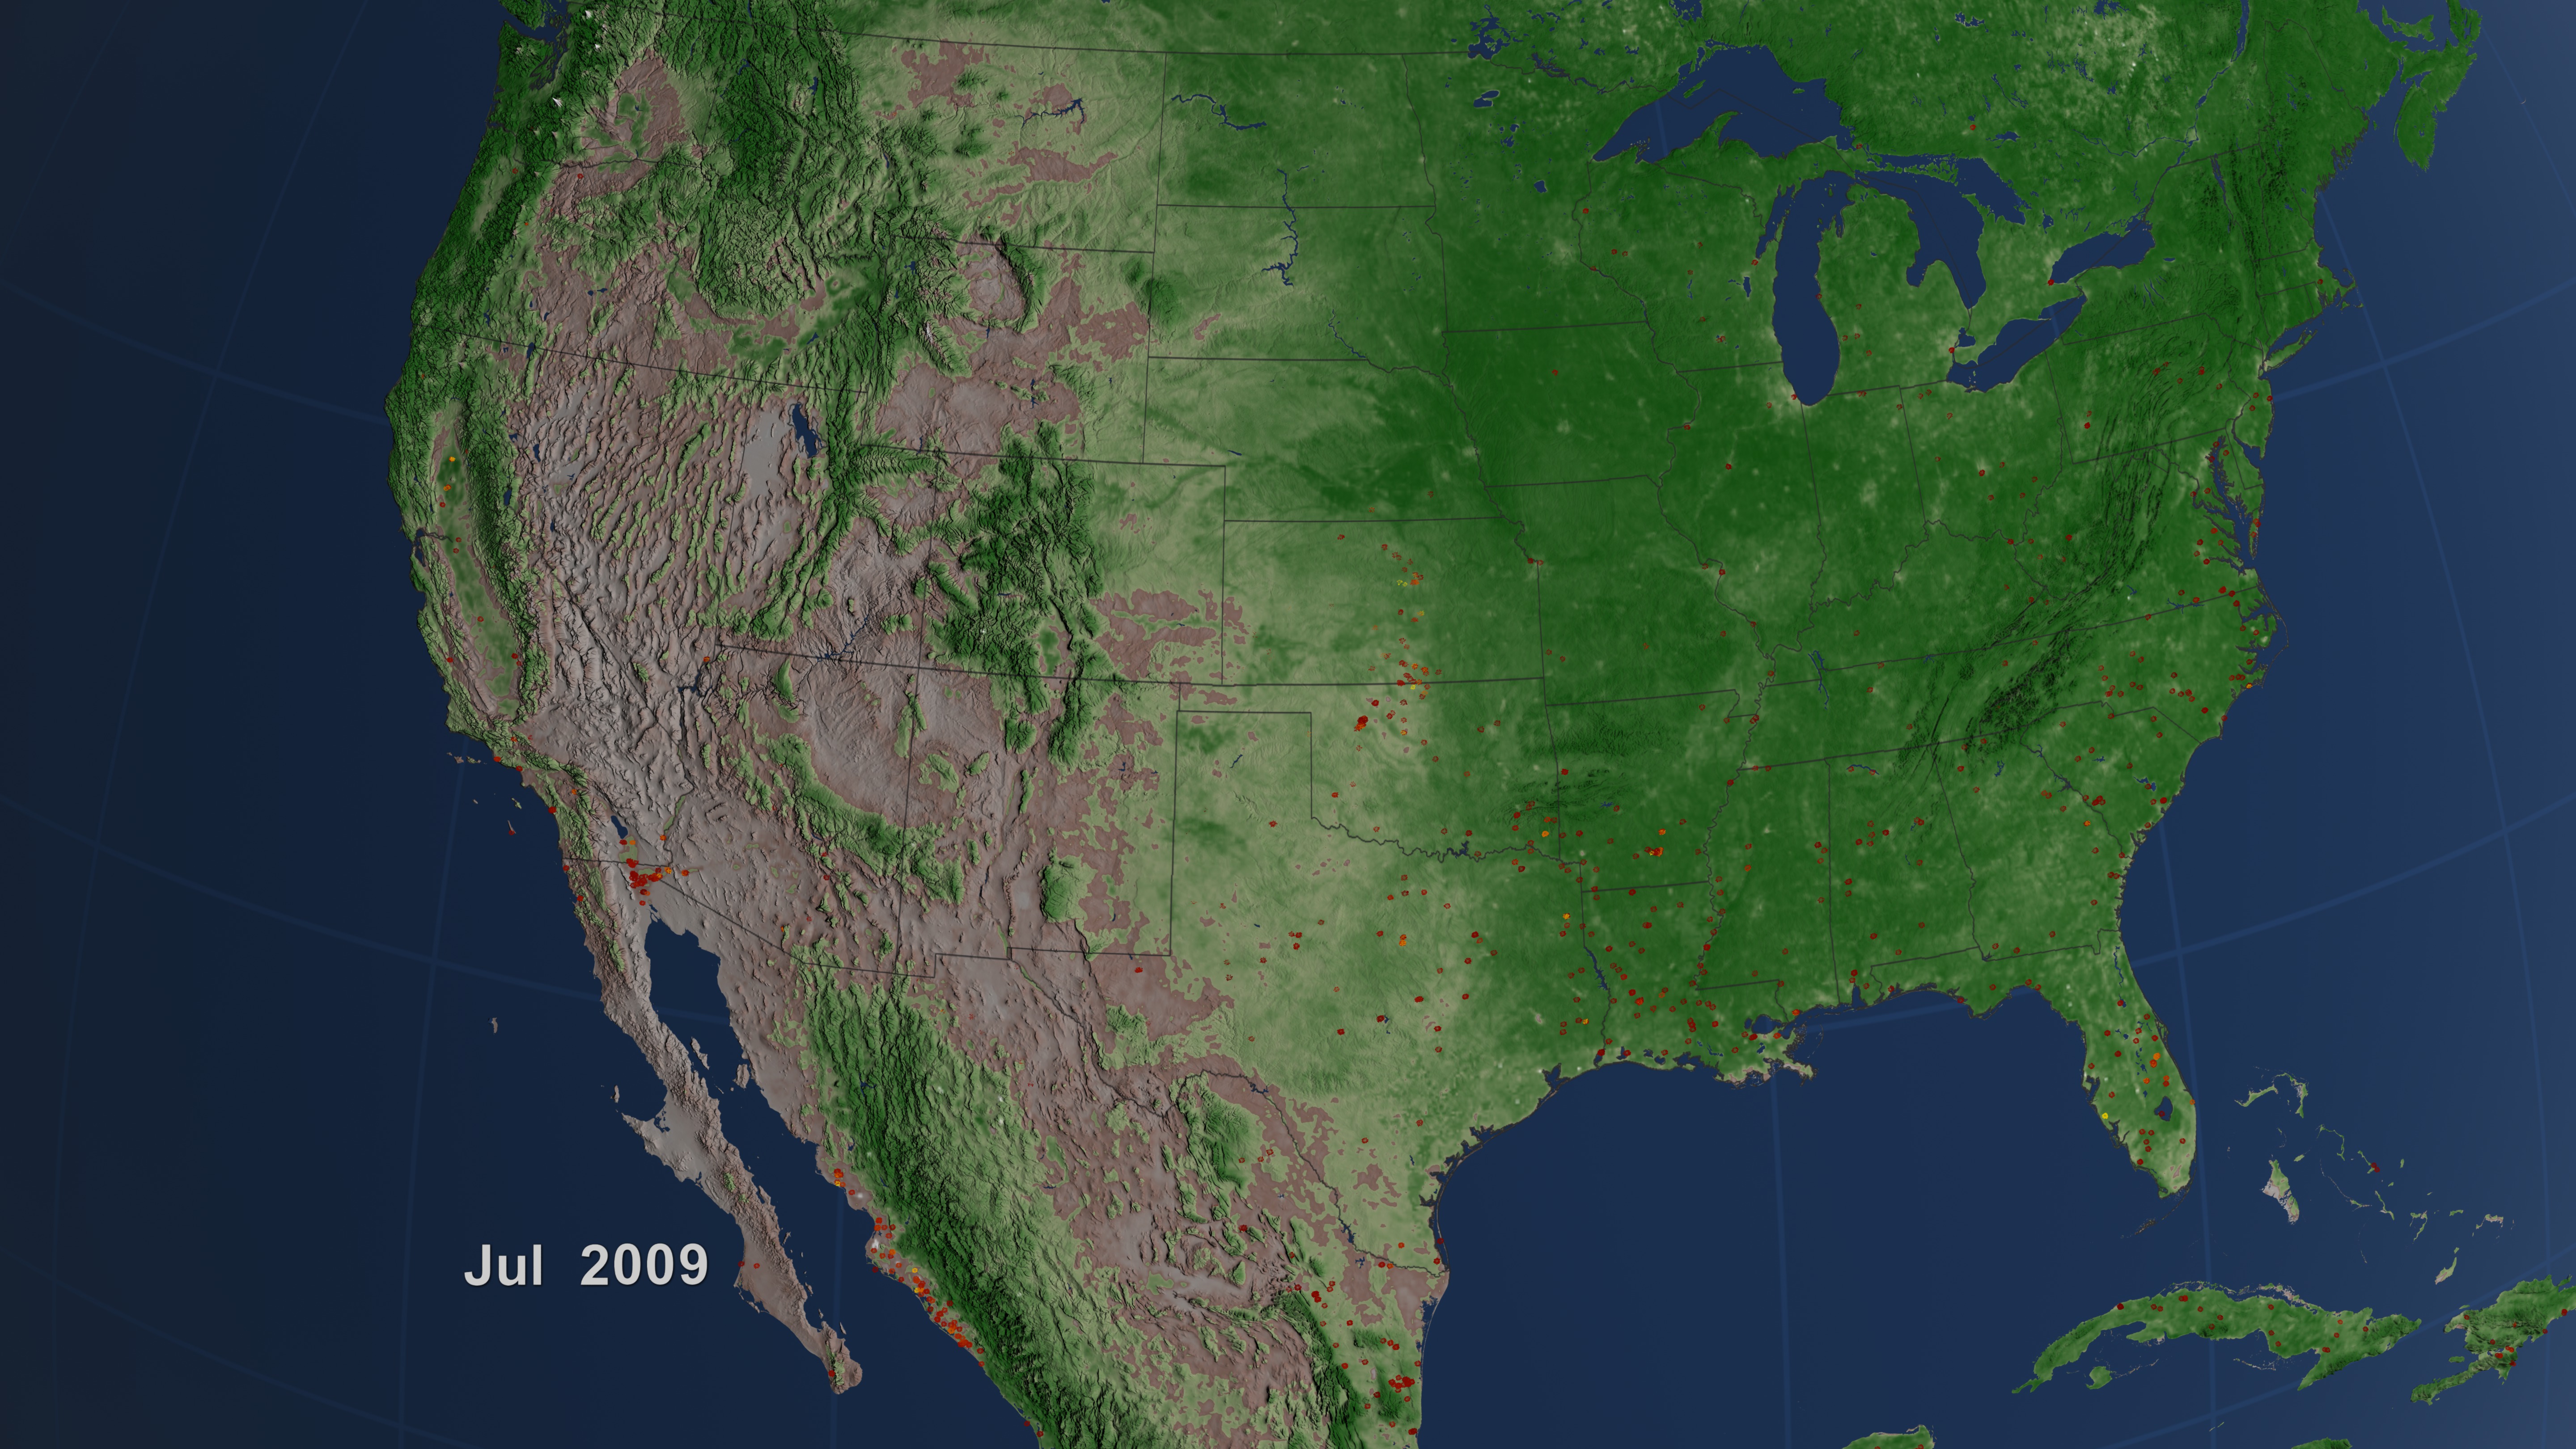
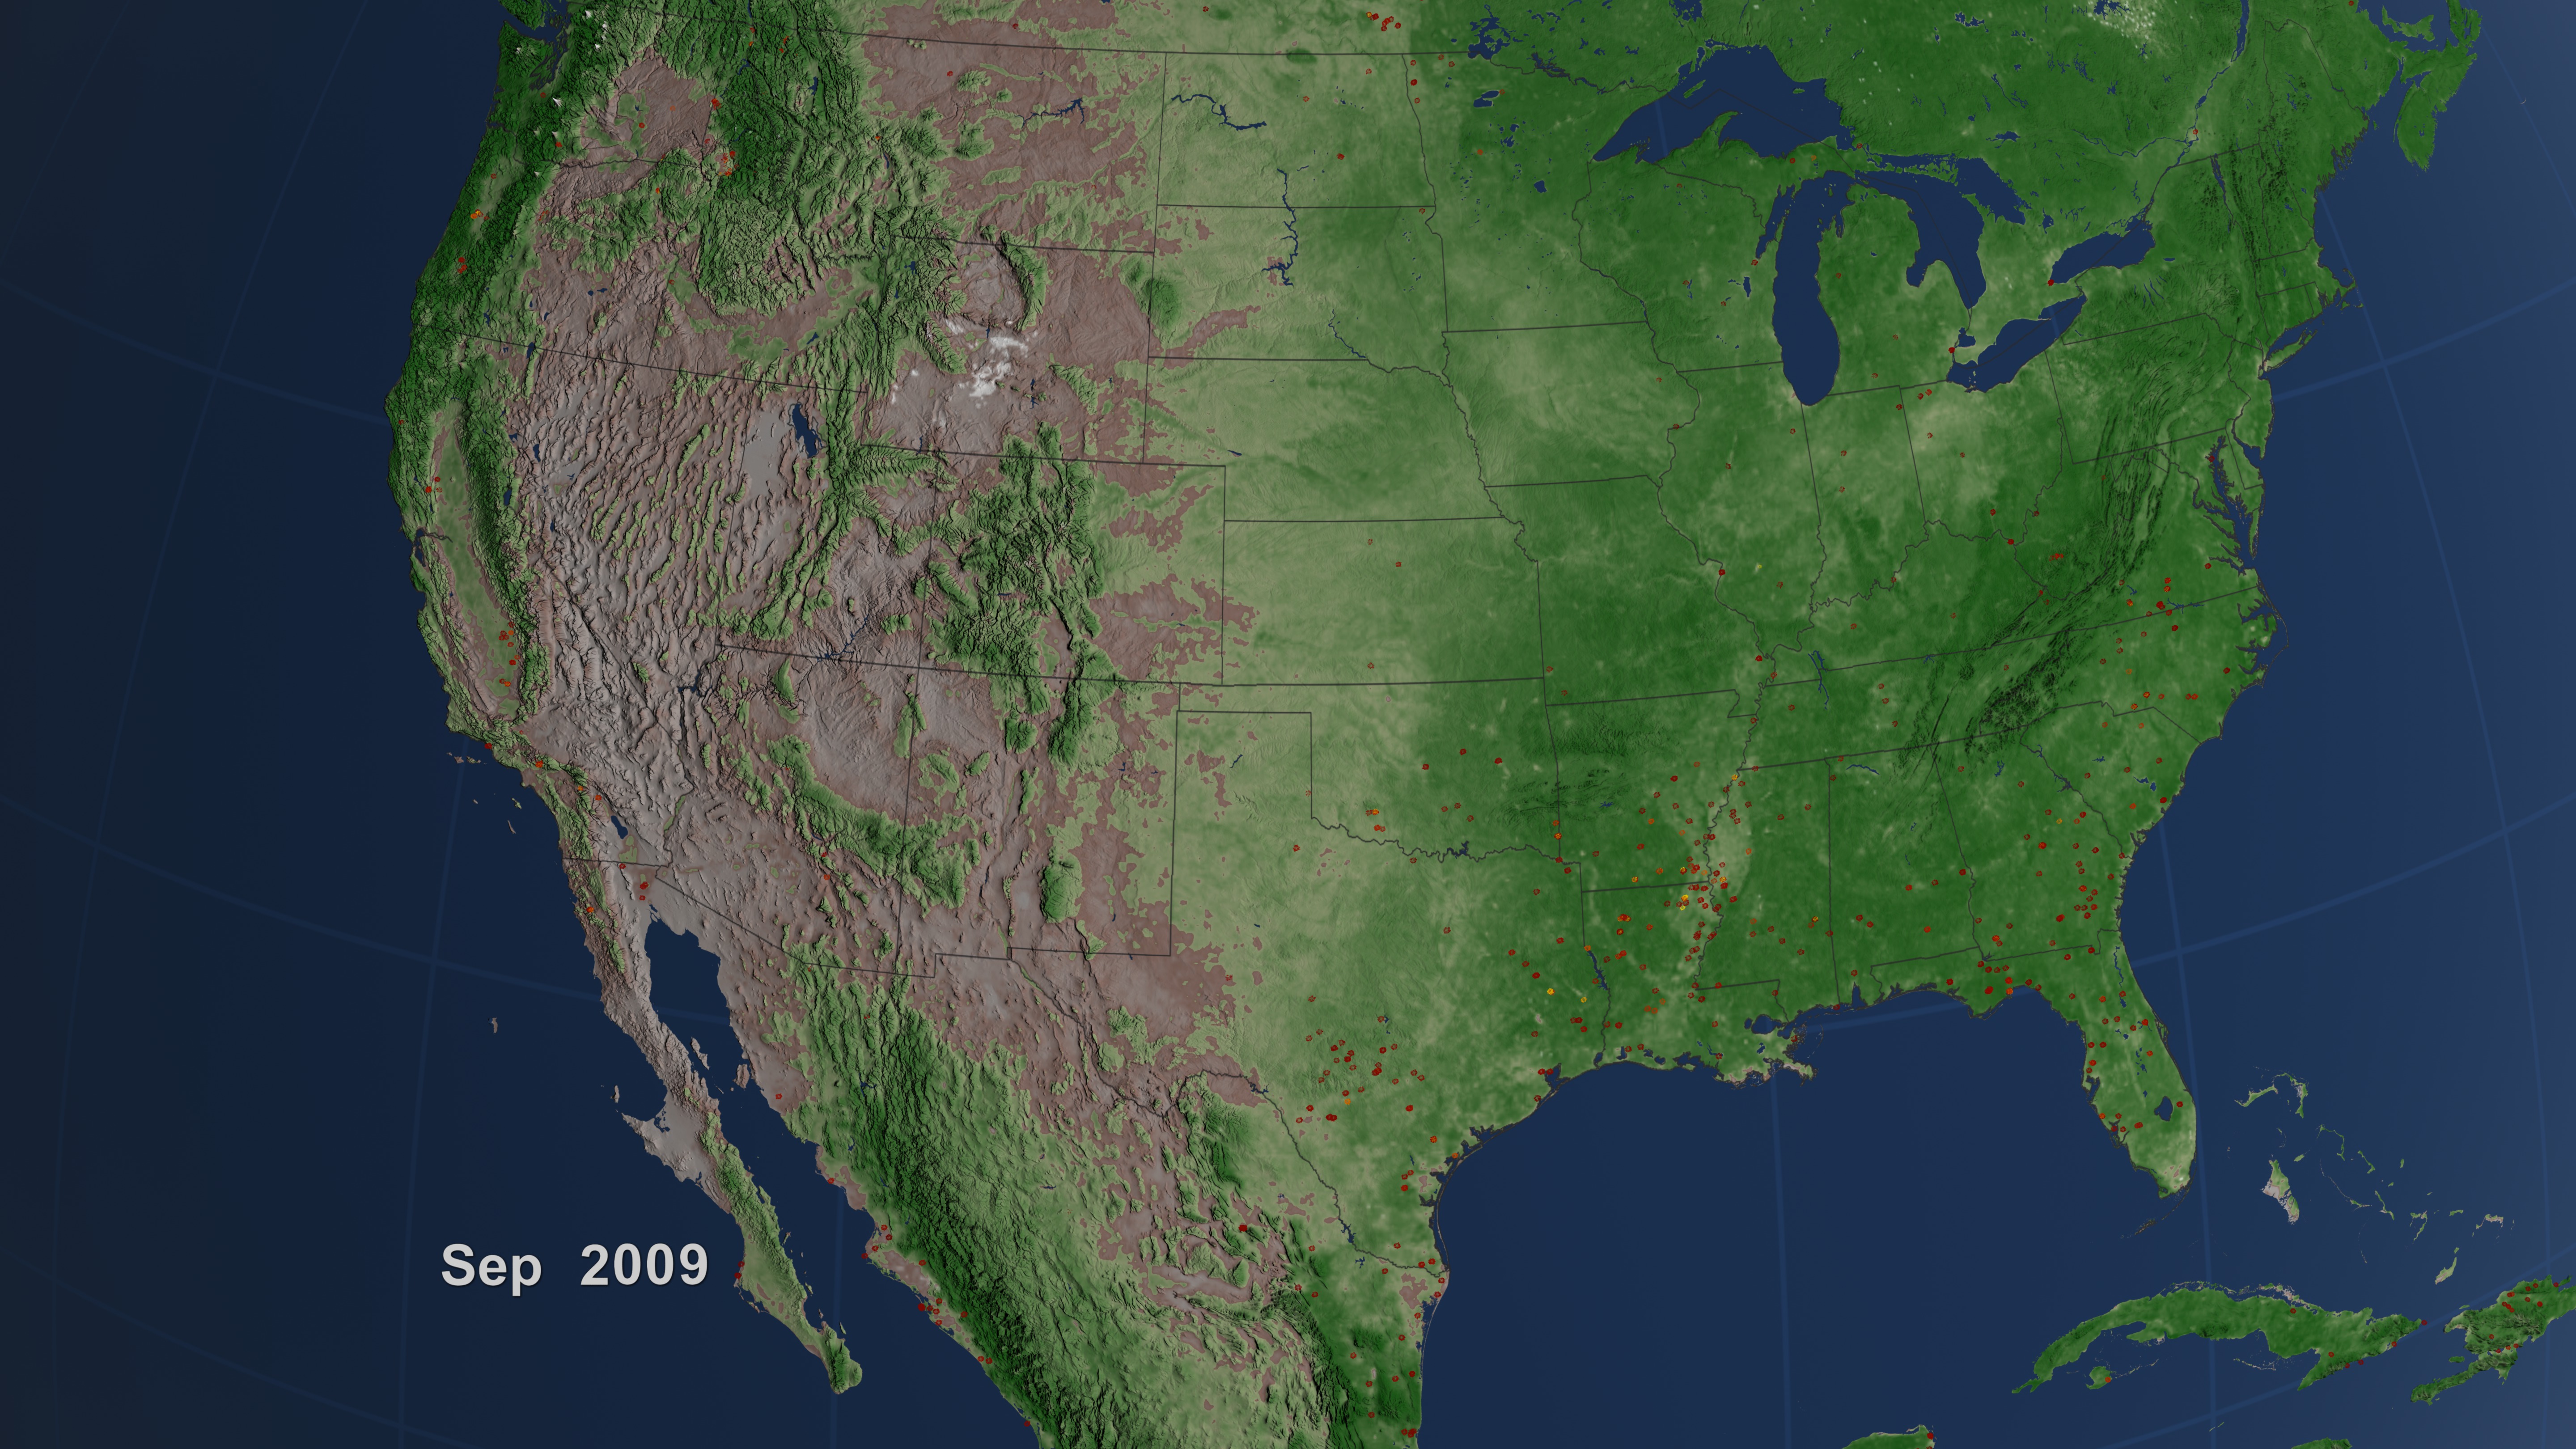
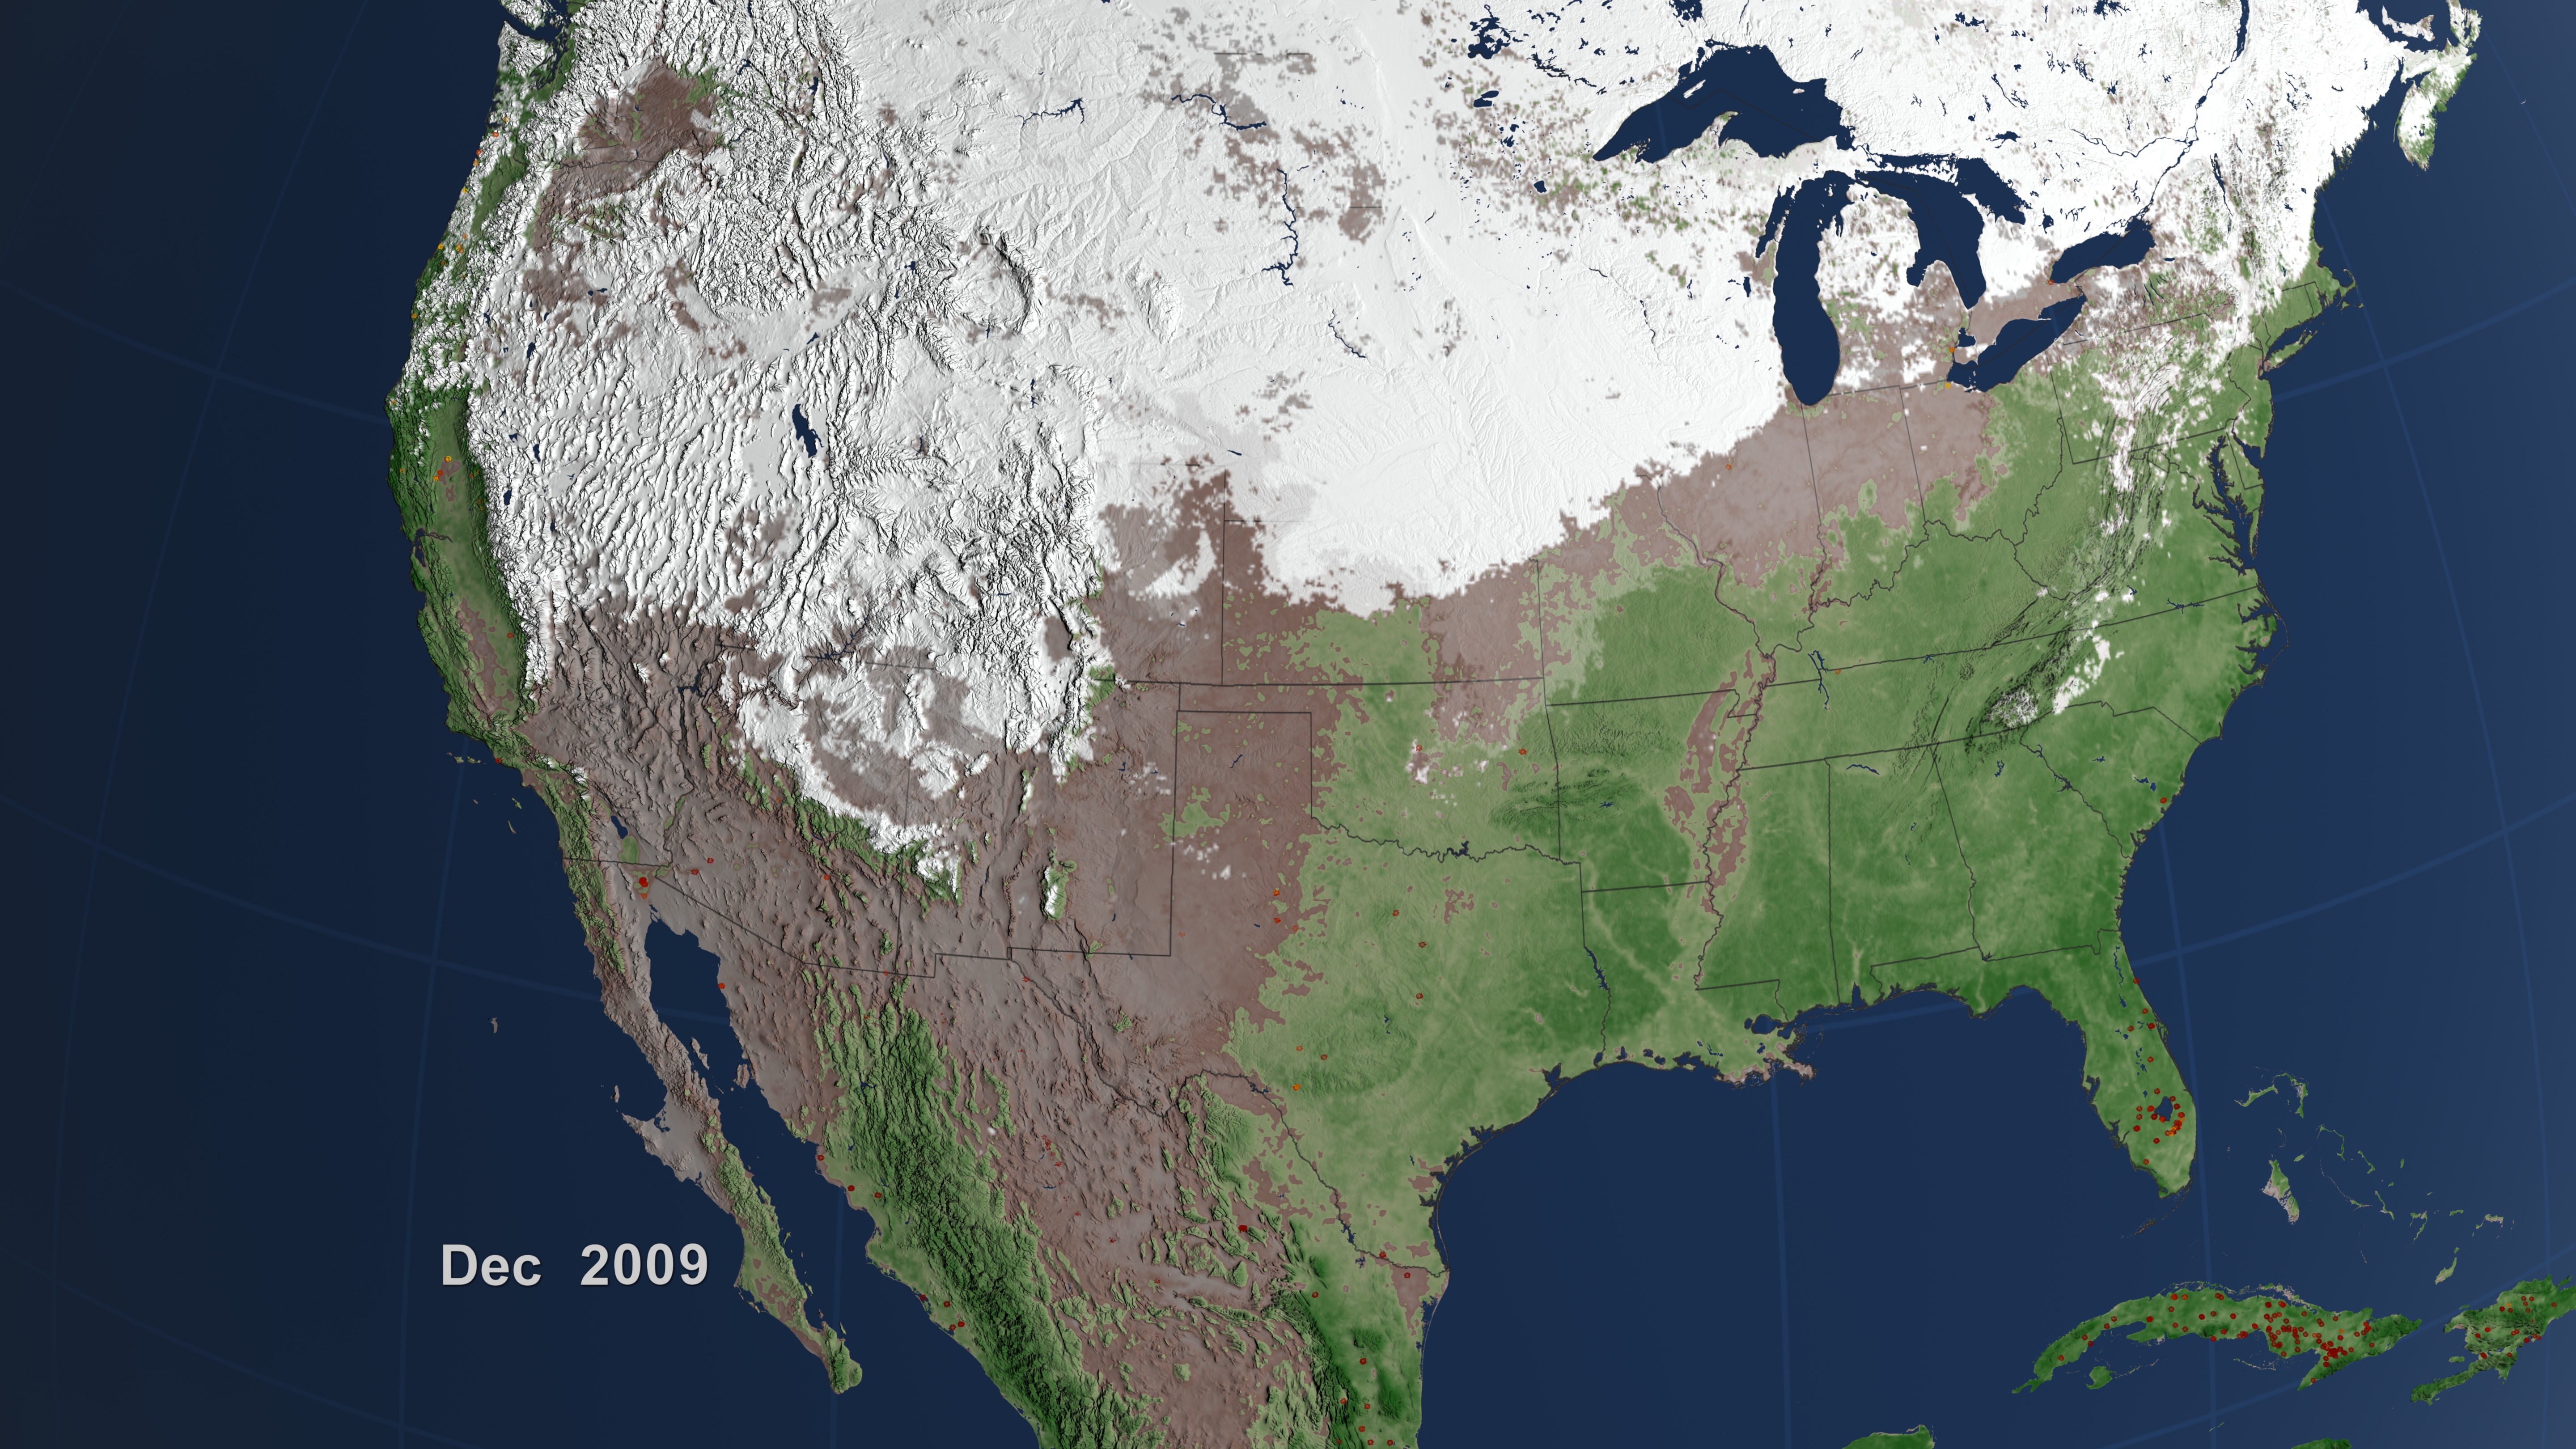
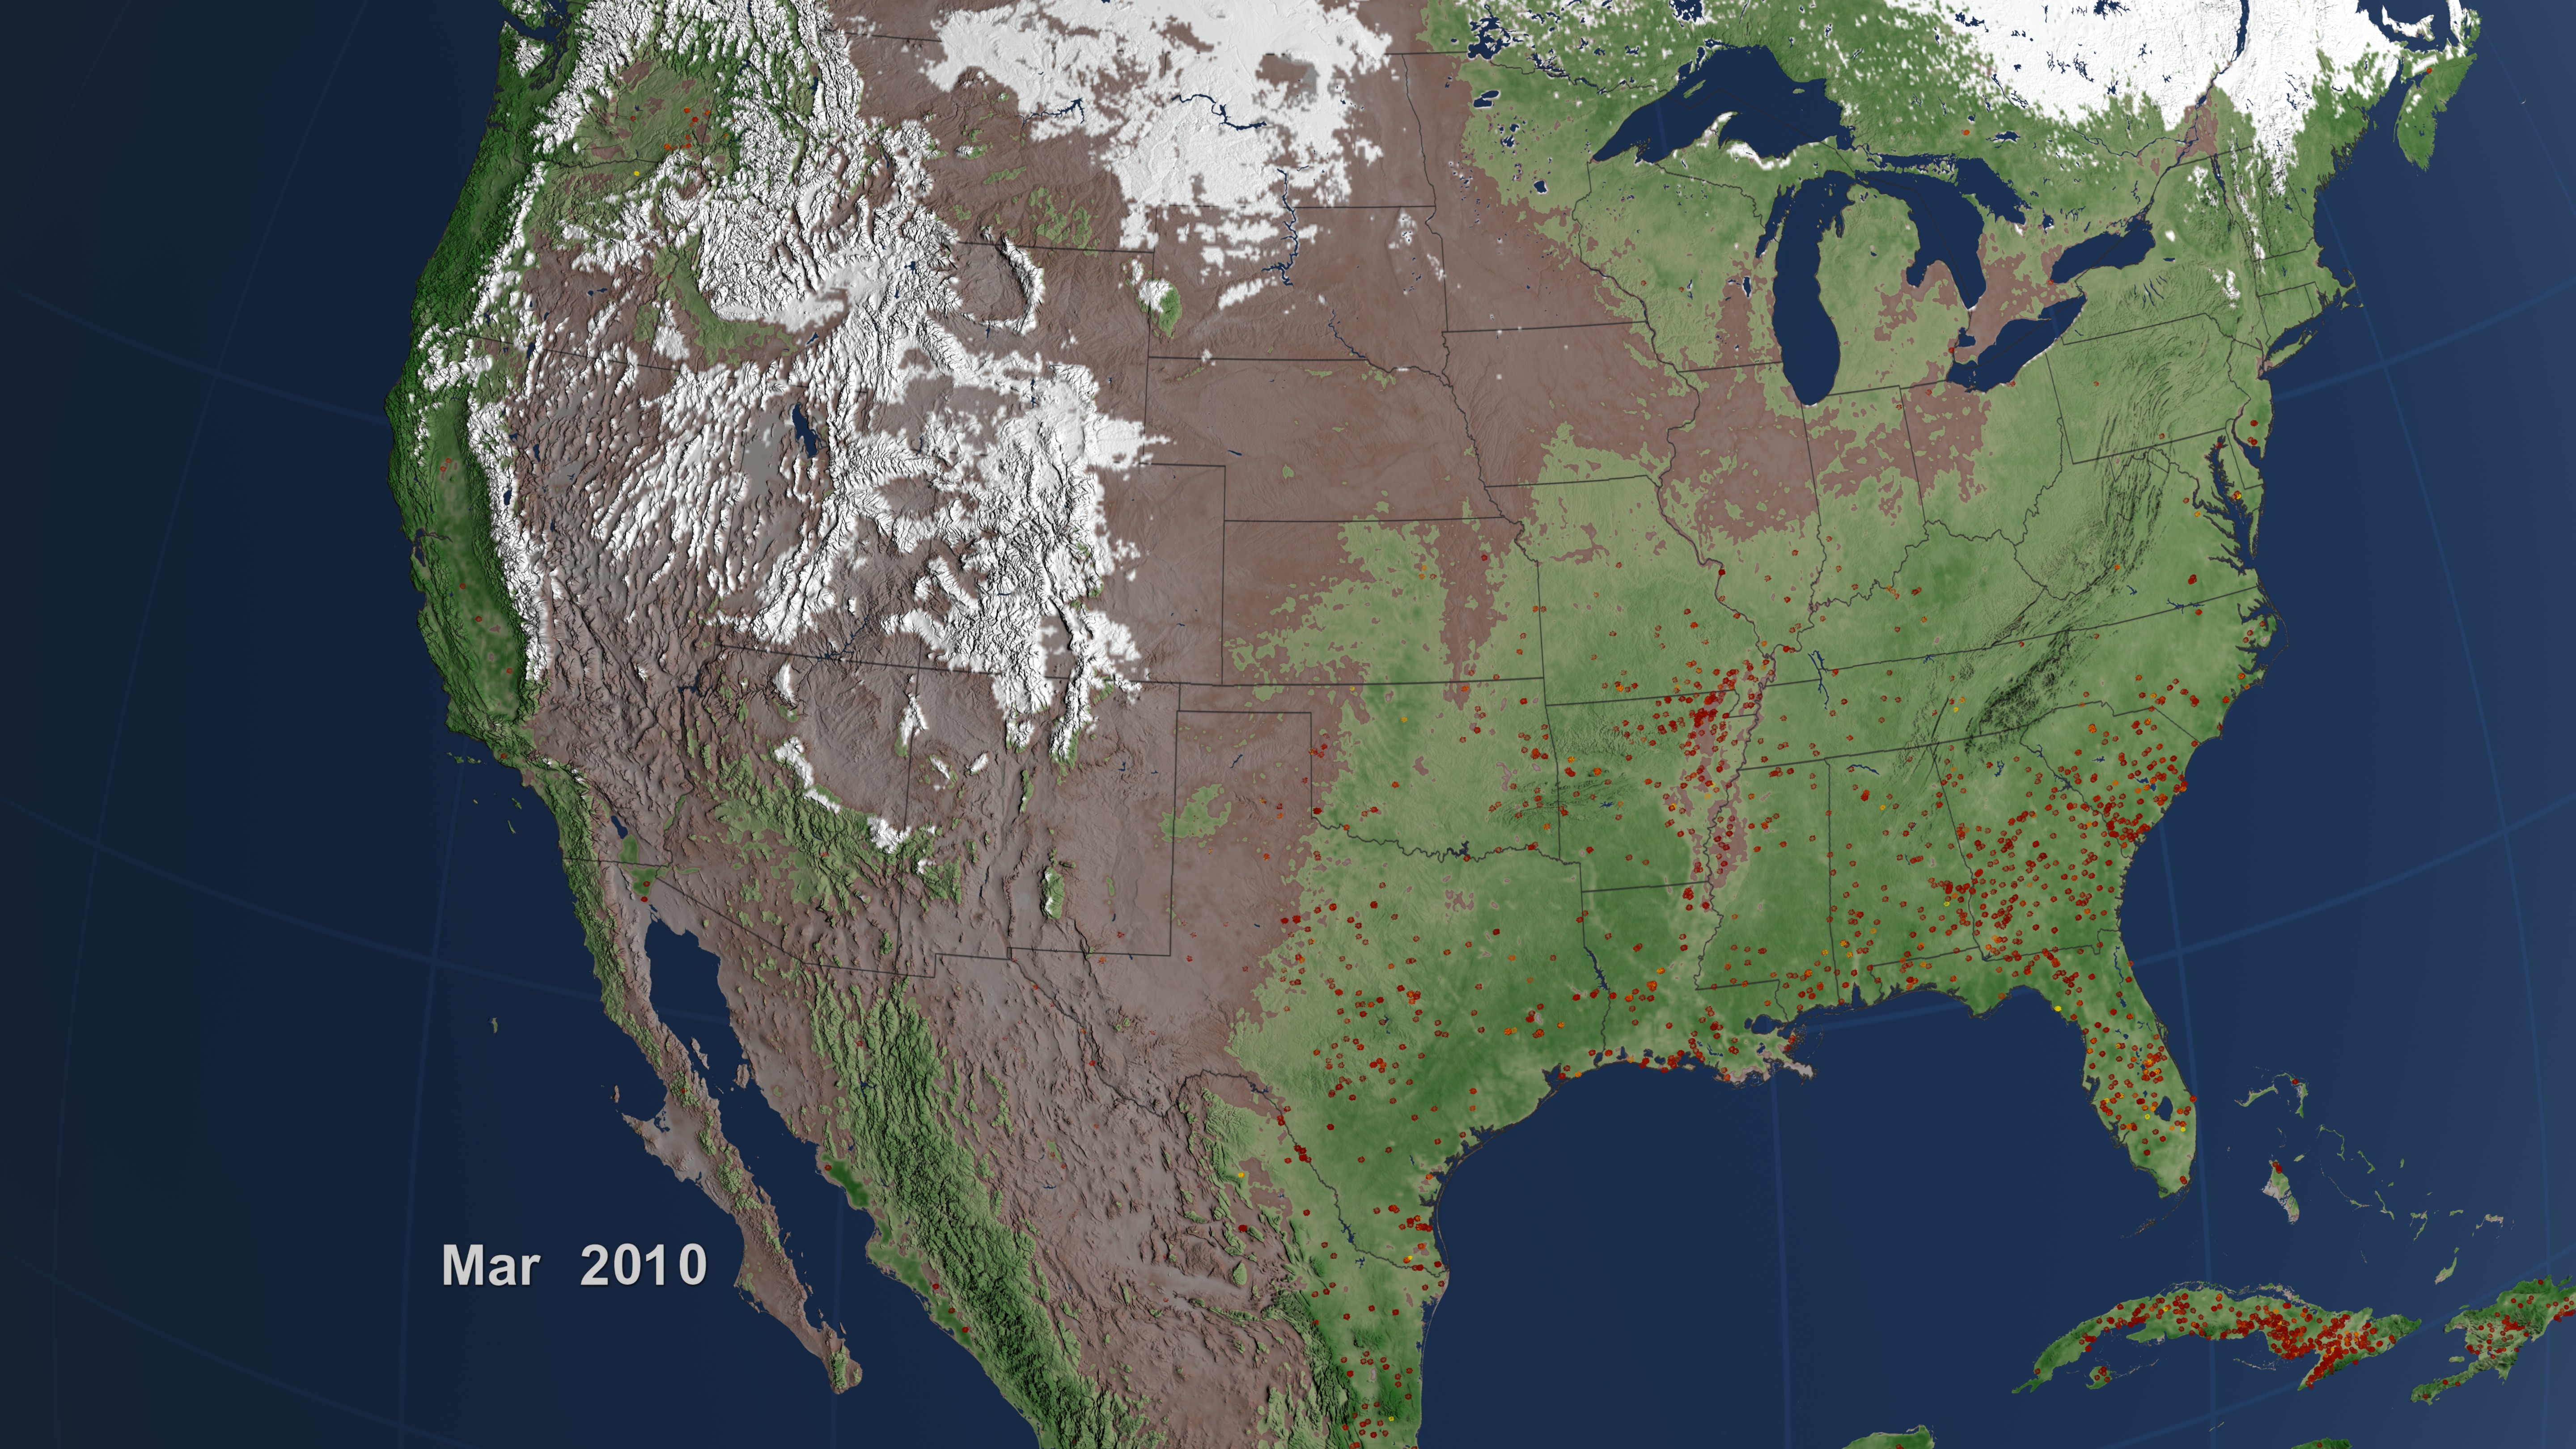
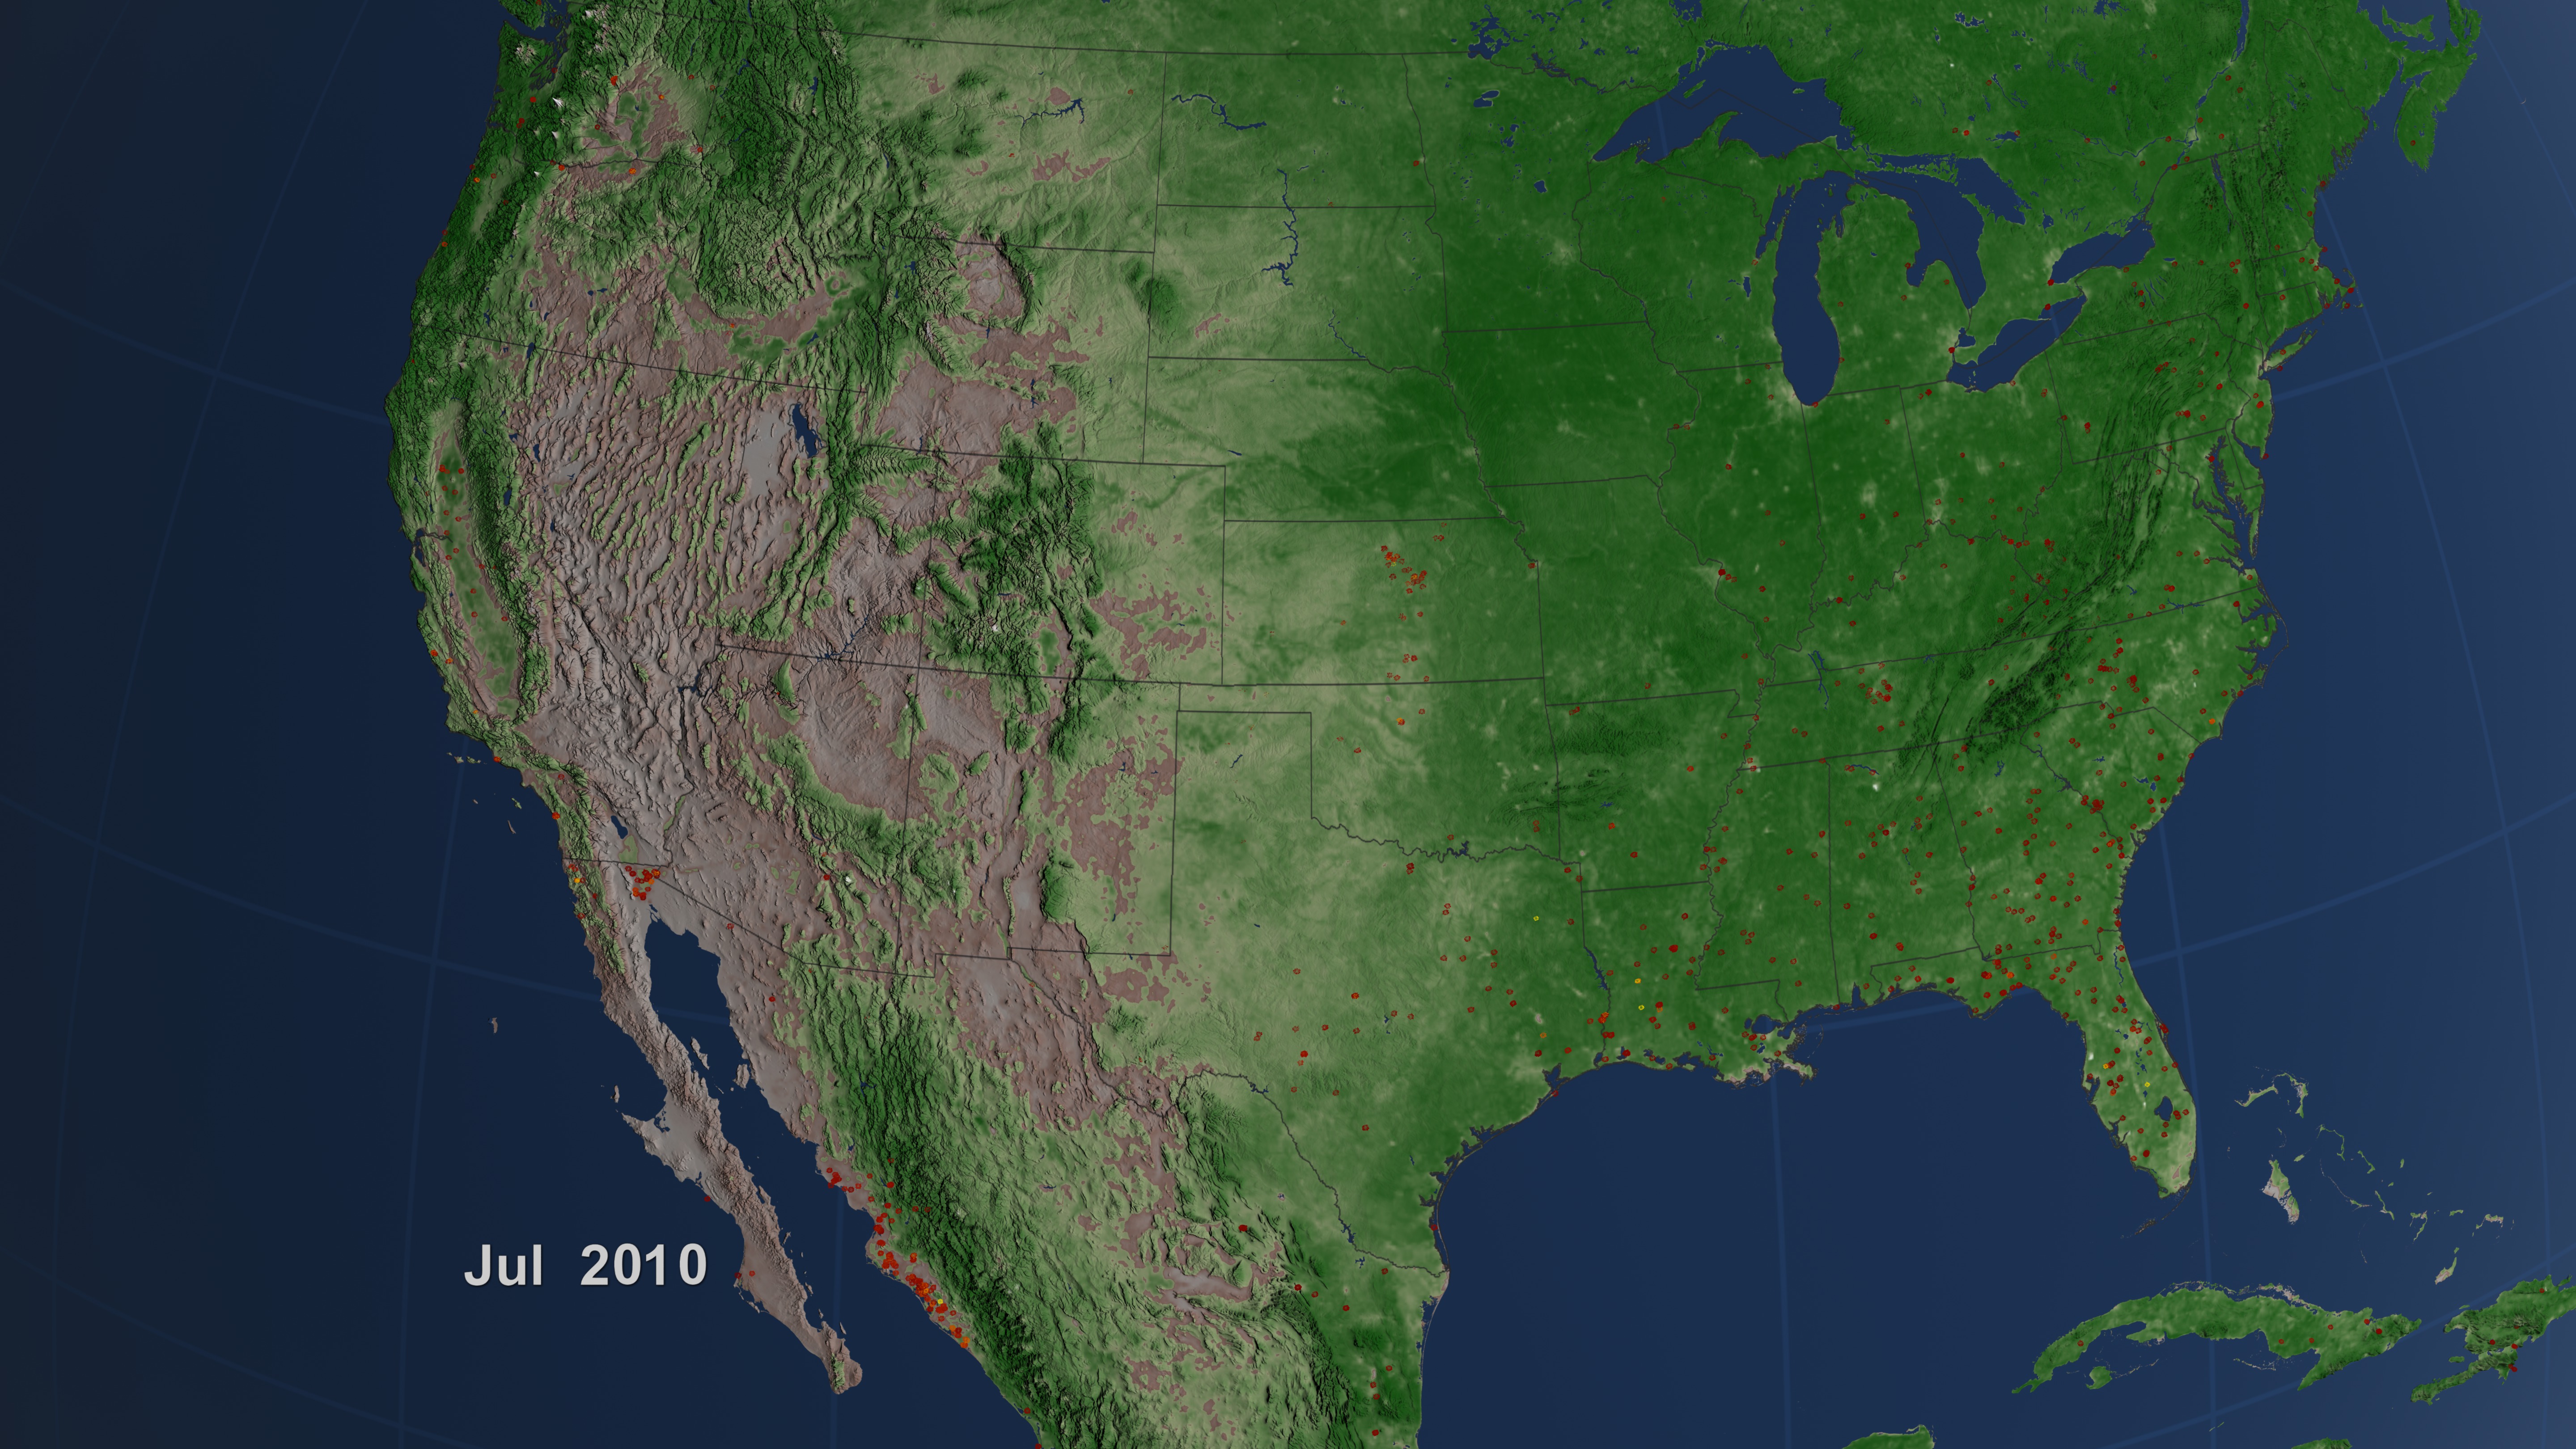
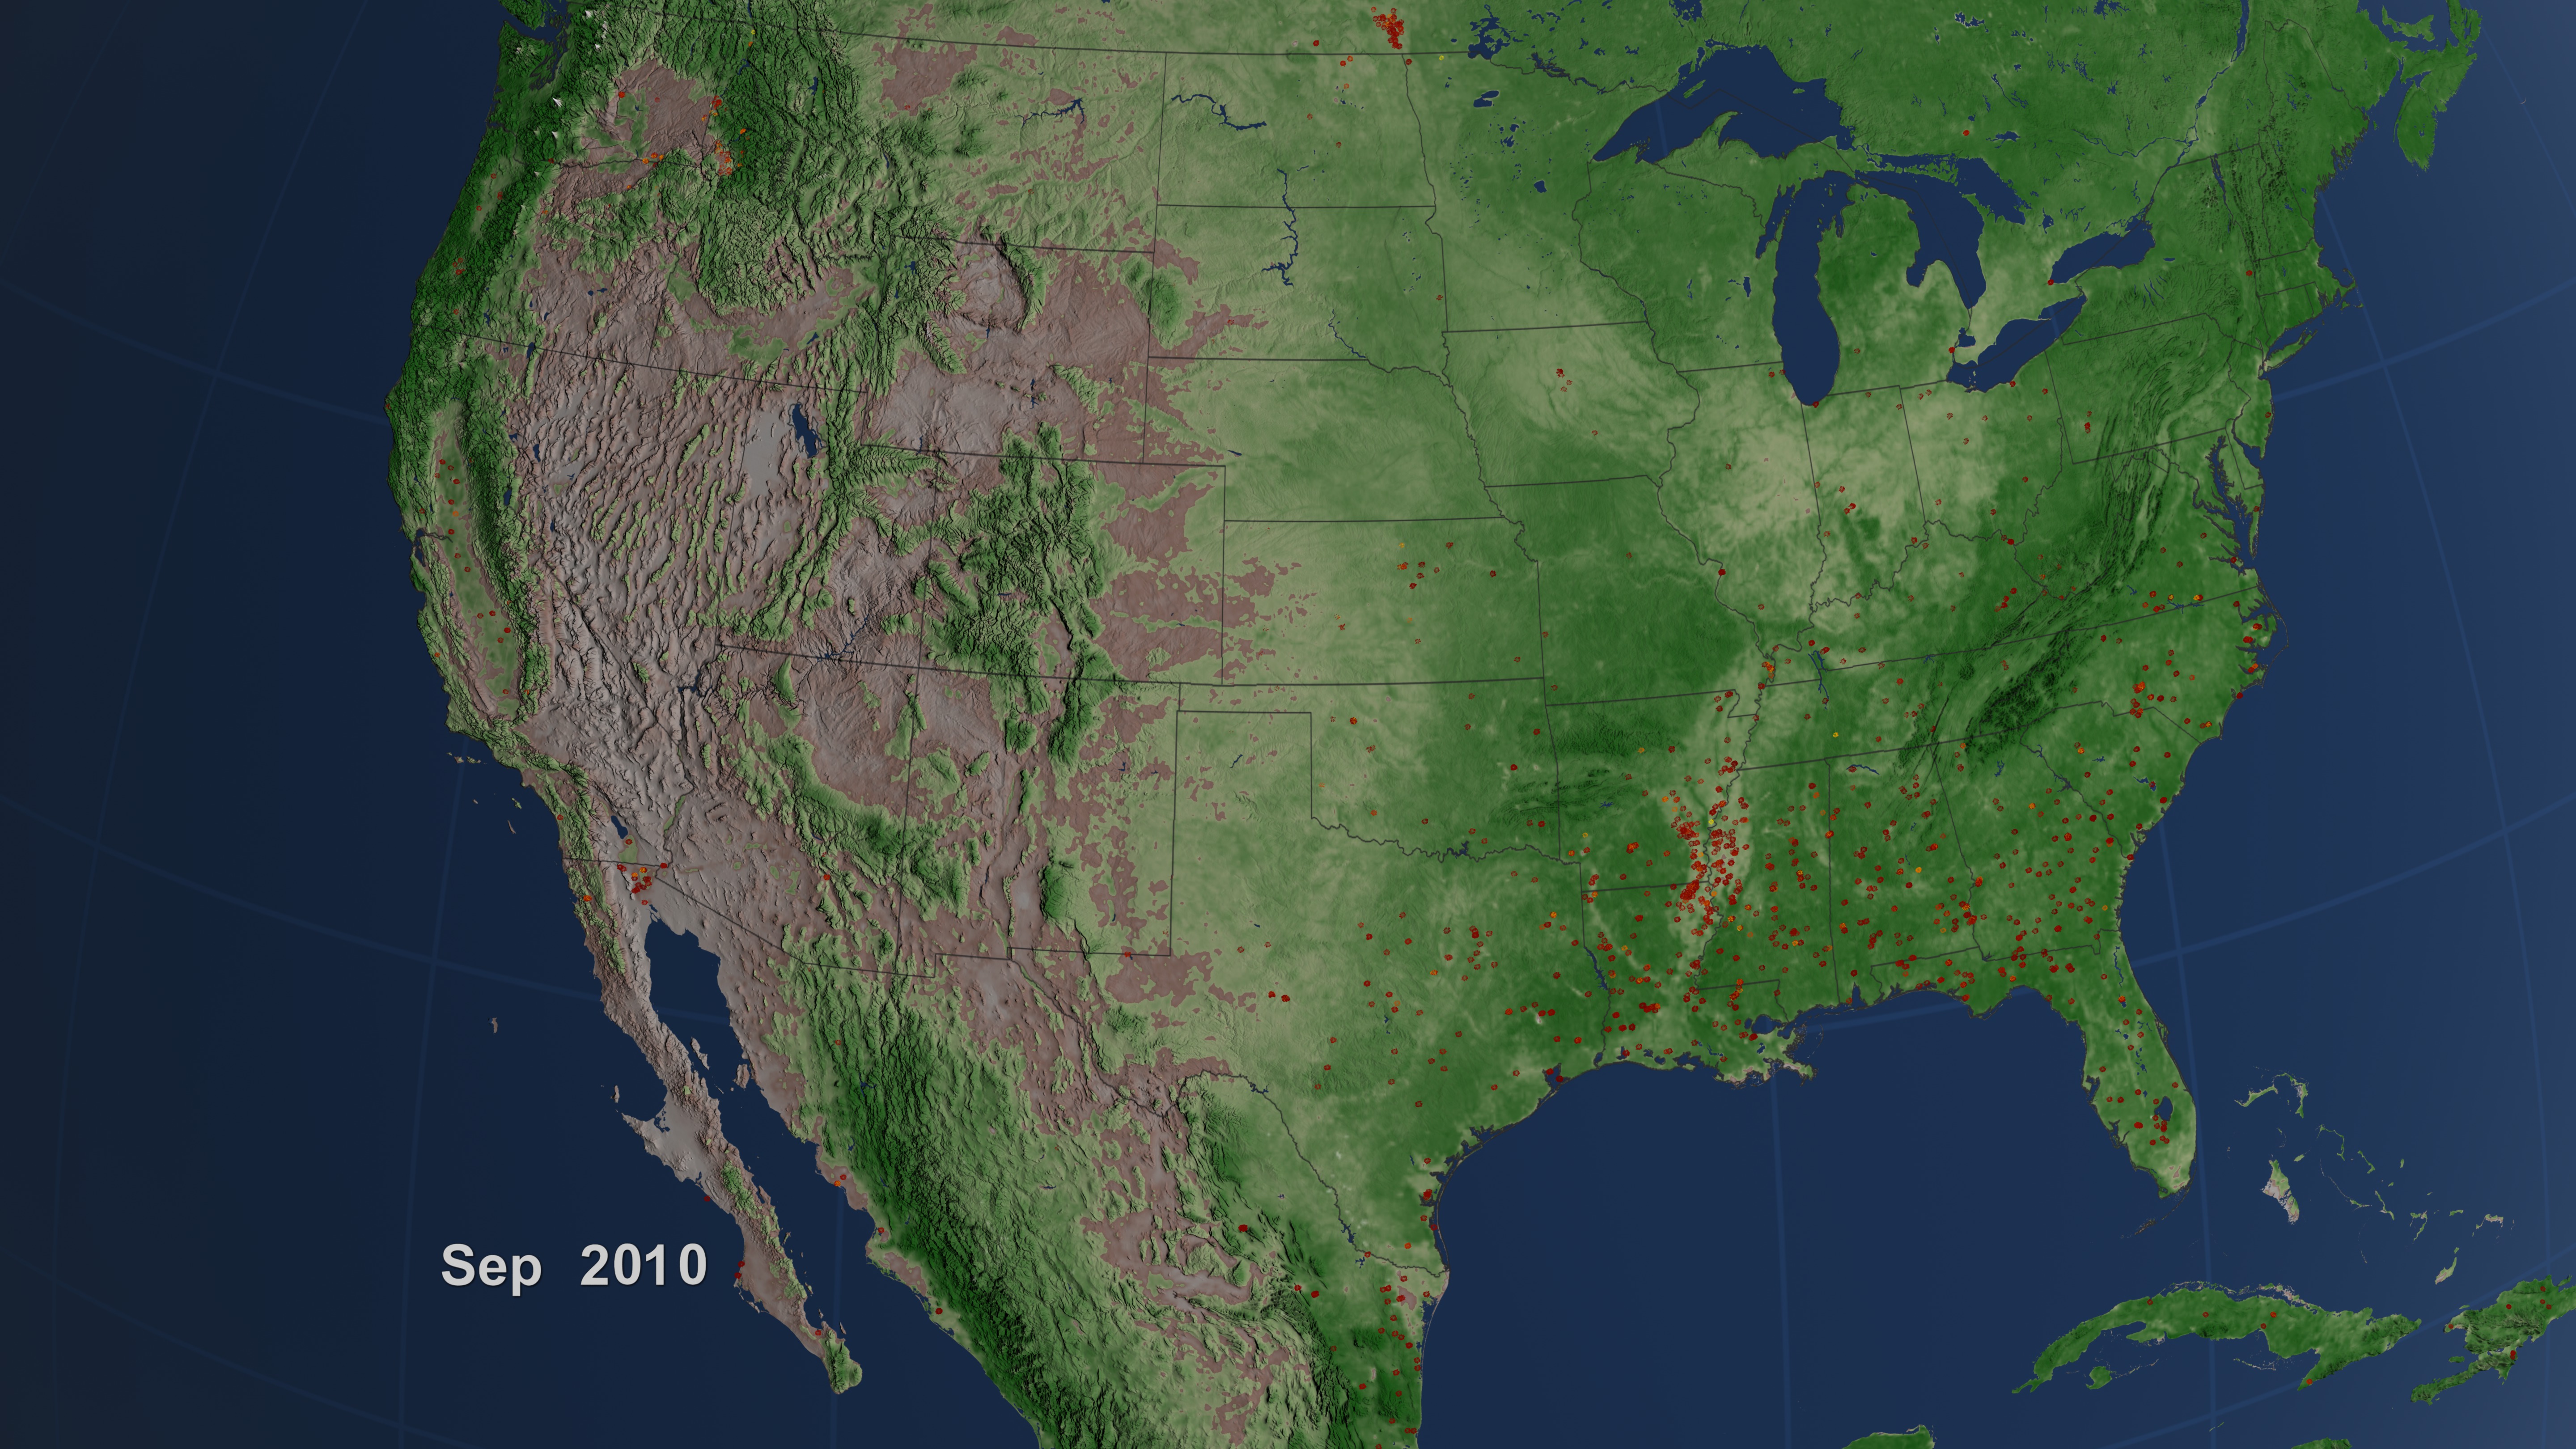
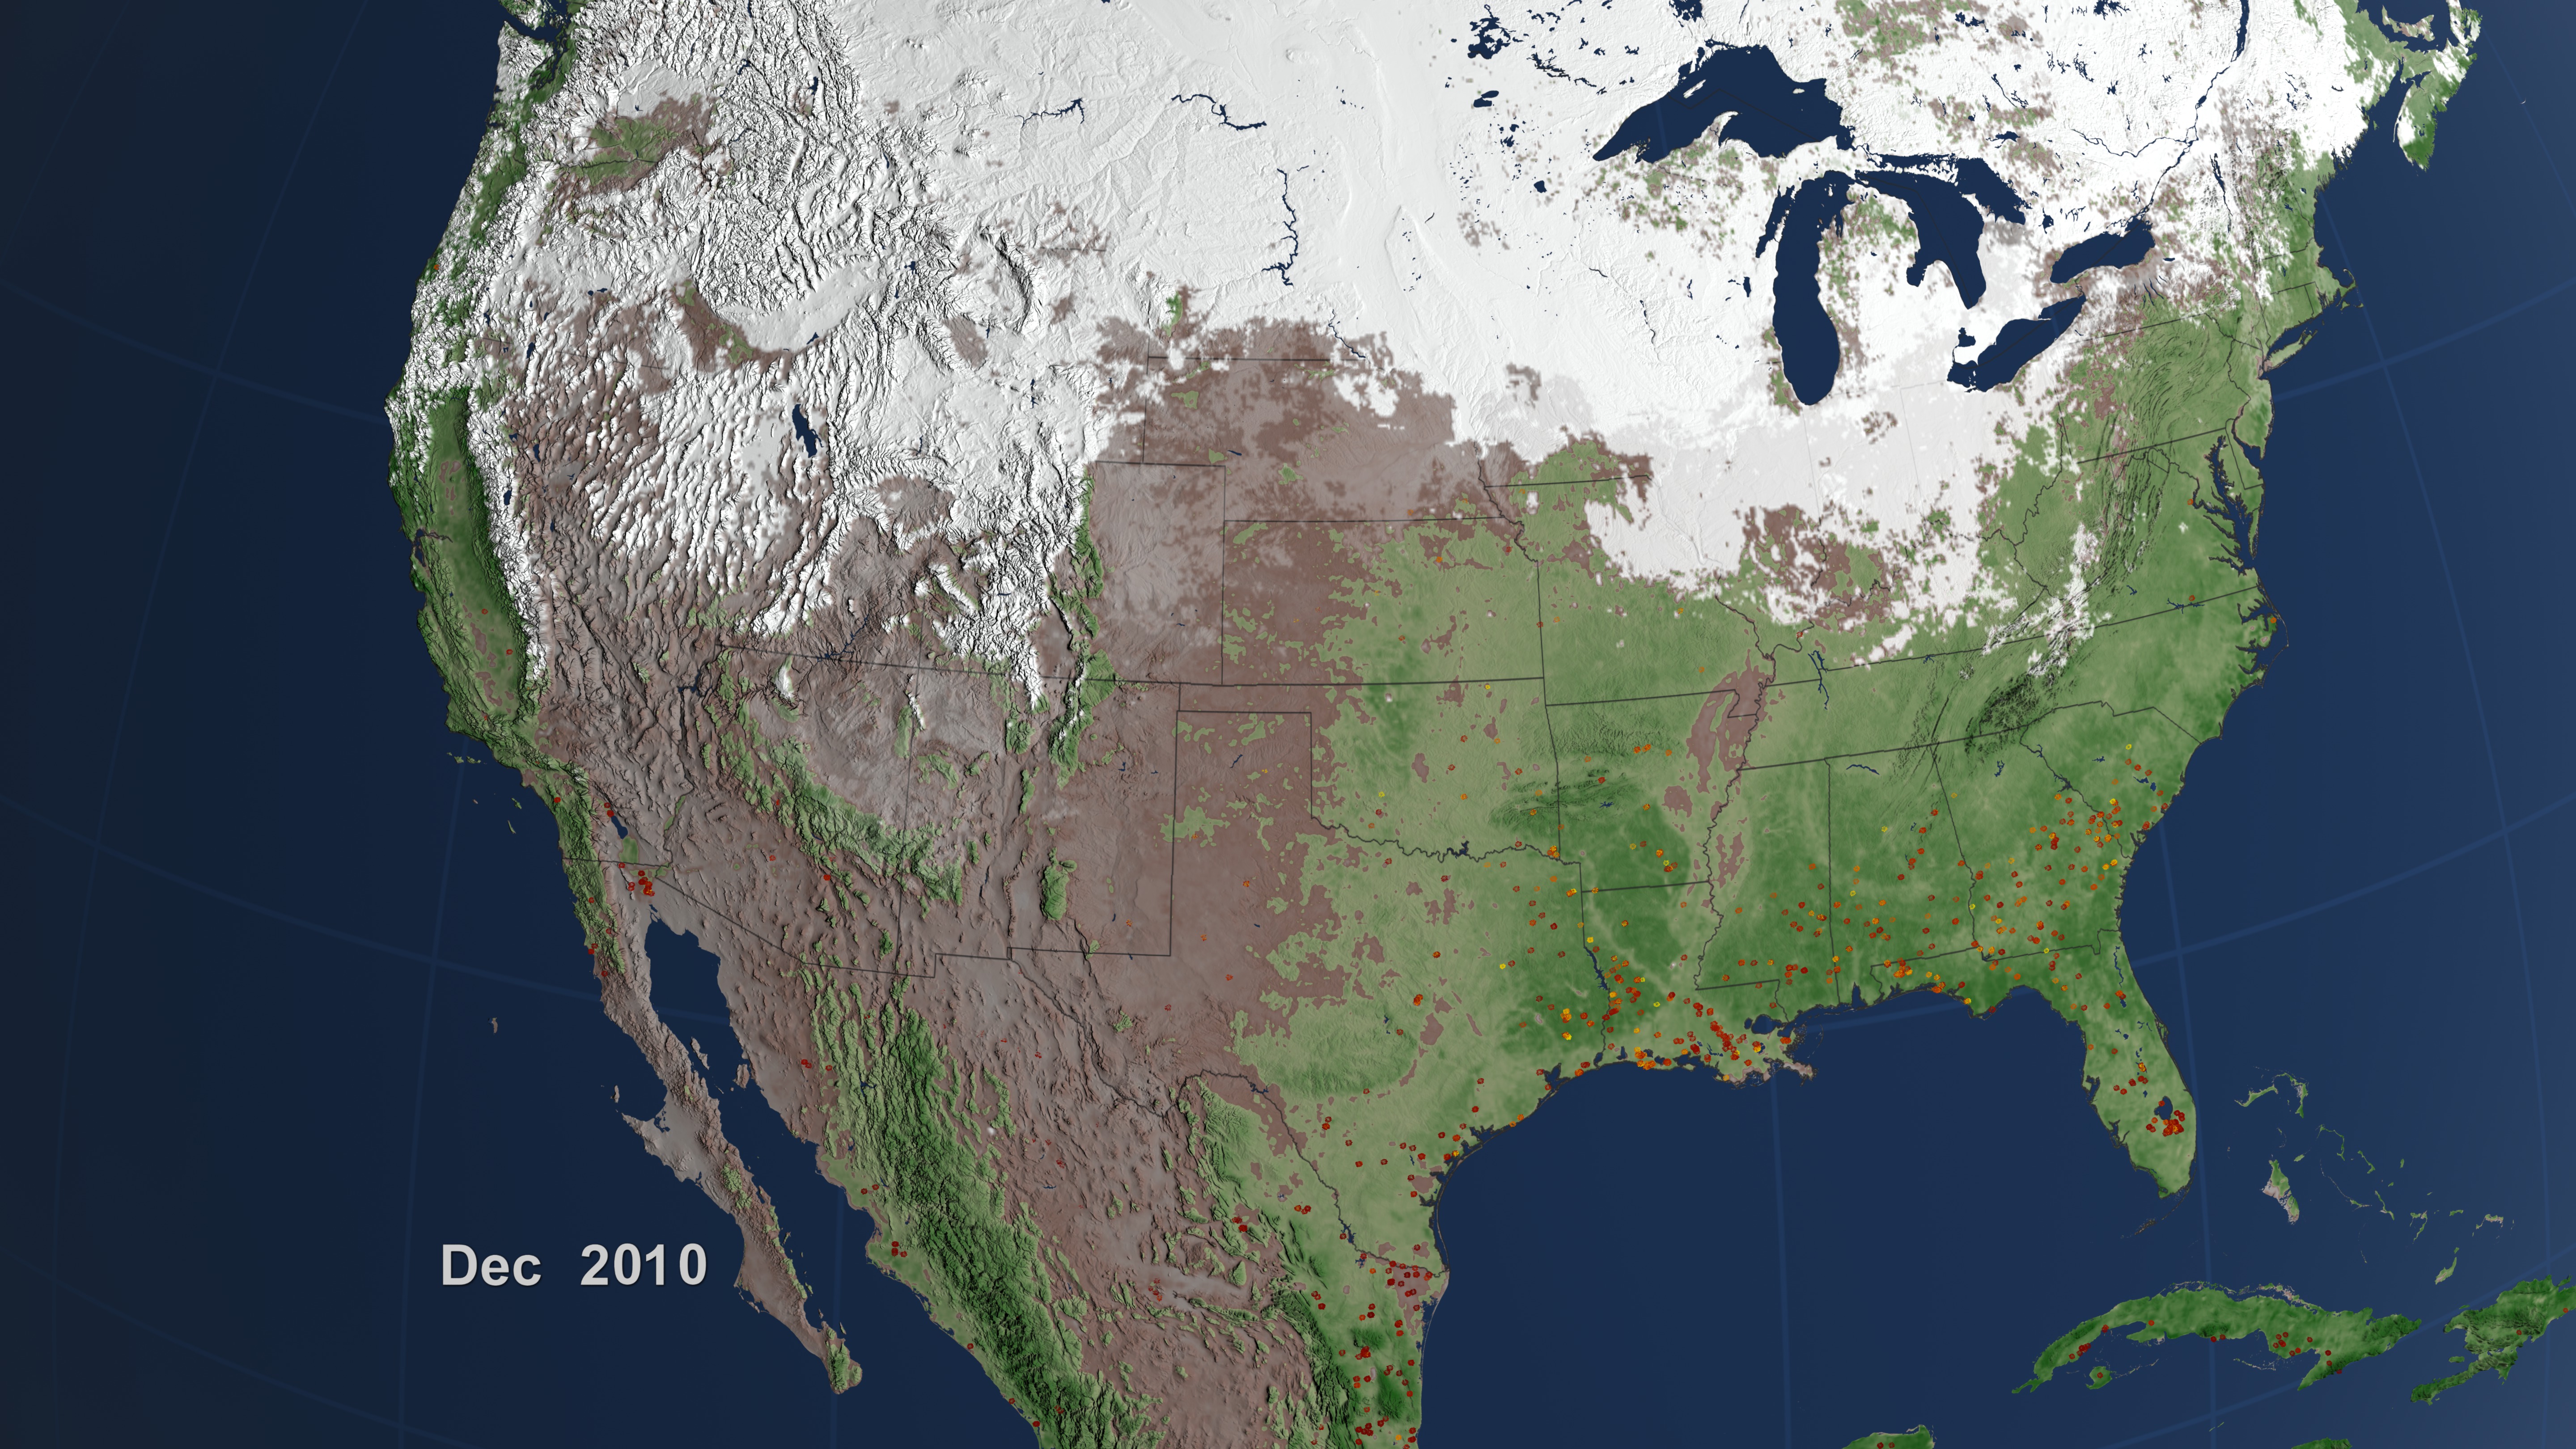
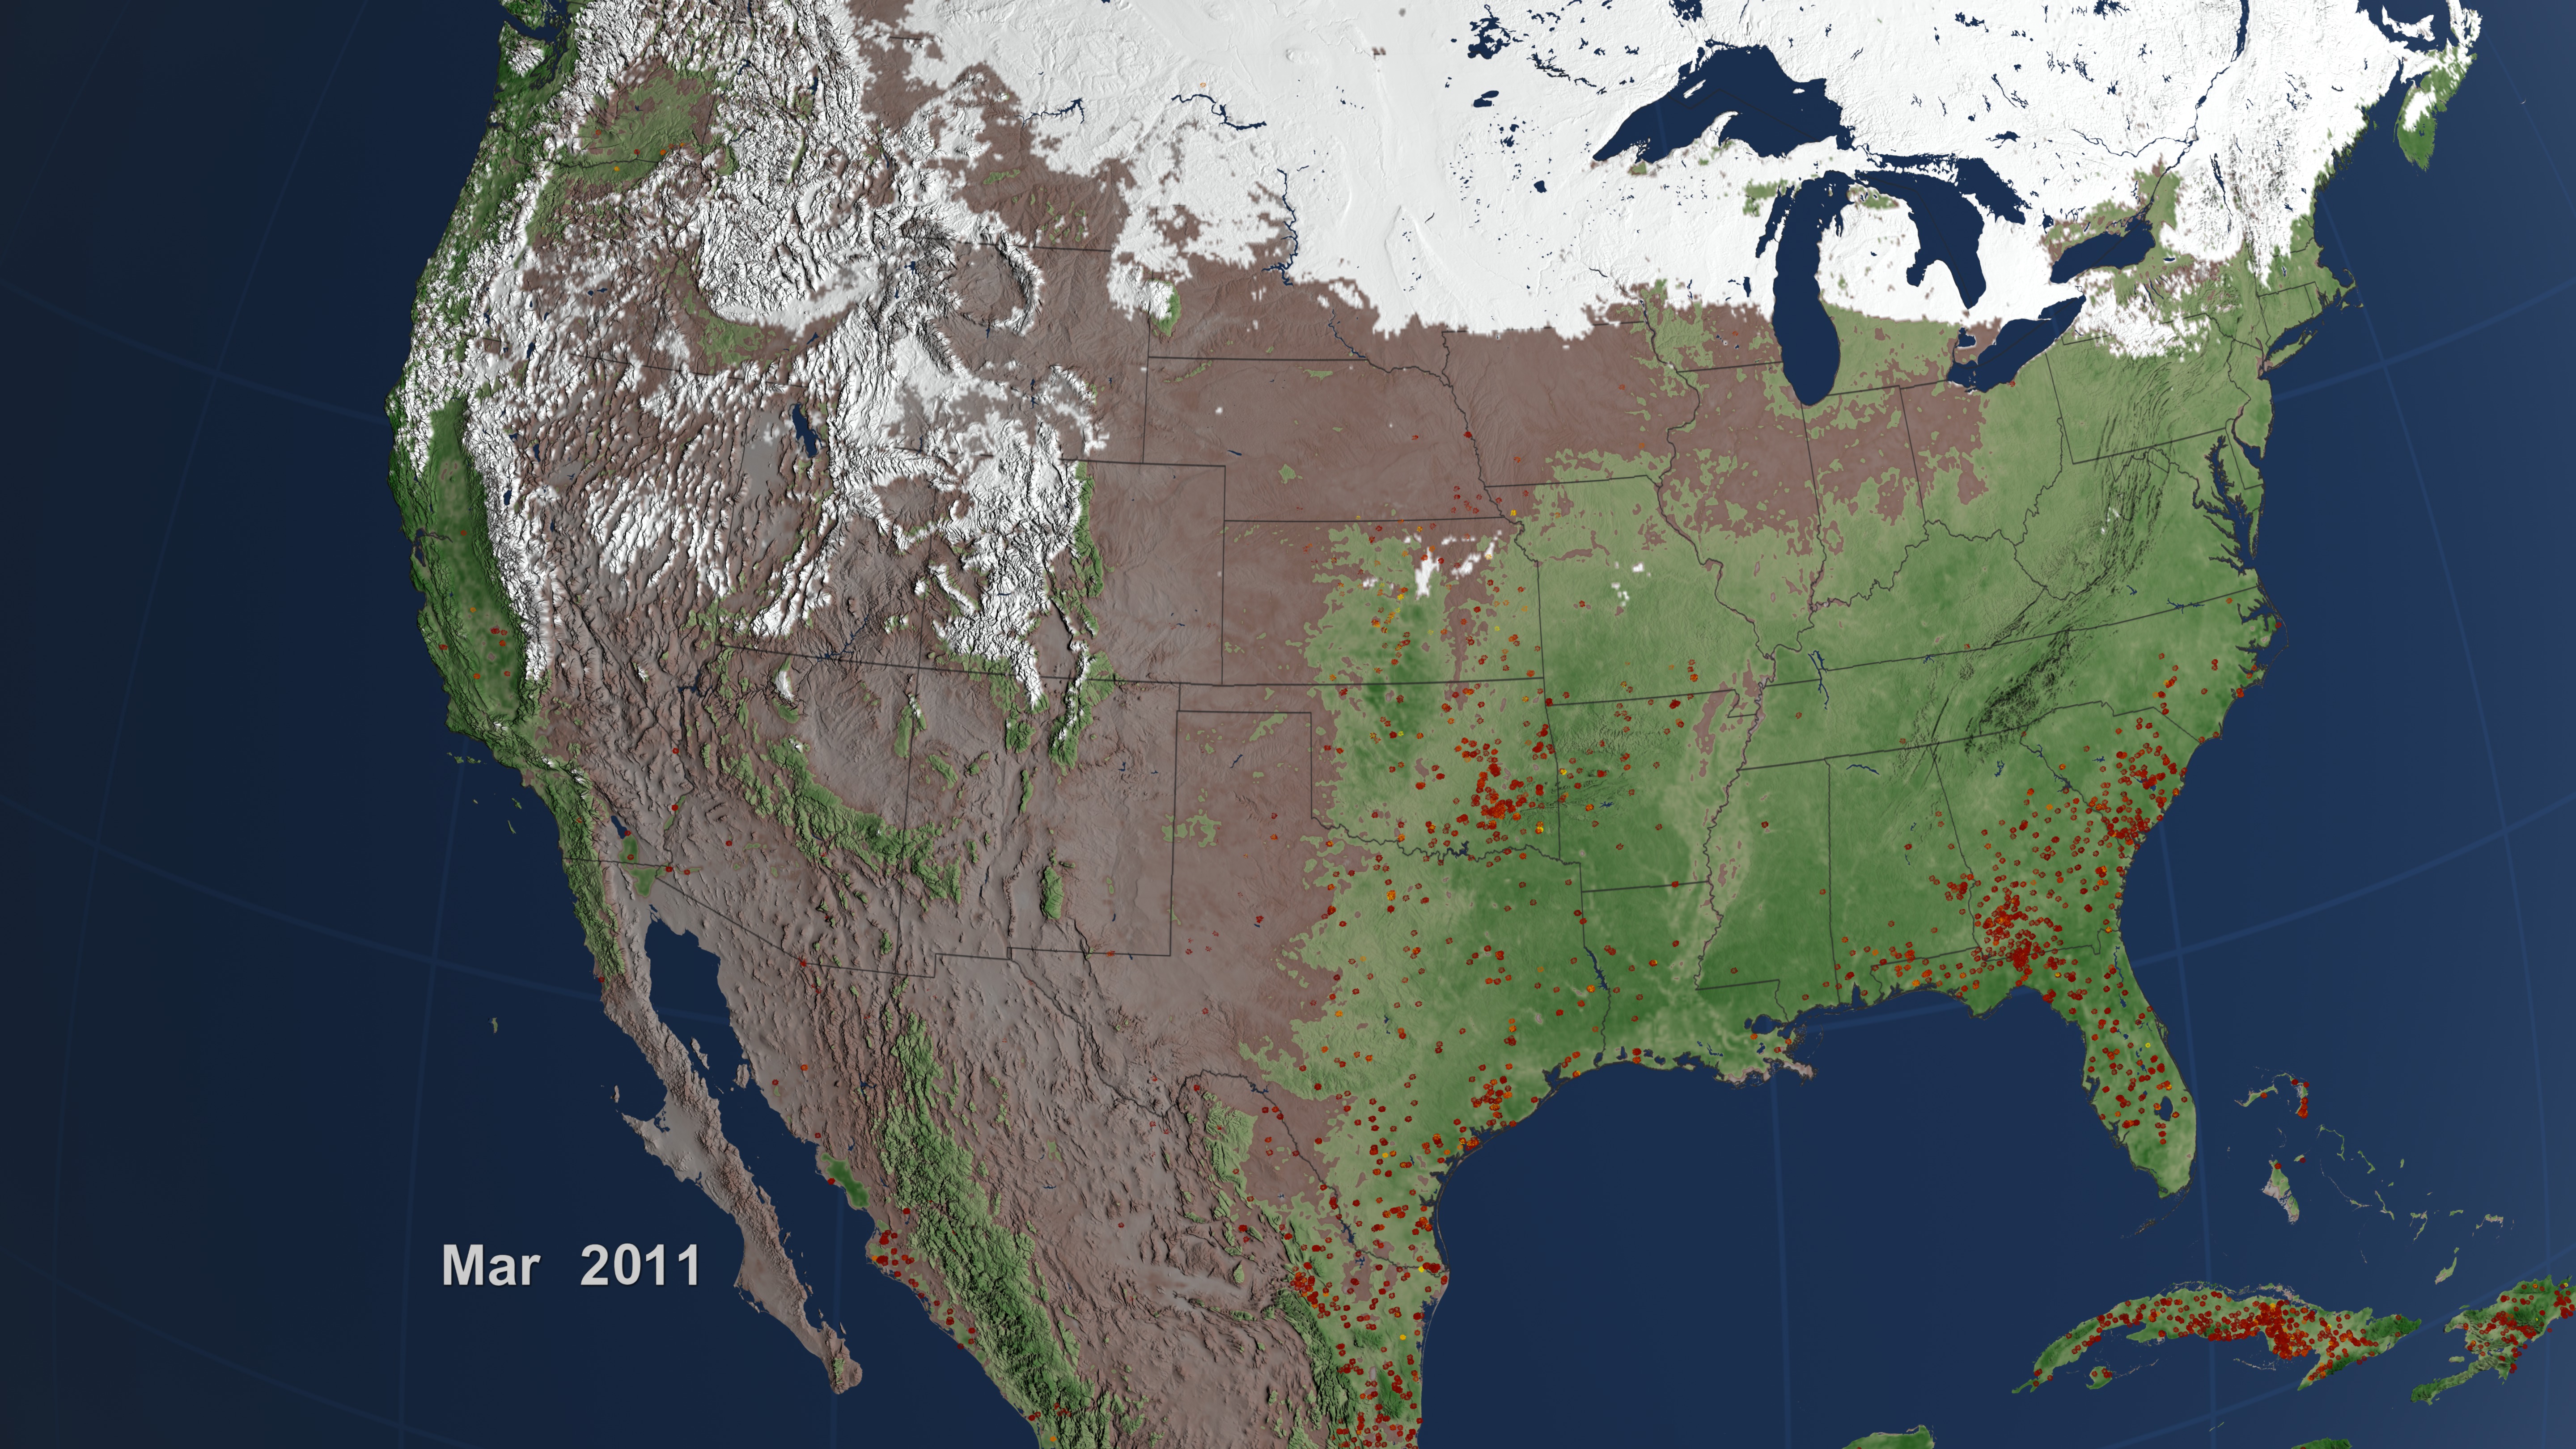
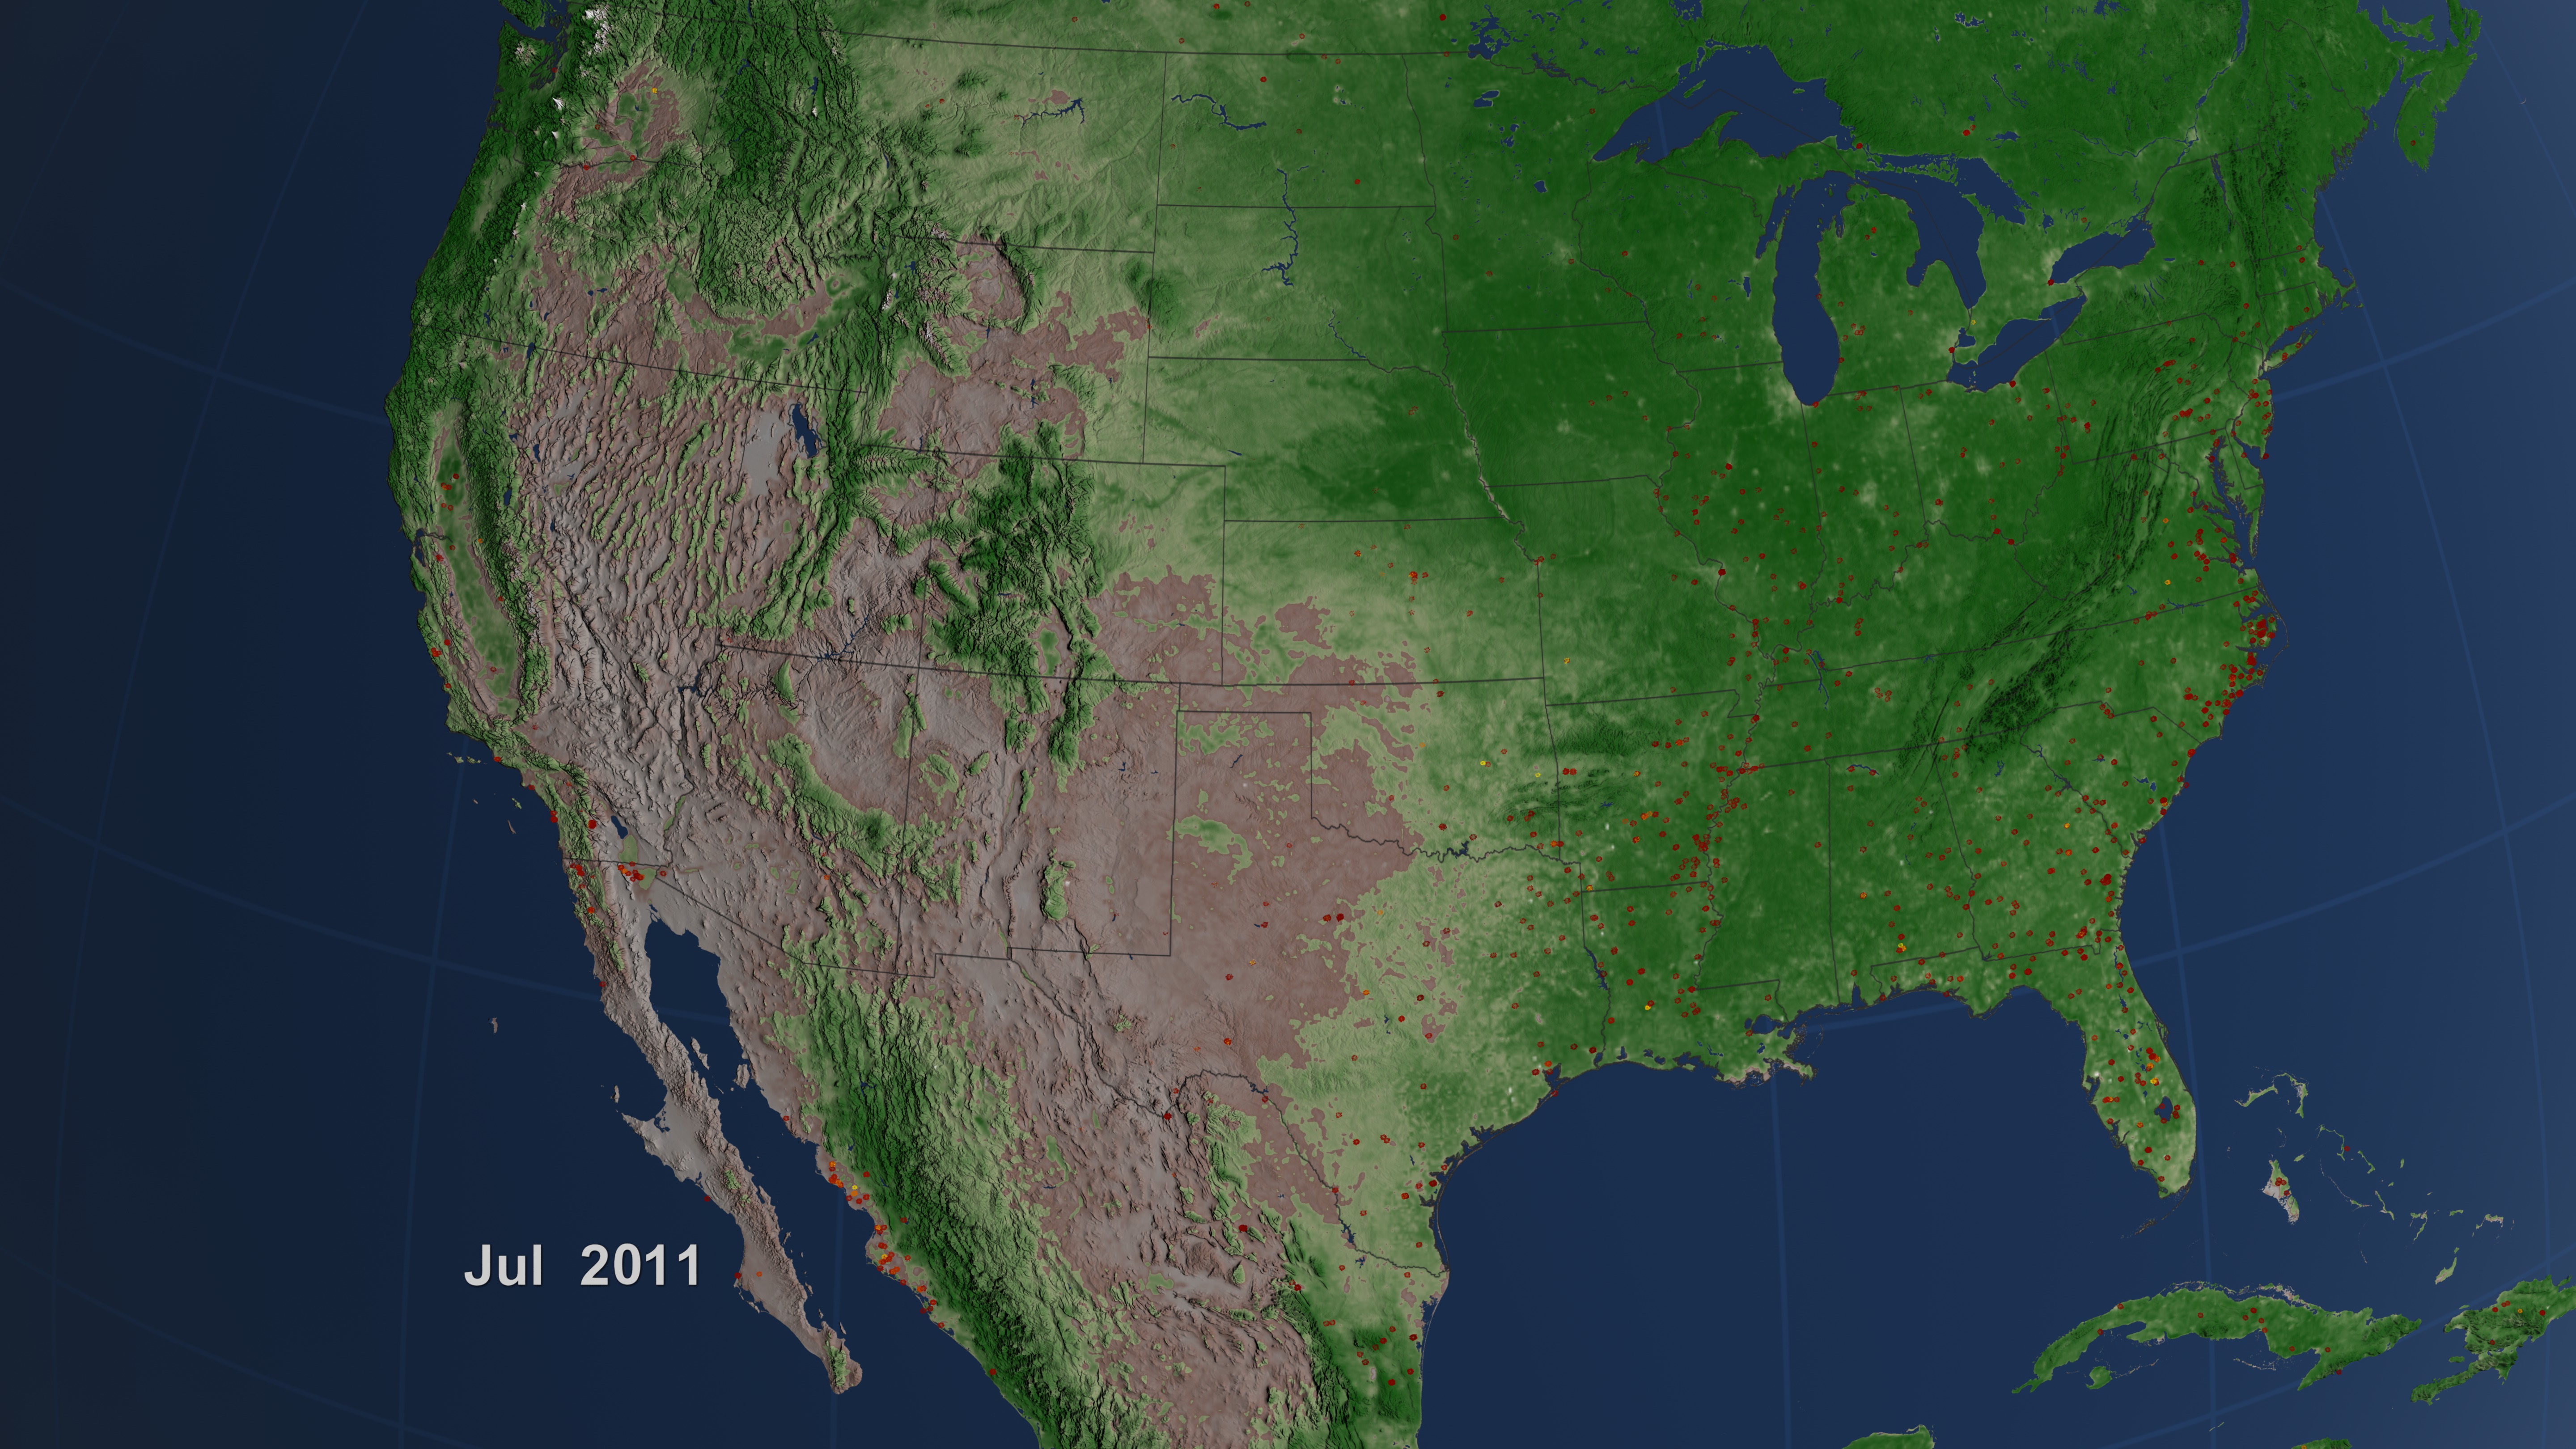
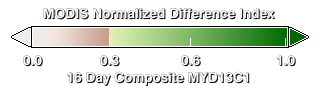
United States Fire Observations and MODIS NDVI
More information on the Fire Information for Resource Management (FIRMS) is available at http://maps.geog.umd.edu/firms/.
Related
Visualization Credits
Lori Perkins (NASA/GSFC): Lead Animator
Greg Shirah (NASA/GSFC): Animator
Kayvon Sharghi (USRA): Producer
Chris Justice (University of Maryland): Scientist
Louis Giglio (SSAI): Scientist
Luigi Boschetti Ph.D. (University Of Maryland College Park): Scientist
Adam P Voiland (Wyle Information Systems): Writer
Greg Shirah (NASA/GSFC): Animator
Kayvon Sharghi (USRA): Producer
Chris Justice (University of Maryland): Scientist
Louis Giglio (SSAI): Scientist
Luigi Boschetti Ph.D. (University Of Maryland College Park): Scientist
Adam P Voiland (Wyle Information Systems): Writer
Please give credit for this item to:
NASA/Goddard Space Flight Center Scientific Visualization Studio
NASA/Goddard Space Flight Center Scientific Visualization Studio
Short URL to share this page:
https://svs.gsfc.nasa.gov/3873
Mission:
Terra
Data Used:
Note: While we identify the data sets used in these visualizations, we do not store any further details nor the data sets themselves on our site.
Dates of Data Used:
2002/07/01 - 2011/07/30
This item is part of these series:
Fires
Multisensor Fire Observations
NDVI
Agriculture Animations - Fires
Keywords:
DLESE >> Atmospheric science
DLESE >> Forestry
SVS >> HDTV
DLESE >> Natural hazards
GCMD >> Earth Science >> Biosphere >> Ecological Dynamics >> Fire Occurrence
GCMD >> Earth Science >> Human Dimensions >> Natural Hazards >> Fires
SVS >> For Educators
SVS >> Ecosystems
SVS >> Natural Disaster
NASA Science >> Earth
NASA Earth Science Focus Areas >> Carbon Cycle and Ecosystems
GCMD keywords can be found on the Internet with the following citation: Olsen, L.M., G. Major, K. Shein, J. Scialdone, S. Ritz, T. Stevens, M. Morahan, A. Aleman, R. Vogel, S. Leicester, H. Weir, M. Meaux, S. Grebas, C.Solomon, M. Holland, T. Northcutt, R. A. Restrepo, R. Bilodeau, 2013. NASA/Global Change Master Directory (GCMD) Earth Science Keywords. Version 8.0.0.0.0
https://svs.gsfc.nasa.gov/3873
Mission:
Terra
Data Used:
Terra and Aqua/MODIS/Fire Location
Credit:
Fire location data courtesy of MODIS Rapid Response Project (NASA/GSFC and University of Maryland - http://rapidfire.sci.gsfc.nasa.gov)
Fire location data courtesy of MODIS Rapid Response Project (NASA/GSFC and University of Maryland - http://rapidfire.sci.gsfc.nasa.gov)
Terra and Aqua/MODIS/Normalized Difference Vegetation Index (NDVI) also referred to as: NDVI
NASADates of Data Used:
2002/07/01 - 2011/07/30
This item is part of these series:
Fires
Multisensor Fire Observations
NDVI
Agriculture Animations - Fires
Keywords:
DLESE >> Atmospheric science
DLESE >> Forestry
SVS >> HDTV
DLESE >> Natural hazards
GCMD >> Earth Science >> Biosphere >> Ecological Dynamics >> Fire Occurrence
GCMD >> Earth Science >> Human Dimensions >> Natural Hazards >> Fires
SVS >> For Educators
SVS >> Ecosystems
SVS >> Natural Disaster
NASA Science >> Earth
NASA Earth Science Focus Areas >> Carbon Cycle and Ecosystems
GCMD keywords can be found on the Internet with the following citation: Olsen, L.M., G. Major, K. Shein, J. Scialdone, S. Ritz, T. Stevens, M. Morahan, A. Aleman, R. Vogel, S. Leicester, H. Weir, M. Meaux, S. Grebas, C.Solomon, M. Holland, T. Northcutt, R. A. Restrepo, R. Bilodeau, 2013. NASA/Global Change Master Directory (GCMD) Earth Science Keywords. Version 8.0.0.0.0


