Sun
ID: 3828
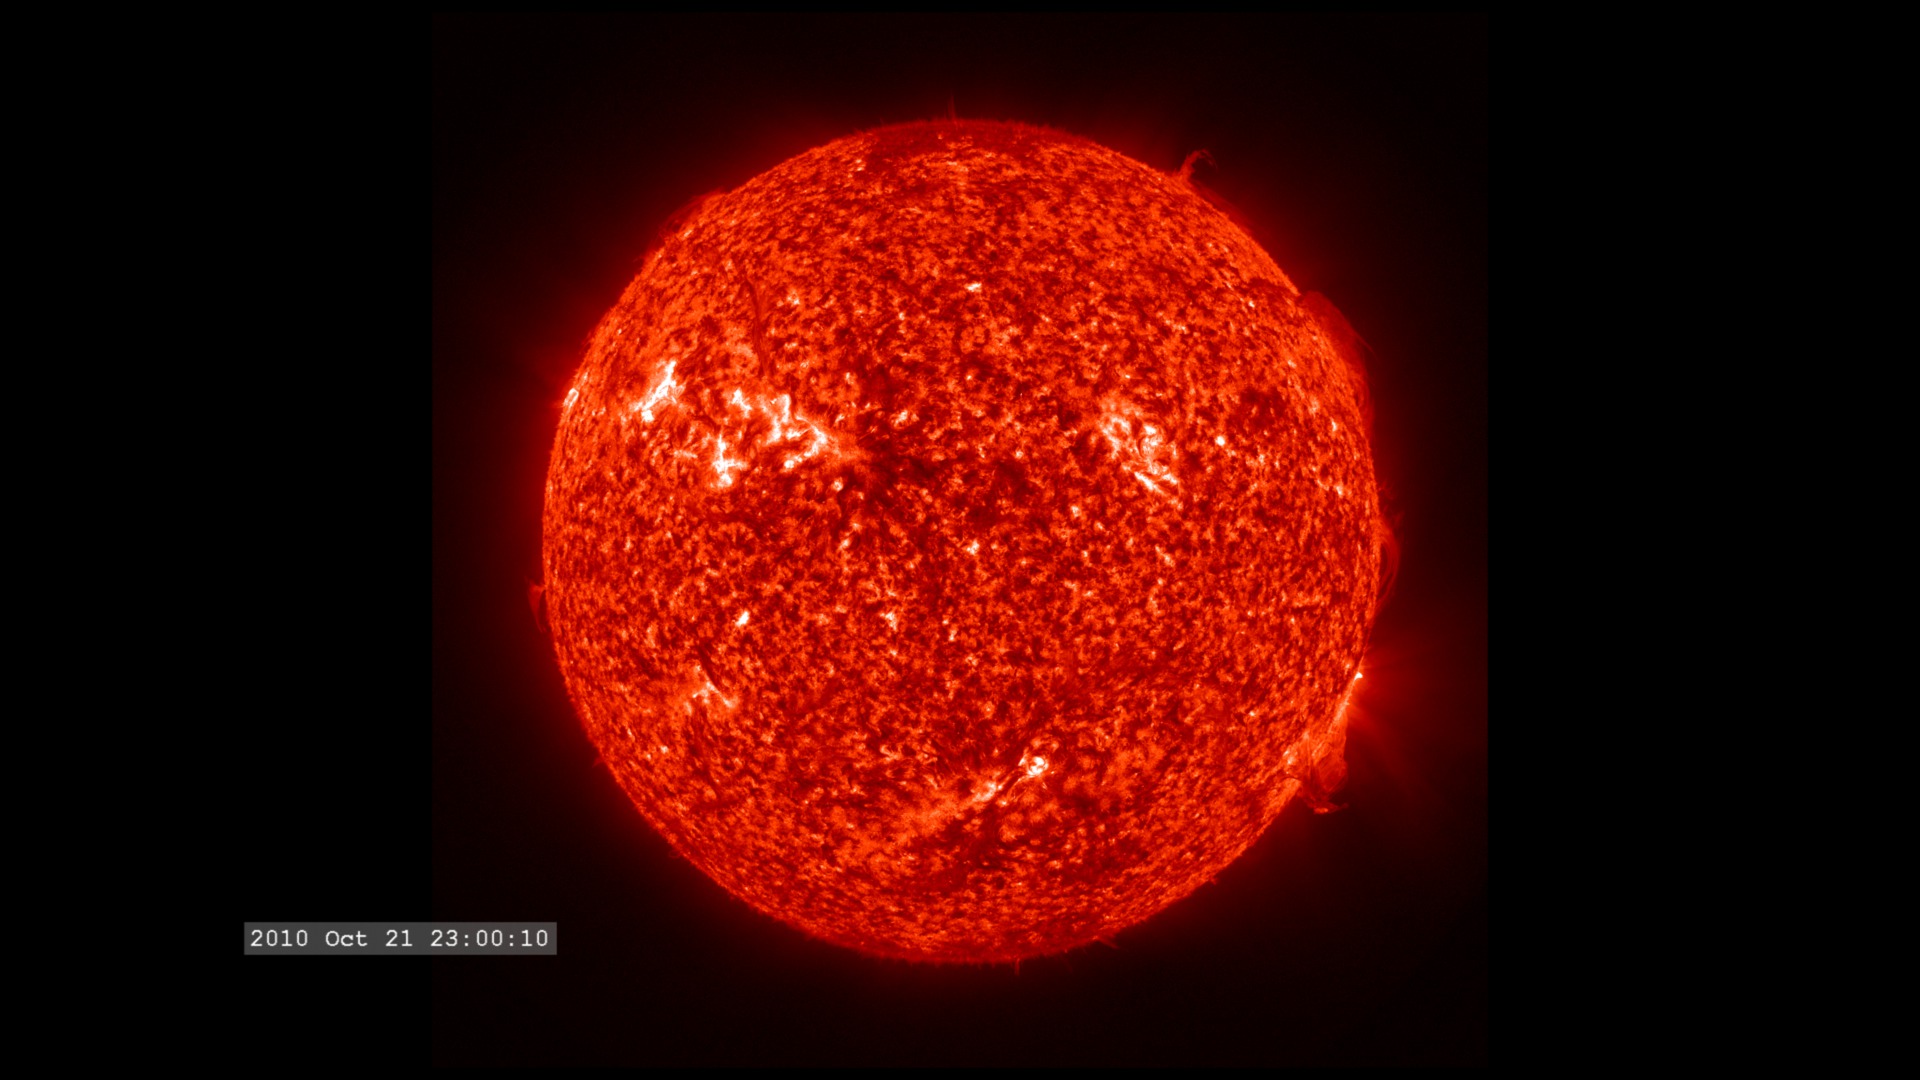
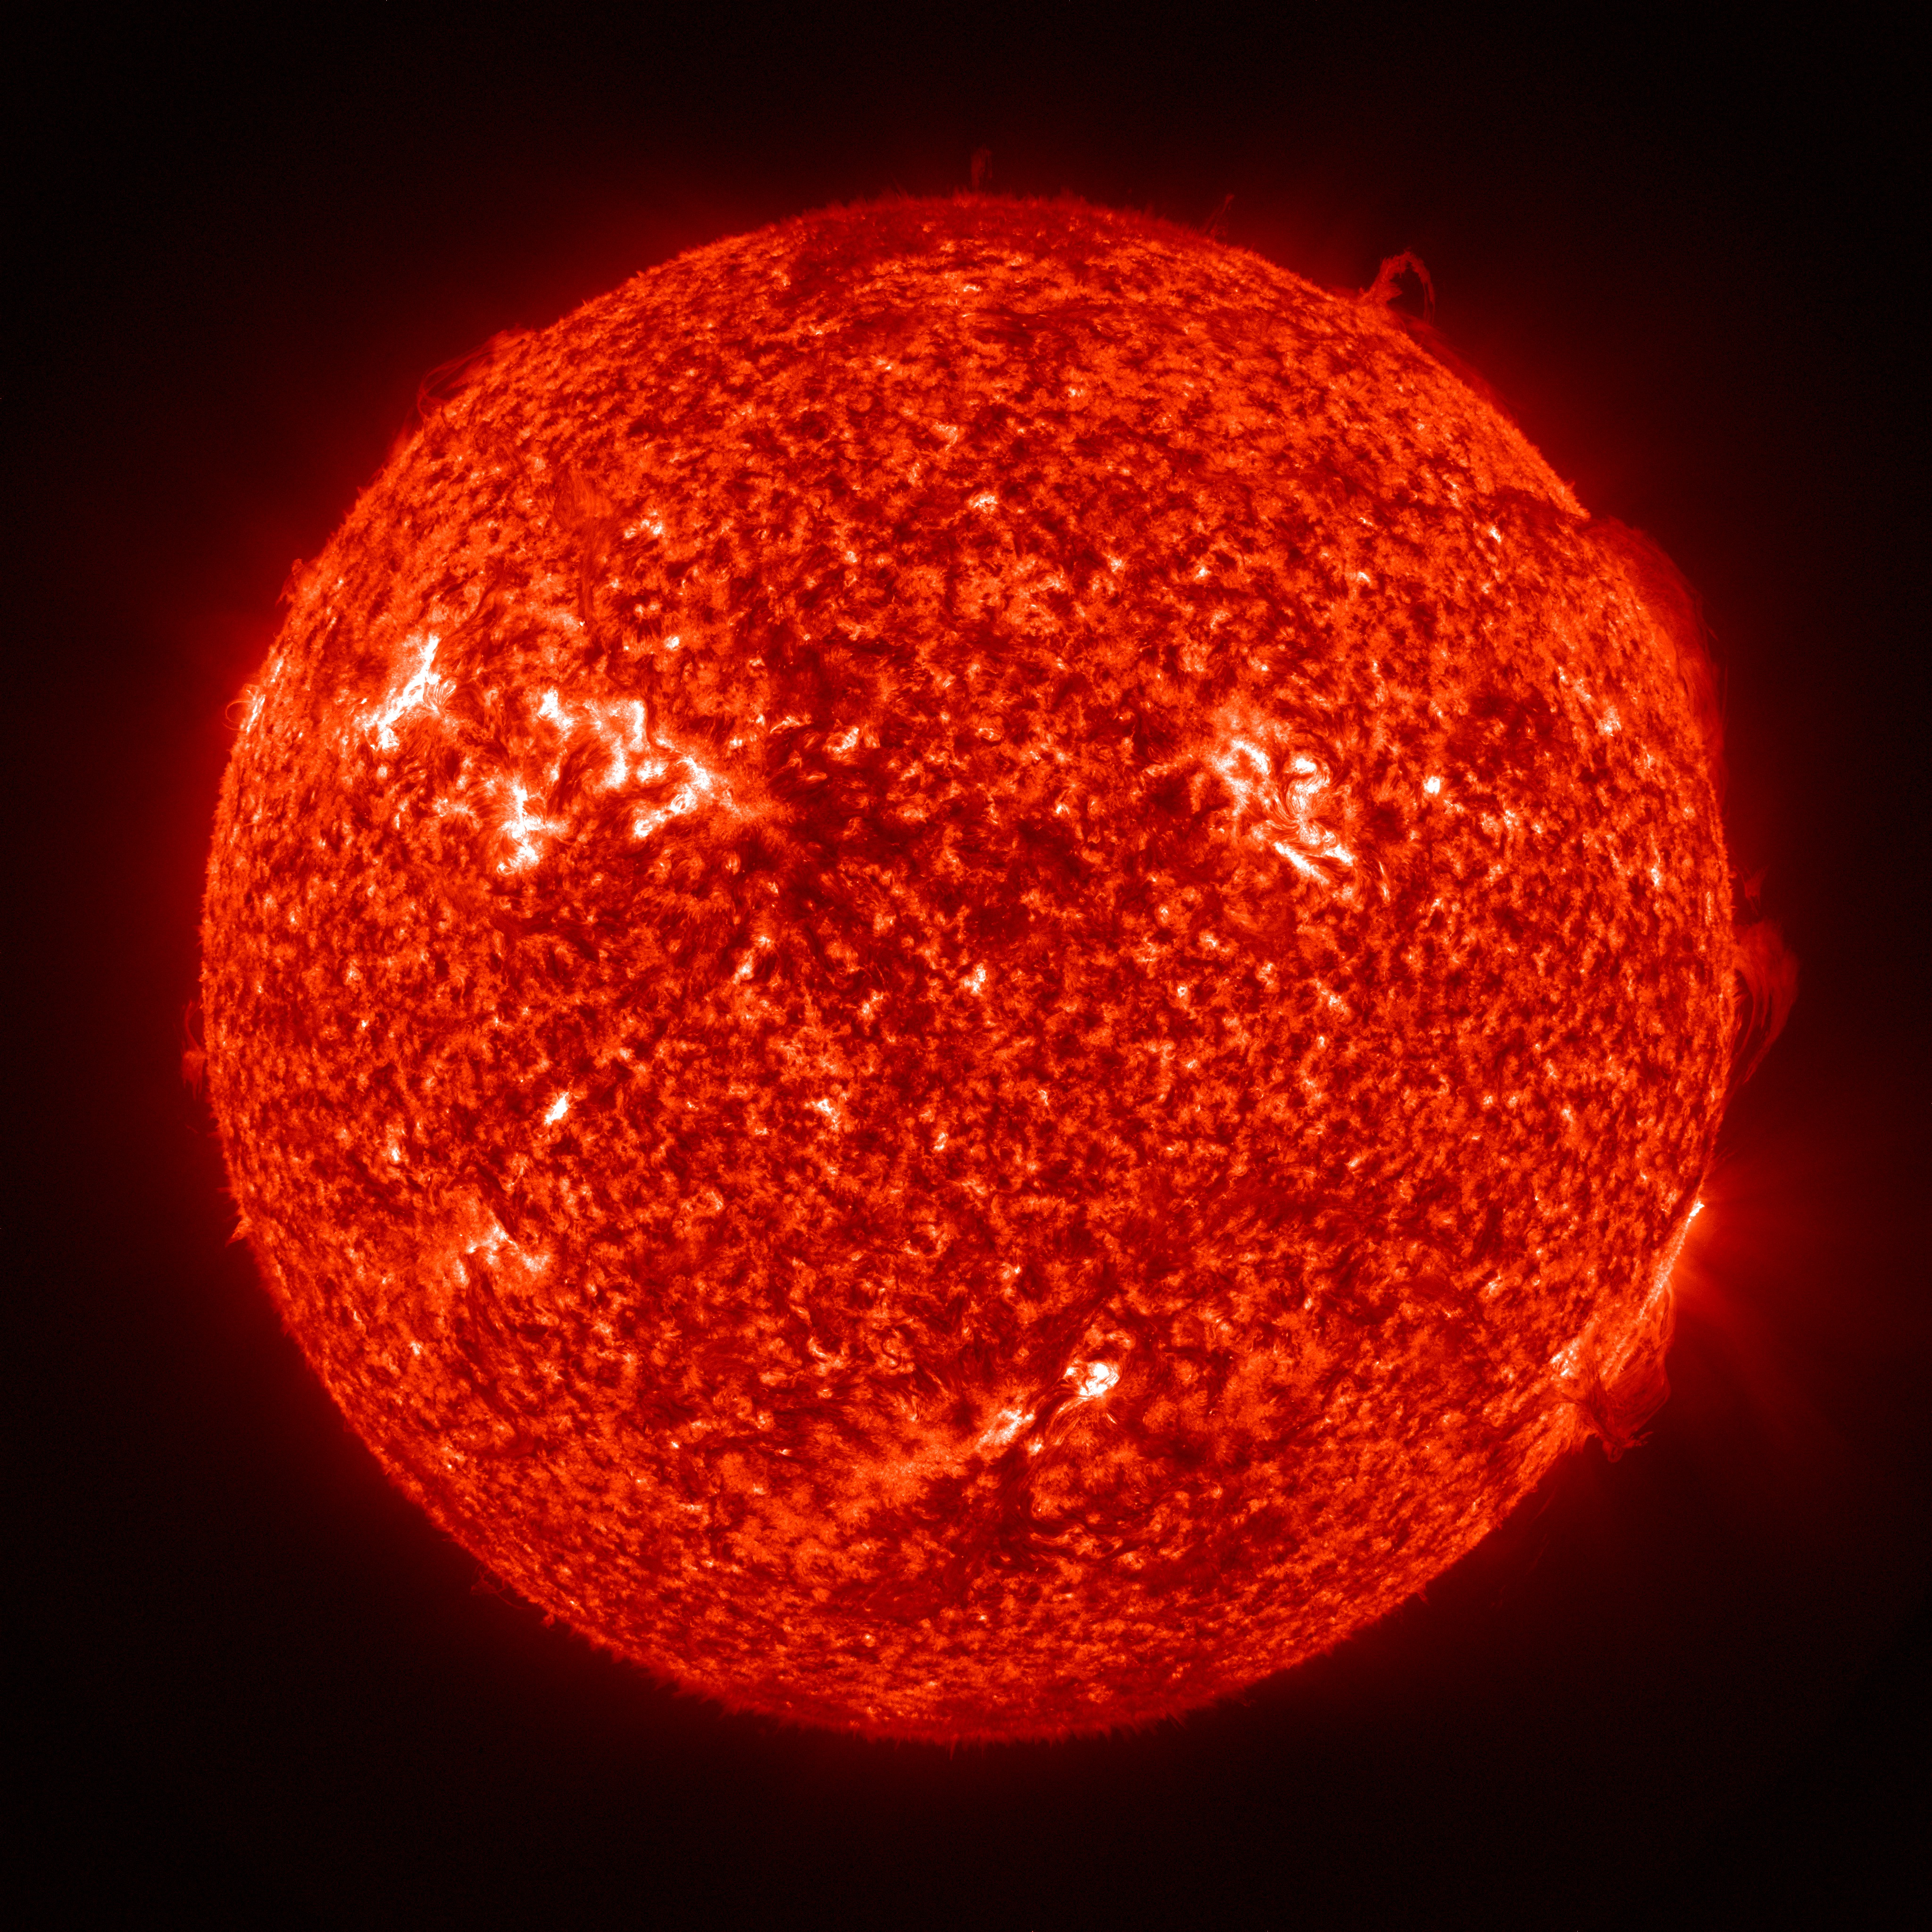
The Sun's activity increases as we enter solar cycle 24. But even several years away from the peak, the Sun in ultraviolet light shows a variety of activity.
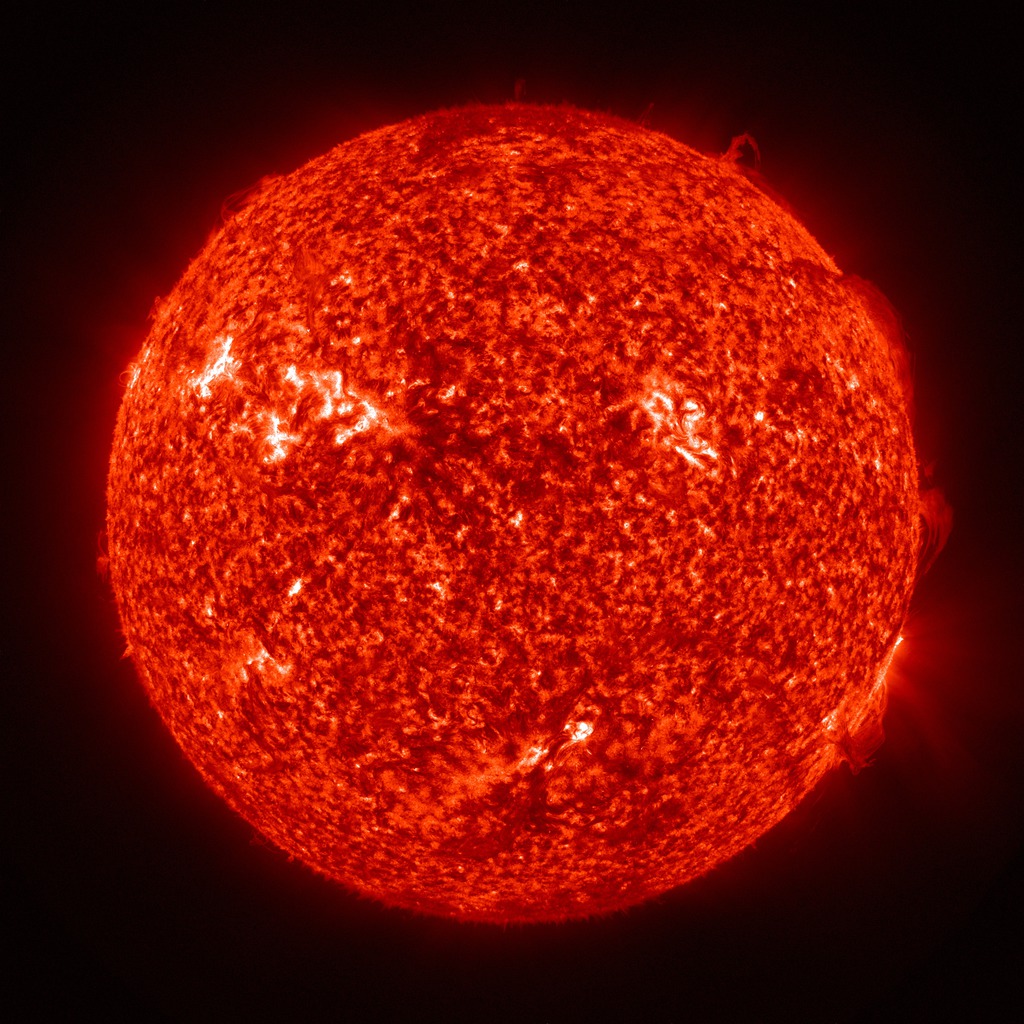
Solar Dynamics Observatory - Atmospheric Imaging Assembly
This visualization consists of eight hours of SDO AIA imagery from the 30.4 nanometer filter (304 Ångstroms). This sequence plays at the full time cadence of the AIA instrument - one image every twelve seconds of real time - and showing thirty images per second on playback.
Related
Visualization Credits
Tom Bridgman (Global Science and Technology, Inc.): Lead Animator
William D. Pesnell (NASA/GSFC): Scientist
William D. Pesnell (NASA/GSFC): Scientist
Please give credit for this item to:
NASA/Goddard Space Flight Center Scientific Visualization Studio
NASA/Goddard Space Flight Center Scientific Visualization Studio
Short URL to share this page:
https://svs.gsfc.nasa.gov/3828
Mission:
SDO
Data Used:
Note: While we identify the data sets used in these visualizations, we do not store any further details nor the data sets themselves on our site.
This item is part of this series:
SDO - Visualizations
Keywords:
SVS >> HDTV
SVS >> Solar Rotation
GCMD >> Earth Science >> Sun-earth Interactions >> Solar Activity
GCMD >> Earth Science >> Sun-earth Interactions >> Solar Activity >> Solar Active Regions
GCMD >> Earth Science >> Sun-earth Interactions >> Solar Activity >> Solar Filaments
GCMD >> Earth Science >> Sun-earth Interactions >> Solar Activity >> Solar Flares
GCMD >> Earth Science >> Sun-earth Interactions >> Solar Activity >> Solar Prominences
GCMD >> Earth Science >> Sun-earth Interactions >> Solar Activity >> Solar Ultraviolet
SVS >> Hyperwall
SVS >> SDO
SVS >> Solar Dynamics Observatory
NASA Science >> Sun
SVS >> Presentation
SVS >> Extreme Ultraviolet Imaging
SVS >> EUV Imaging
GCMD keywords can be found on the Internet with the following citation: Olsen, L.M., G. Major, K. Shein, J. Scialdone, S. Ritz, T. Stevens, M. Morahan, A. Aleman, R. Vogel, S. Leicester, H. Weir, M. Meaux, S. Grebas, C.Solomon, M. Holland, T. Northcutt, R. A. Restrepo, R. Bilodeau, 2013. NASA/Global Change Master Directory (GCMD) Earth Science Keywords. Version 8.0.0.0.0
https://svs.gsfc.nasa.gov/3828
Mission:
SDO
Data Used:
SDO/AIA/304 Filter also referred to as: AIA 304
JOINT SCIENCE OPERATIONS CENTER - 2010-10-21T18:00:00Z - 2010-10-22T04:00:10ZThis item is part of this series:
SDO - Visualizations
Keywords:
SVS >> HDTV
SVS >> Solar Rotation
GCMD >> Earth Science >> Sun-earth Interactions >> Solar Activity
GCMD >> Earth Science >> Sun-earth Interactions >> Solar Activity >> Solar Active Regions
GCMD >> Earth Science >> Sun-earth Interactions >> Solar Activity >> Solar Filaments
GCMD >> Earth Science >> Sun-earth Interactions >> Solar Activity >> Solar Flares
GCMD >> Earth Science >> Sun-earth Interactions >> Solar Activity >> Solar Prominences
GCMD >> Earth Science >> Sun-earth Interactions >> Solar Activity >> Solar Ultraviolet
SVS >> Hyperwall
SVS >> SDO
SVS >> Solar Dynamics Observatory
NASA Science >> Sun
SVS >> Presentation
SVS >> Extreme Ultraviolet Imaging
SVS >> EUV Imaging
GCMD keywords can be found on the Internet with the following citation: Olsen, L.M., G. Major, K. Shein, J. Scialdone, S. Ritz, T. Stevens, M. Morahan, A. Aleman, R. Vogel, S. Leicester, H. Weir, M. Meaux, S. Grebas, C.Solomon, M. Holland, T. Northcutt, R. A. Restrepo, R. Bilodeau, 2013. NASA/Global Change Master Directory (GCMD) Earth Science Keywords. Version 8.0.0.0.0


