2007 Greenland Melt Season Study - Stereoscopic Version
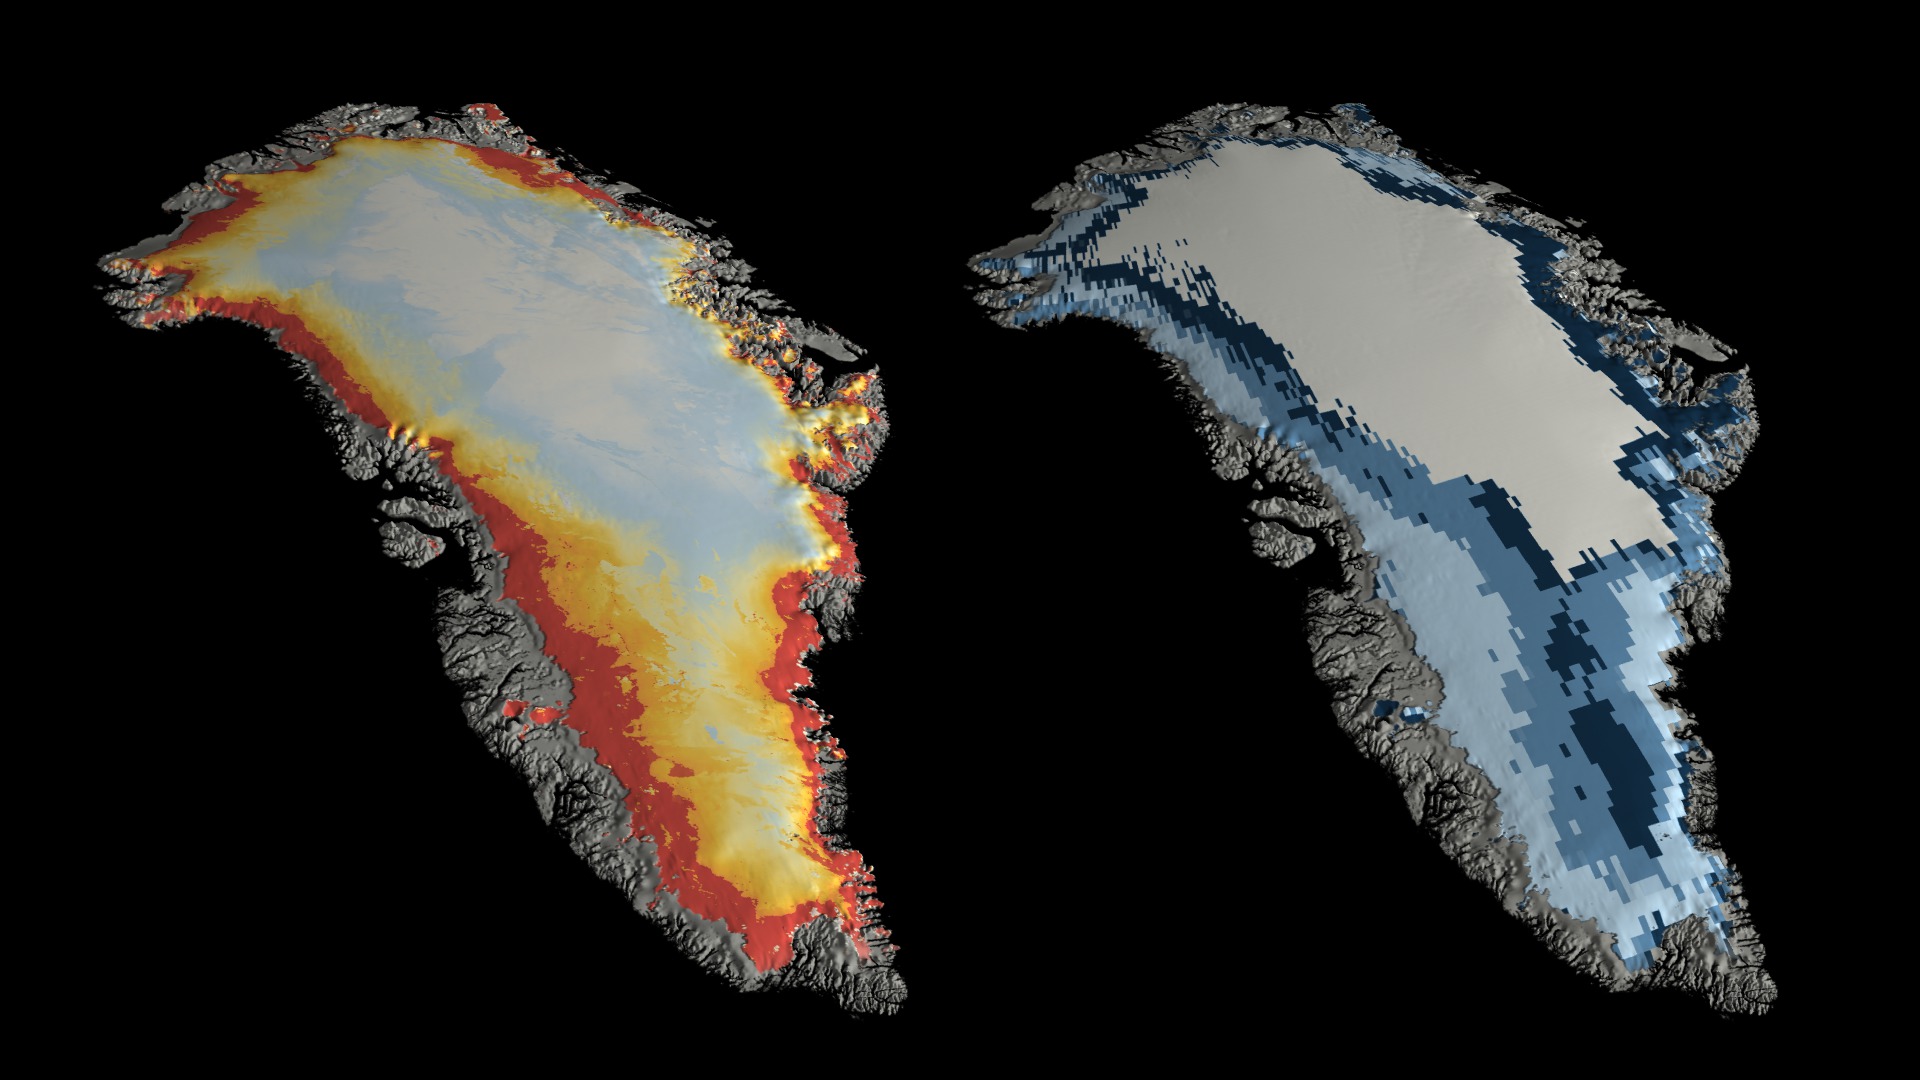
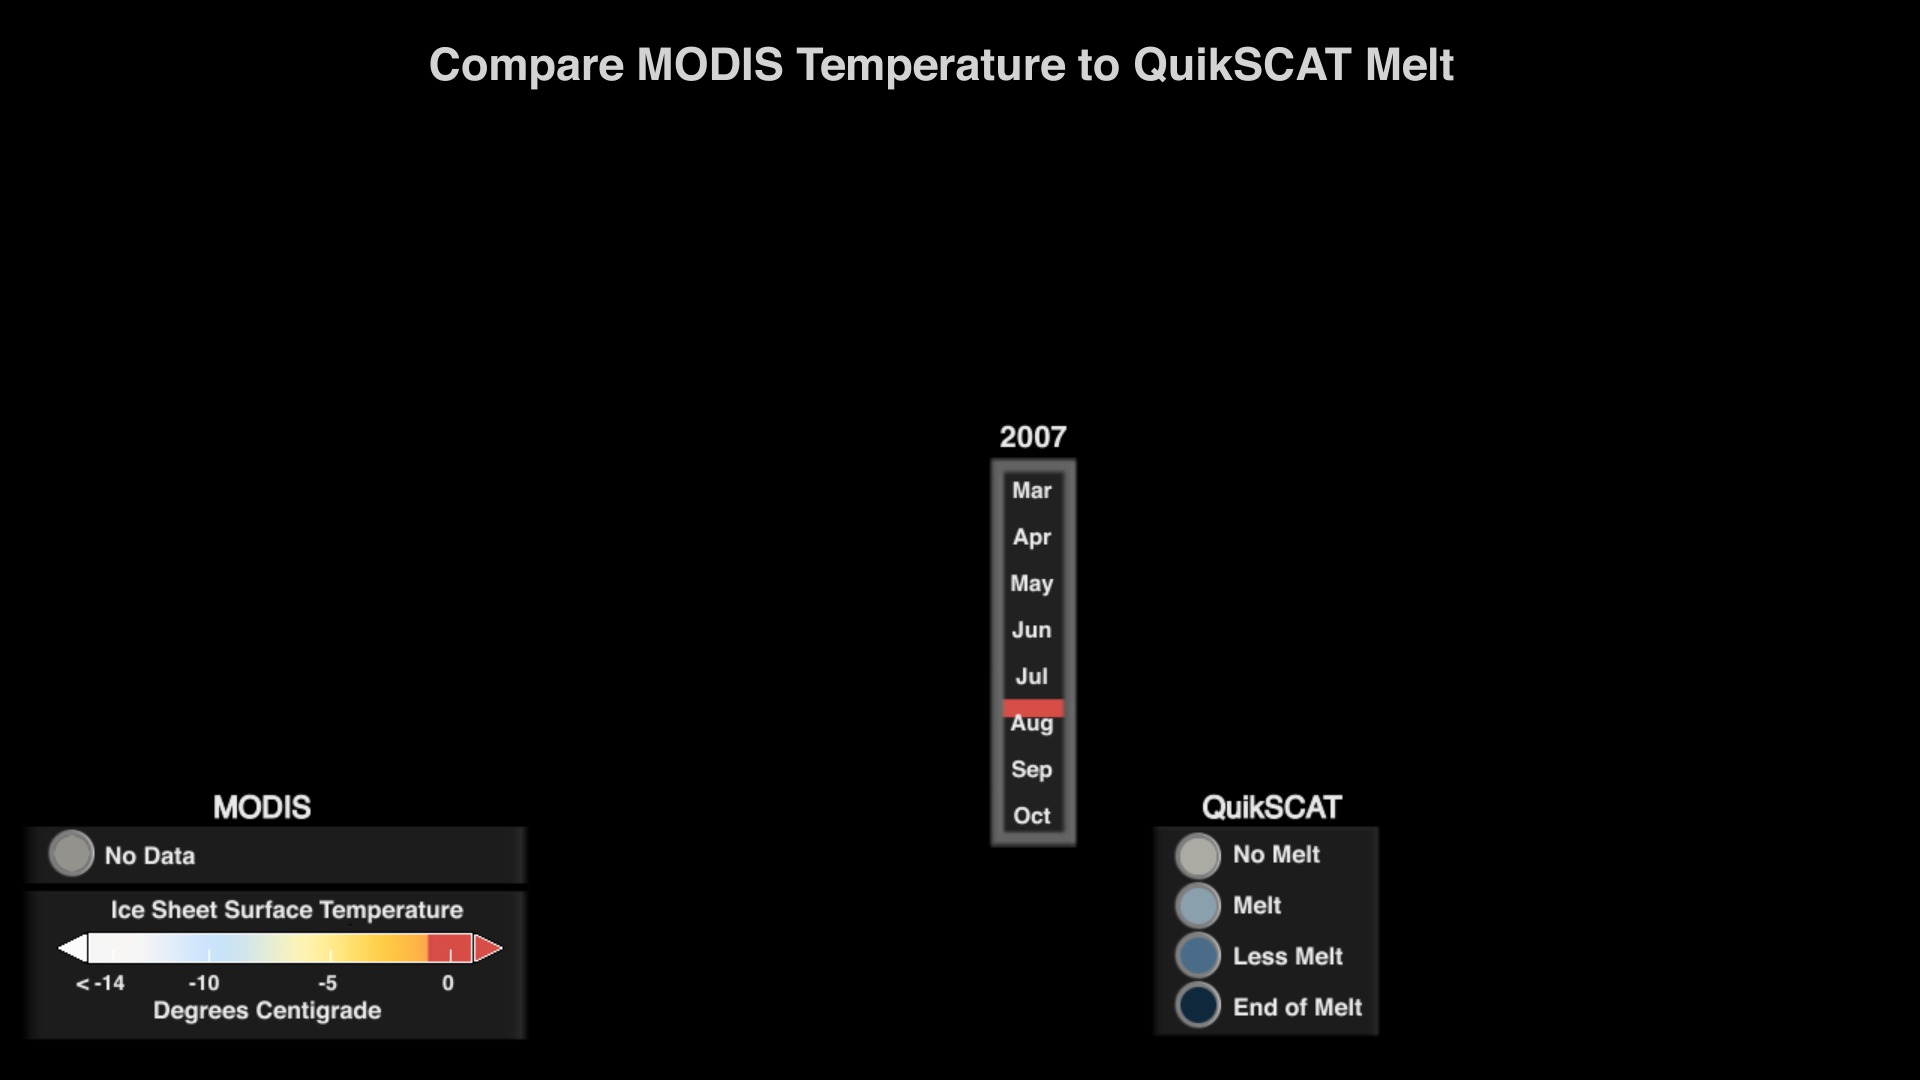
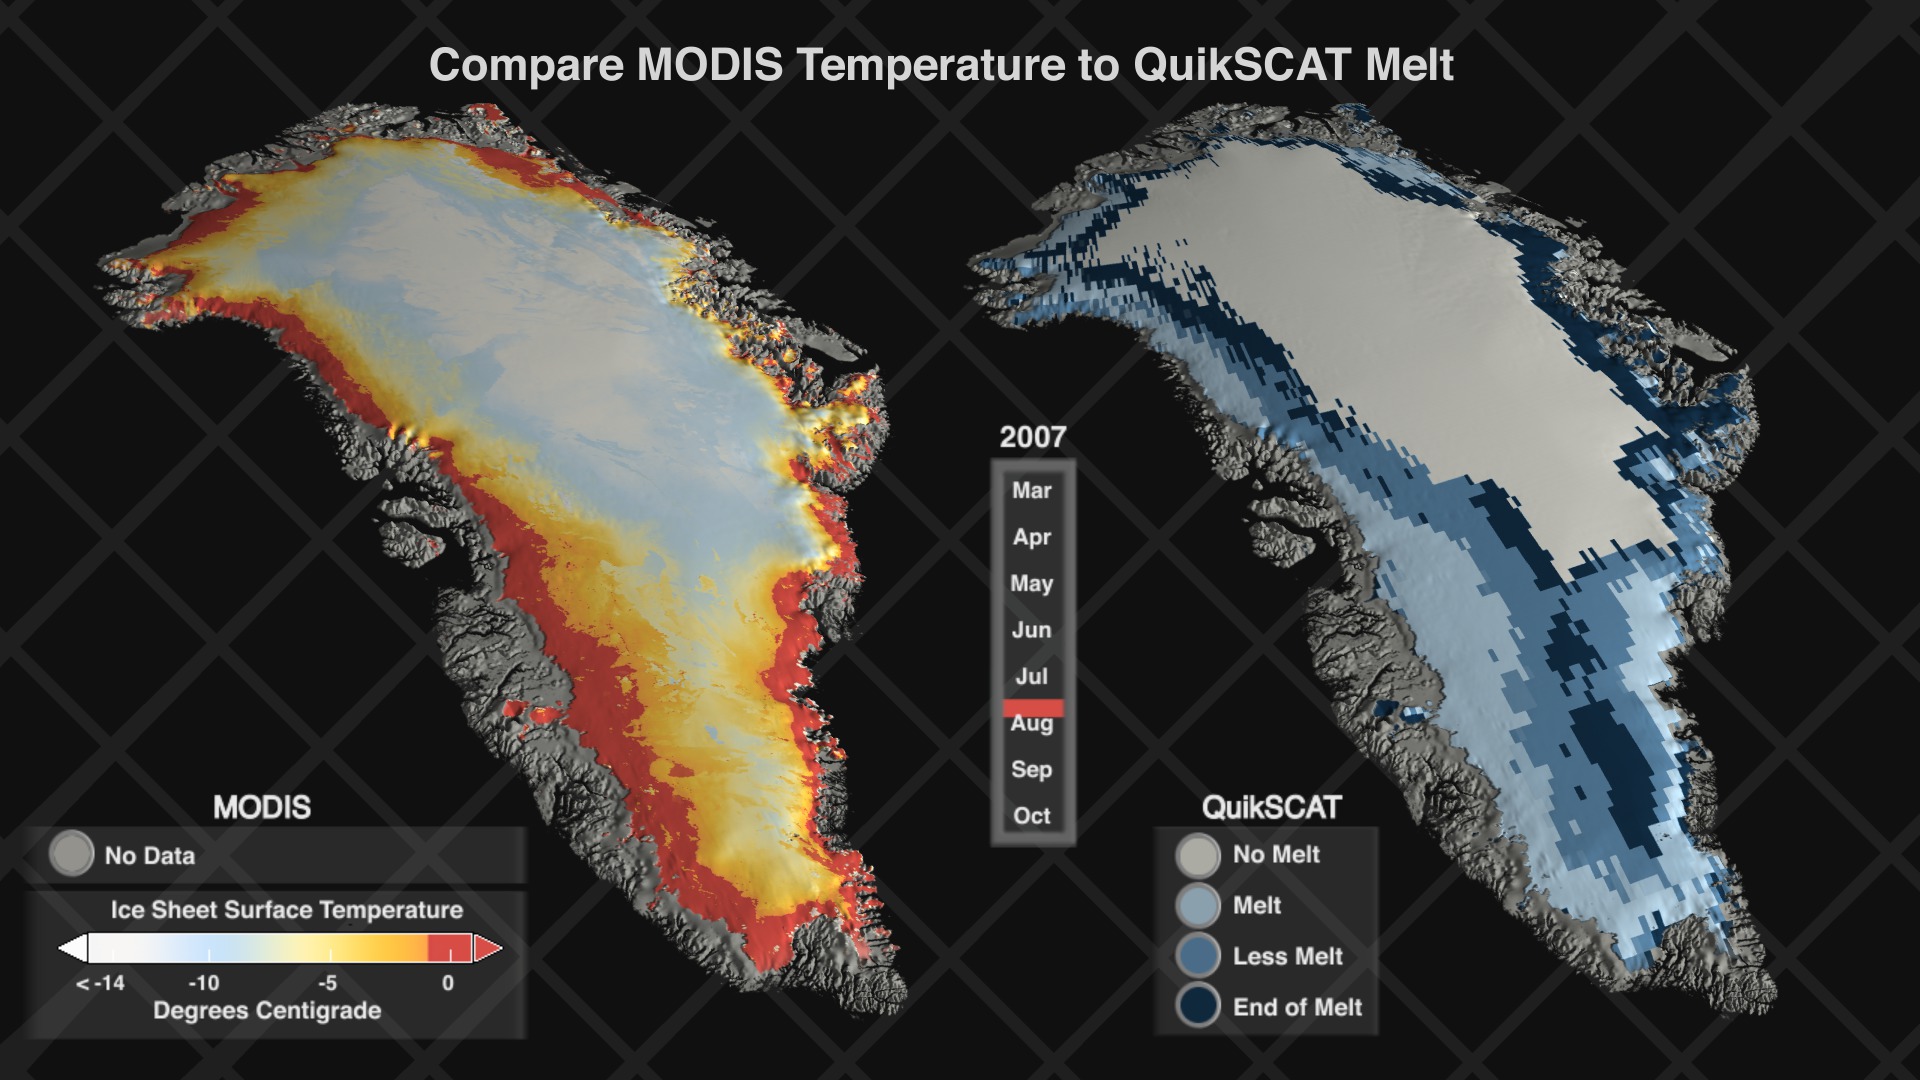
This animation displays these two geophysical data products of the Greenland ice sheet side-by-side, showing MODIS data on the left side and QuikSCAT data on the right. The 2007 melt season is shown twice. In the first sequence, MODIS surface temperature is compared with several categories of QuikSCAT melt between March 15th and October 13th, 2010. During this sequence, active melt detected by QuikSCAT is shown in light blue, reduced melt is medium blue, and completed melt is dark blue. For the MODIS, surface temperature is shown with the color scale — red indicates a surface temperature greater than -1 degree Celsius. As MODIS shows warmer surface temperature as the melt season progresses, QuikSCAT consistently identifies the corresponding melt.
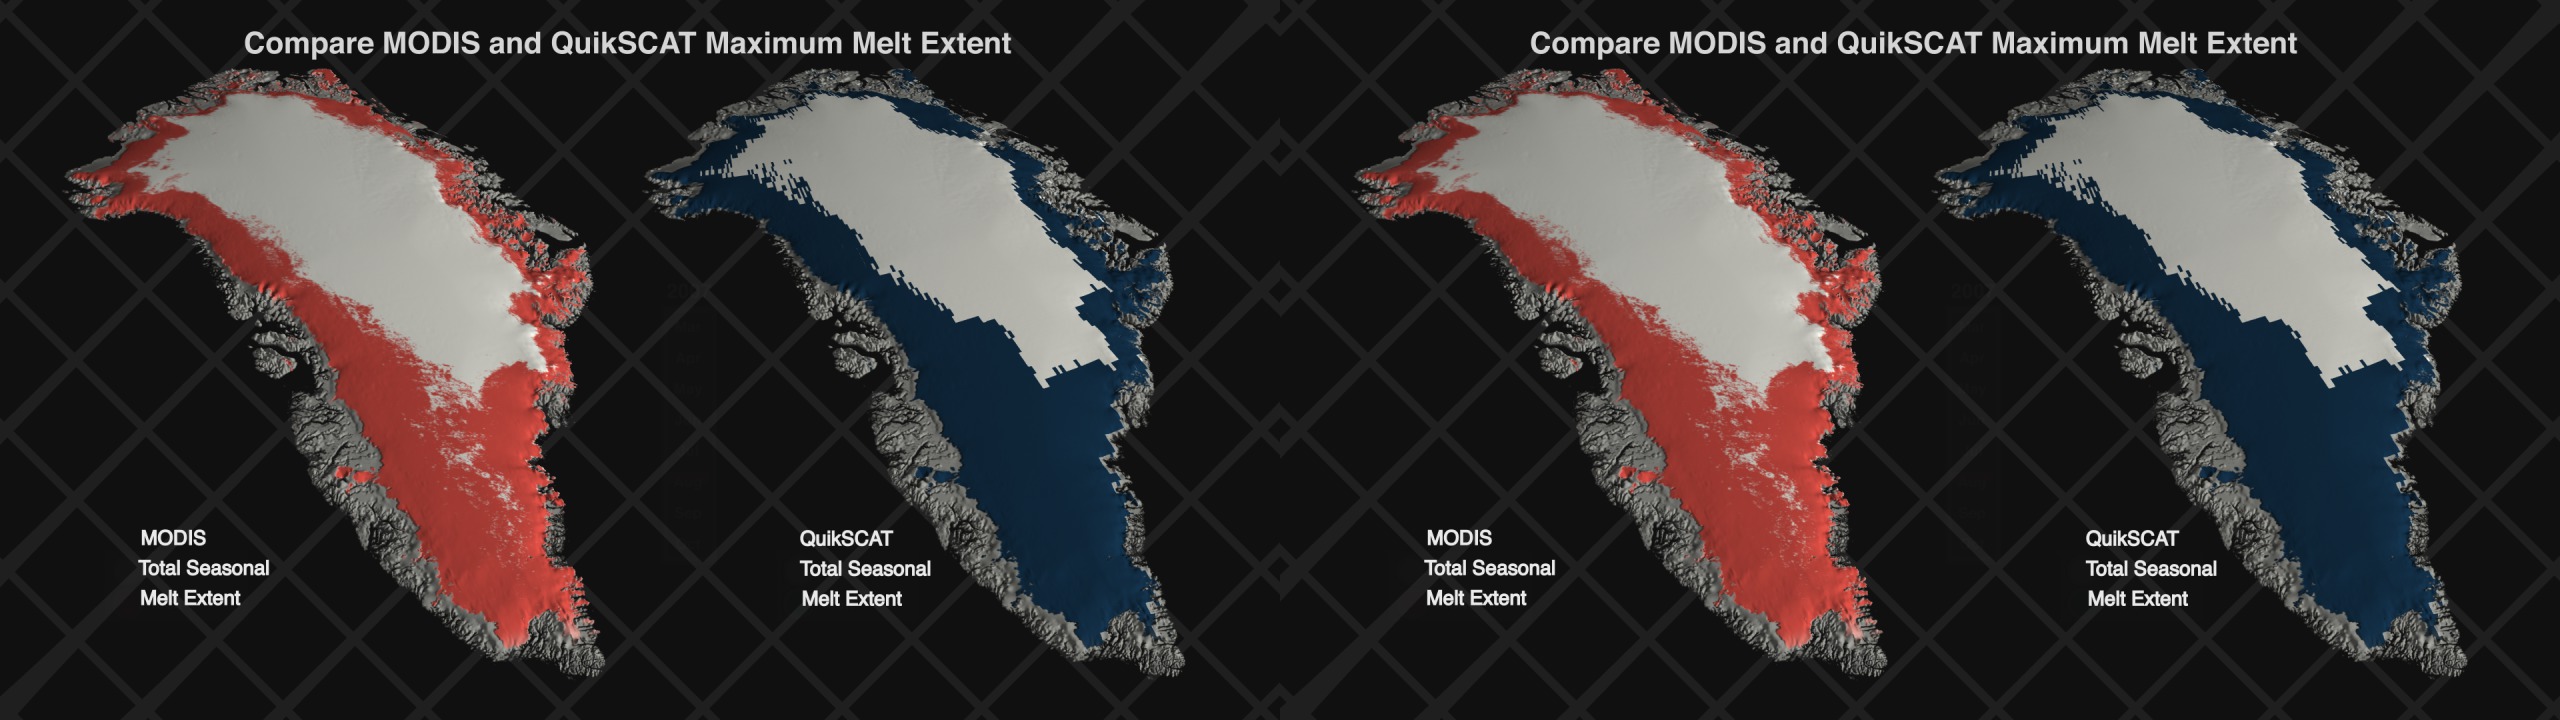
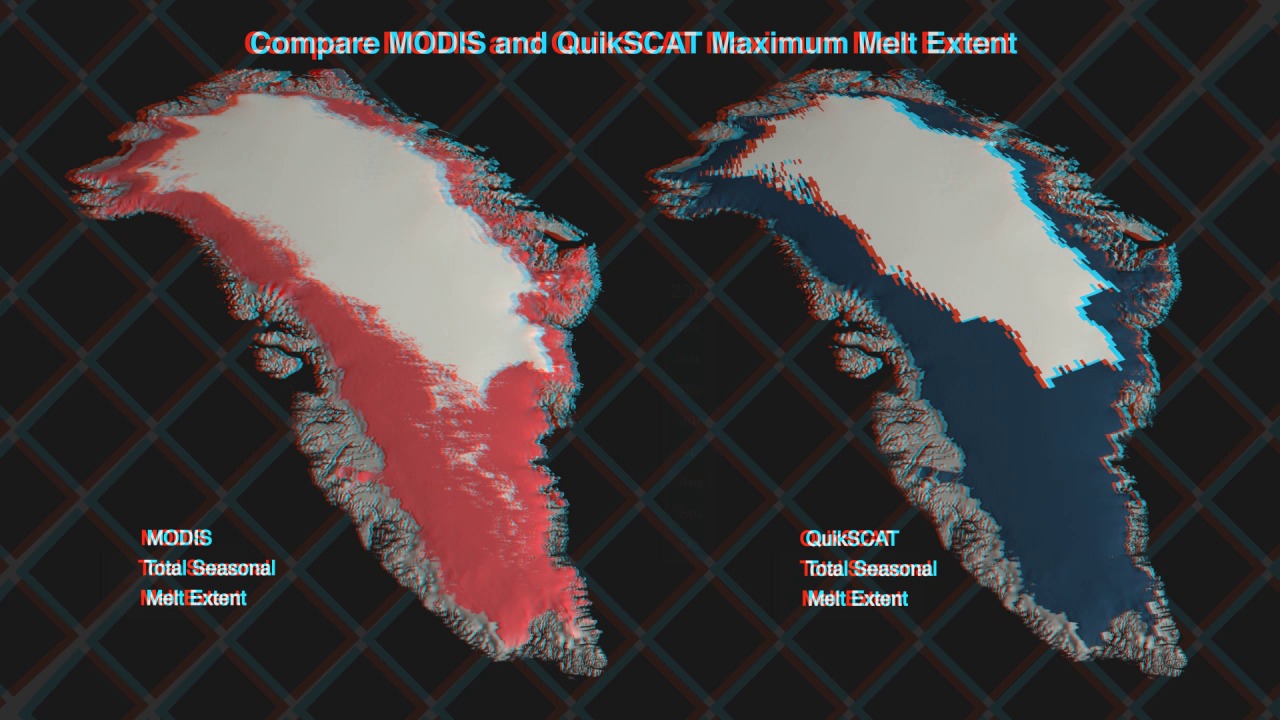
In the second sequence, the MODIS and QuikSCAT melted regions of the ice sheet were accumulated during the melt season. QuikSCAT captures melt earlier, and then melt is detected by MODIS shortly afterward at a higher spatial resolution. The final result (frame) shows the seasonal melt extent which was consistently delineated by both sensors. The cross-verification of these independent measurements, by two different instruments on different satellites, provides a higher confidence level in the melt observations, reducing the uncertainty in climate assessment of Greenland melt.
This visualization is a stereoscopic version of animation entry: #3738: 2007 Greenland Melt Season Study.
In this page the visualization content is offered in two different modes to accommodate stereoscopic systems, such as: Left and Right Eye separate and Left and Right Eye side-by-side combined on the same frame.


Visualization Credits
Helen-Nicole Kostis (UMBC): Animator
Victoria Weeks (HTSI): Video Editor
Michael Starobin (HTSI): Producer
Dorothy Hall (NASA/GSFC): Scientist
Son Nghiem (NASA/JPL CalTech): Scientist
NASA/Goddard Space Flight Center Scientific Visualization Studio
https://svs.gsfc.nasa.gov/3766
Missions:
QuikSCAT
Terra
Data Used:
QuikSCAT/SeaWinds/QuikSCAT Detection of Snowmelt on the Greenland Ice Sheet
01/01/2007 - 12/31/2007Terra/MODIS/Land Surface Temperature
01/01/2007 - 12/31/2007Keywords:
DLESE >> Cryology
SVS >> HDTV
GCMD >> Earth Science >> Cryosphere
GCMD >> Earth Science >> Cryosphere >> Snow/Ice
GCMD >> Earth Science >> Cryosphere >> Snow/Ice >> Freeze/Thaw
GCMD >> Earth Science >> Cryosphere >> Snow/Ice >> Ice Growth/Melt
GCMD >> Earth Science >> Cryosphere >> Snow/Ice >> Snow/Ice Temperature
GCMD >> Earth Science >> Hydrosphere >> Snow/Ice >> Snow/Ice Temperature
SVS >> Stereo Display
NASA Science >> Earth
GCMD keywords can be found on the Internet with the following citation: Olsen, L.M., G. Major, K. Shein, J. Scialdone, S. Ritz, T. Stevens, M. Morahan, A. Aleman, R. Vogel, S. Leicester, H. Weir, M. Meaux, S. Grebas, C.Solomon, M. Holland, T. Northcutt, R. A. Restrepo, R. Bilodeau, 2013. NASA/Global Change Master Directory (GCMD) Earth Science Keywords. Version 8.0.0.0.0


