Earth
ID: 3756
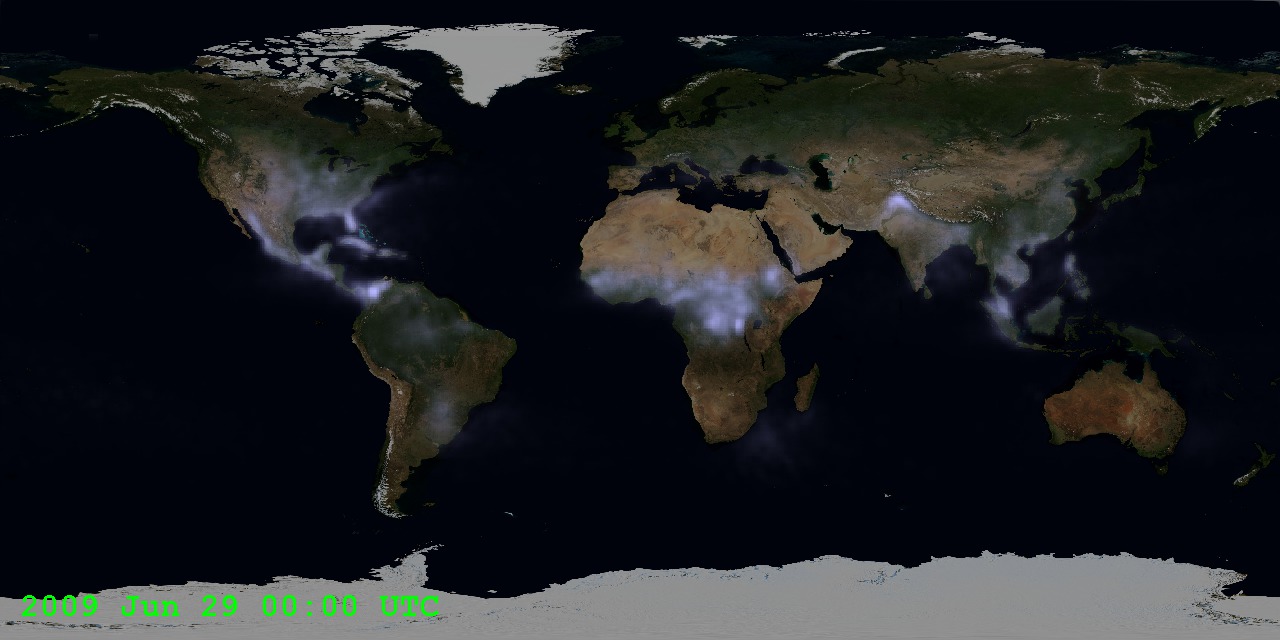
This is an animated map illustrating how the daily probability of lightning (the light blue glow) varies with the seasons.
Animated Daily Lightning Map
The highest lightning probabilty corresponds to the warmest locations at any given time (a higher probabilty of thunderstorms) and also with the seasons. The warmest locations tend to be even warmer in summer so lightning probability is even higher in those locations.
Visualization Credits
Please give credit for this item to:
NASA/Goddard Space Flight Center Scientific Visualization Studio
NASA/Goddard Space Flight Center Scientific Visualization Studio
Short URL to share this page:
https://svs.gsfc.nasa.gov/3756
Missions:
Terra
Tropical Rainfall Measuring Mission - TRMM
Data Used:
Note: While we identify the data sets used in these visualizations, we do not store any further details nor the data sets themselves on our site.
This item is part of this series:
Terrestrial Gamma Flashes
Keywords:
GCMD >> Earth Science >> Atmosphere >> Atmospheric Electricity >> Lightning
NASA Science >> Earth
GCMD keywords can be found on the Internet with the following citation: Olsen, L.M., G. Major, K. Shein, J. Scialdone, S. Ritz, T. Stevens, M. Morahan, A. Aleman, R. Vogel, S. Leicester, H. Weir, M. Meaux, S. Grebas, C.Solomon, M. Holland, T. Northcutt, R. A. Restrepo, R. Bilodeau, 2013. NASA/Global Change Master Directory (GCMD) Earth Science Keywords. Version 8.0.0.0.0
https://svs.gsfc.nasa.gov/3756
Missions:
Terra
Tropical Rainfall Measuring Mission - TRMM
Data Used:
Terra and Aqua/MODIS/Blue Marble: Next Generation also referred to as: BMNG
Credit:
The Blue Marble data is courtesy of Reto Stockli (NASA/GSFC).
The Blue Marble data is courtesy of Reto Stockli (NASA/GSFC).
TRMM/LIS/Lightning
1996This item is part of this series:
Terrestrial Gamma Flashes
Keywords:
GCMD >> Earth Science >> Atmosphere >> Atmospheric Electricity >> Lightning
NASA Science >> Earth
GCMD keywords can be found on the Internet with the following citation: Olsen, L.M., G. Major, K. Shein, J. Scialdone, S. Ritz, T. Stevens, M. Morahan, A. Aleman, R. Vogel, S. Leicester, H. Weir, M. Meaux, S. Grebas, C.Solomon, M. Holland, T. Northcutt, R. A. Restrepo, R. Bilodeau, 2013. NASA/Global Change Master Directory (GCMD) Earth Science Keywords. Version 8.0.0.0.0


