Earth
ID: 3684
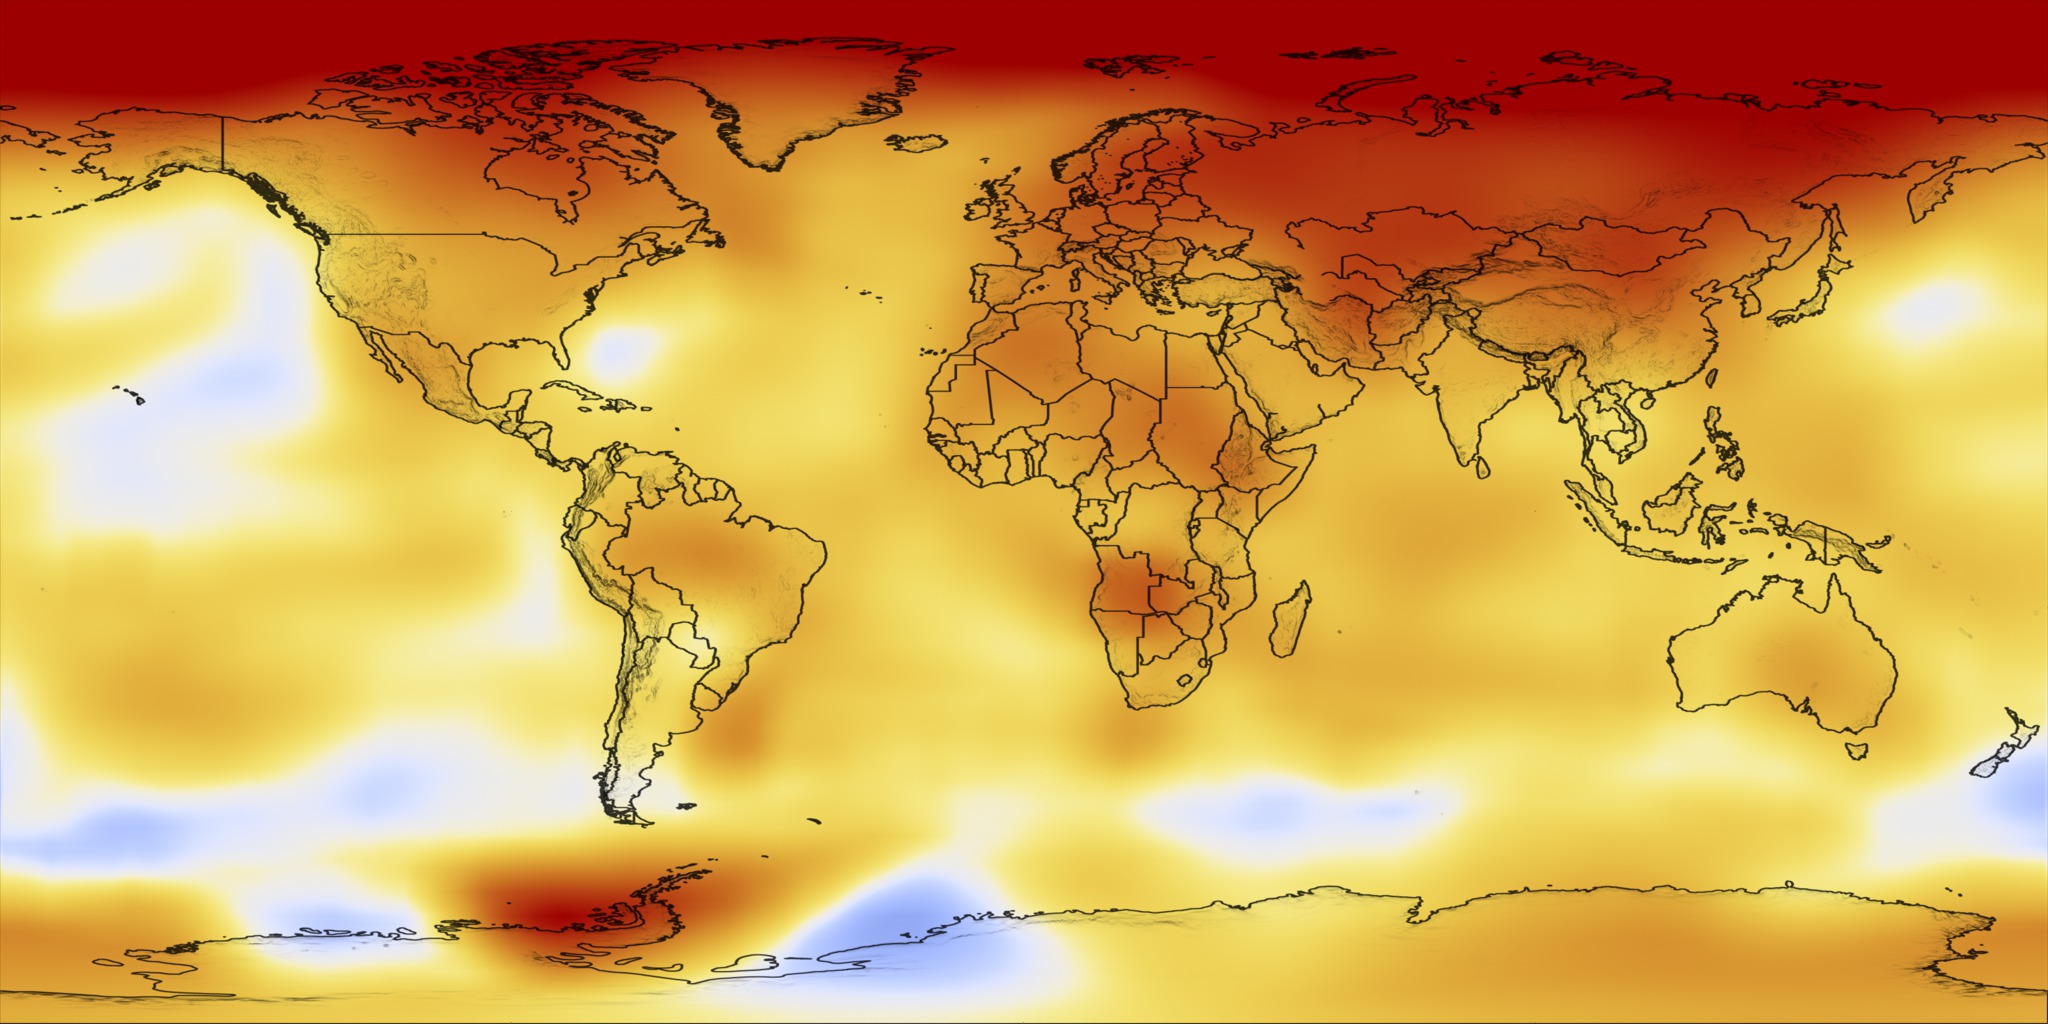
Each year, scientists at NASA Goddard Institute for Space Studies analyze global temperature data. The past year, 2009, tied as the second warmest year in the 130 years of global instrumental temperature records, in the surface temperature analysis of the NASA Goddard Institute for Space Studies (GISS). The Southern Hemisphere set a record as the warmest year for that half of the world. Global mean temperature, was 0.57°C (1.0°F) warmer than climatology (the 1951-1980 base period). Southern Hemisphere mean temperature was 0.49°C (0.88°F) warmer than in the period of climatology. The global record warm year, in the period of near-global instrumental measurements (since the late 1800s), was 2005. This color-coded map displays a long term progression of changing global surface temperatures, from 1881 to 2009. Dark red indicates the greatest warming and dark blue indicates the greatest cooling.
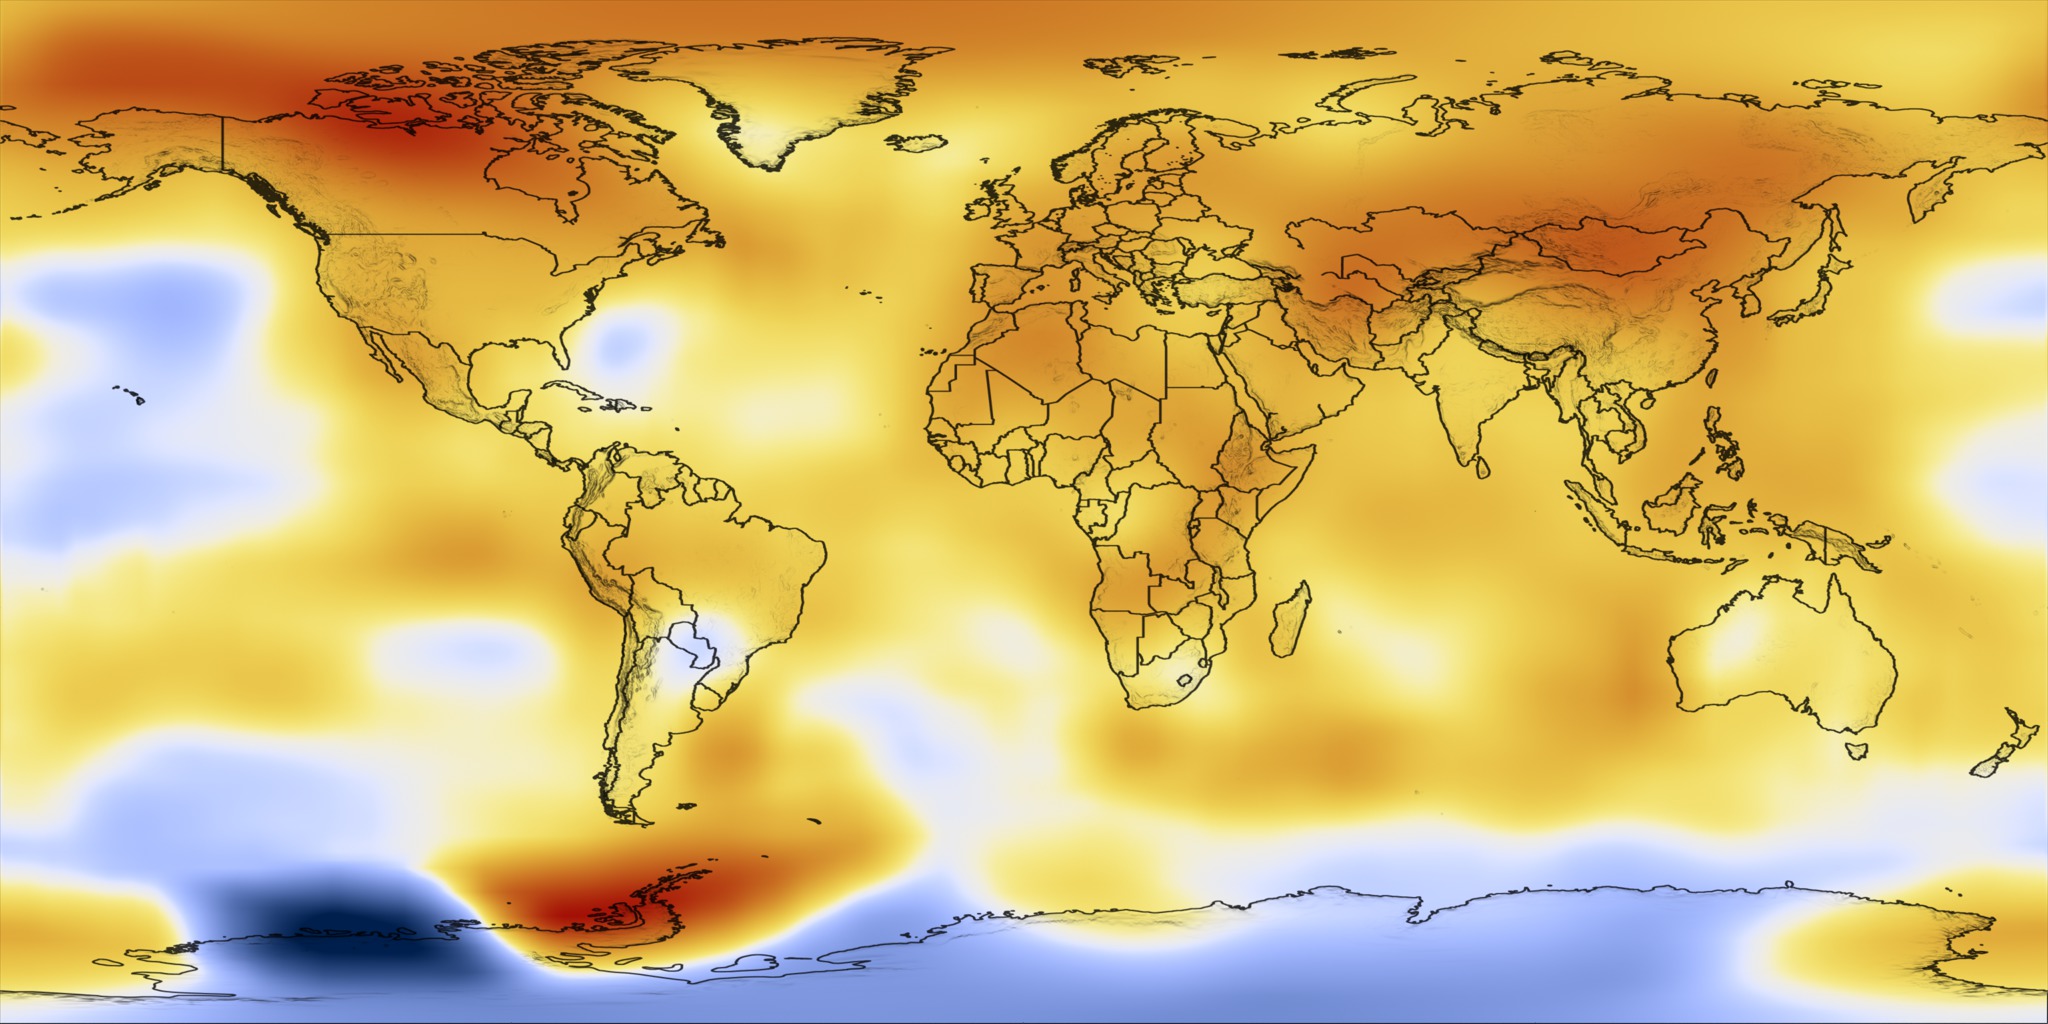
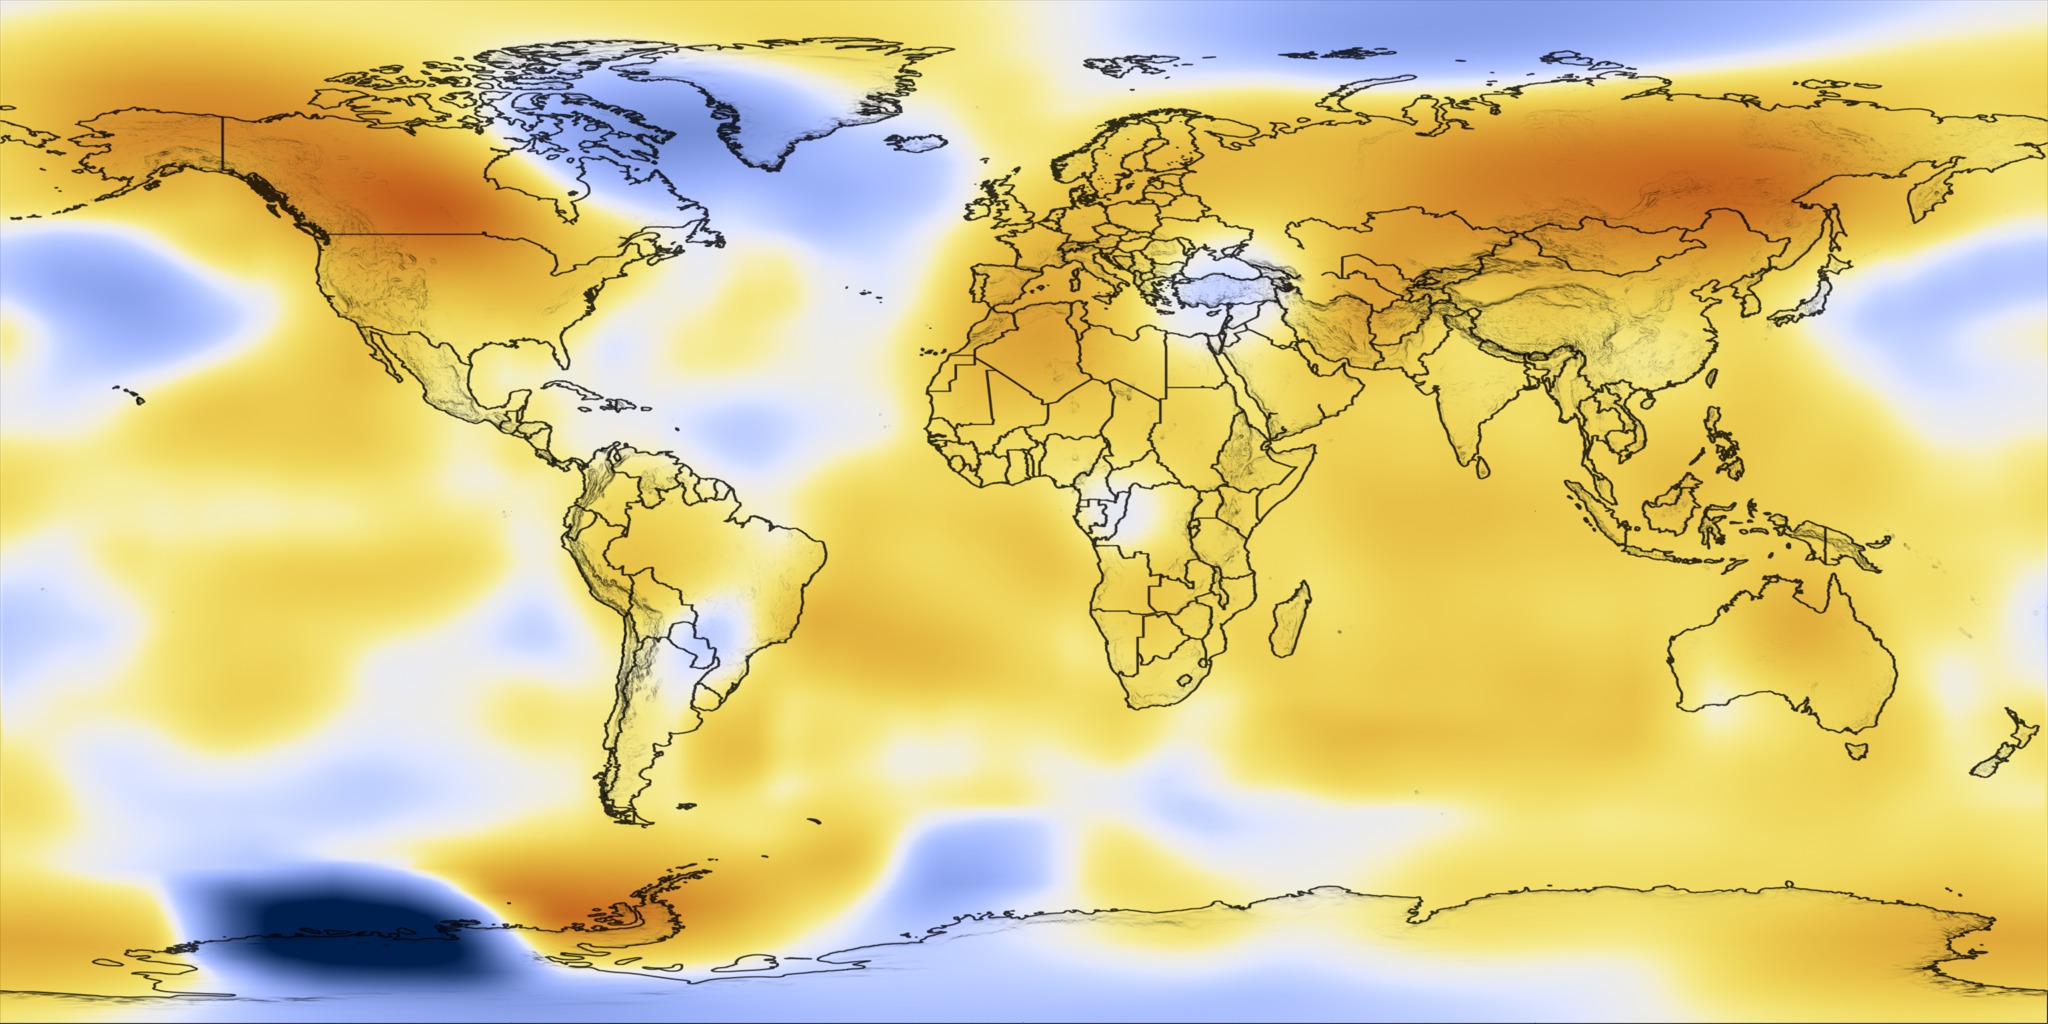
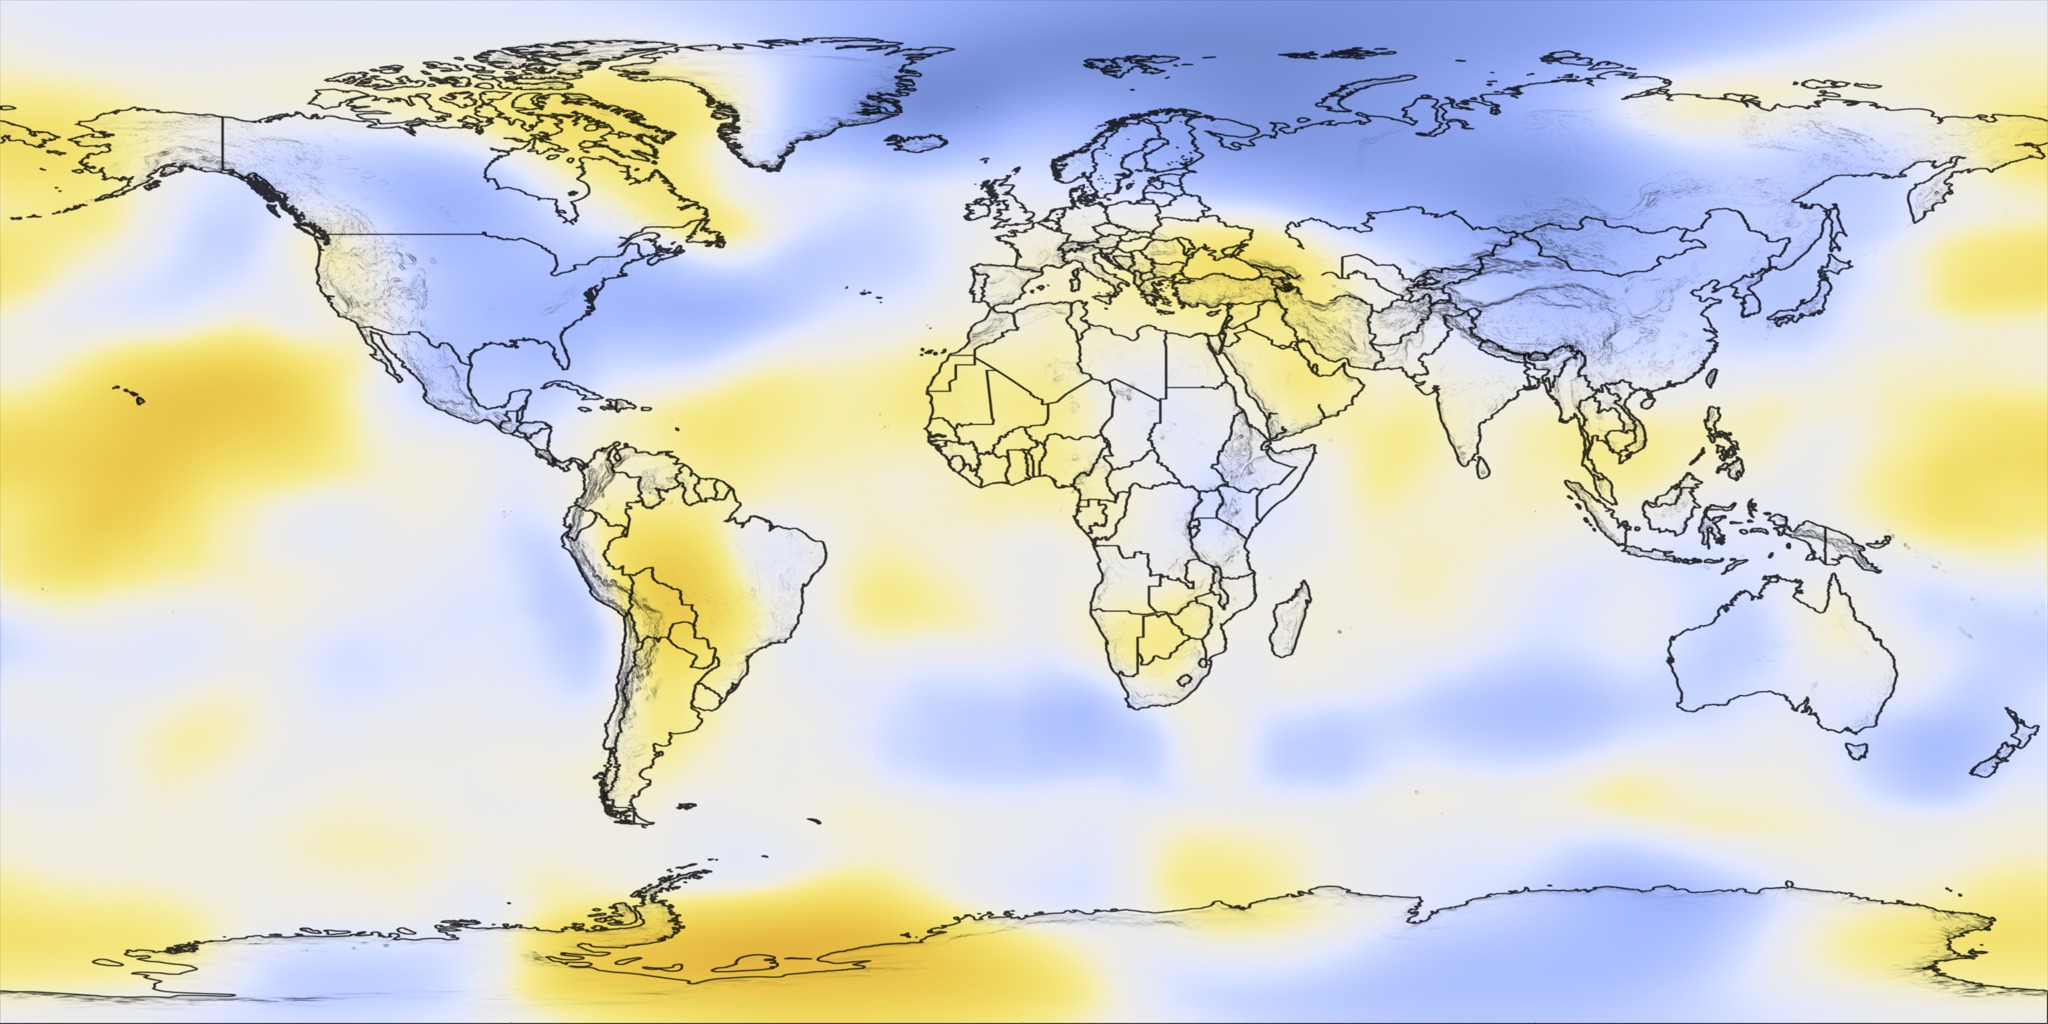
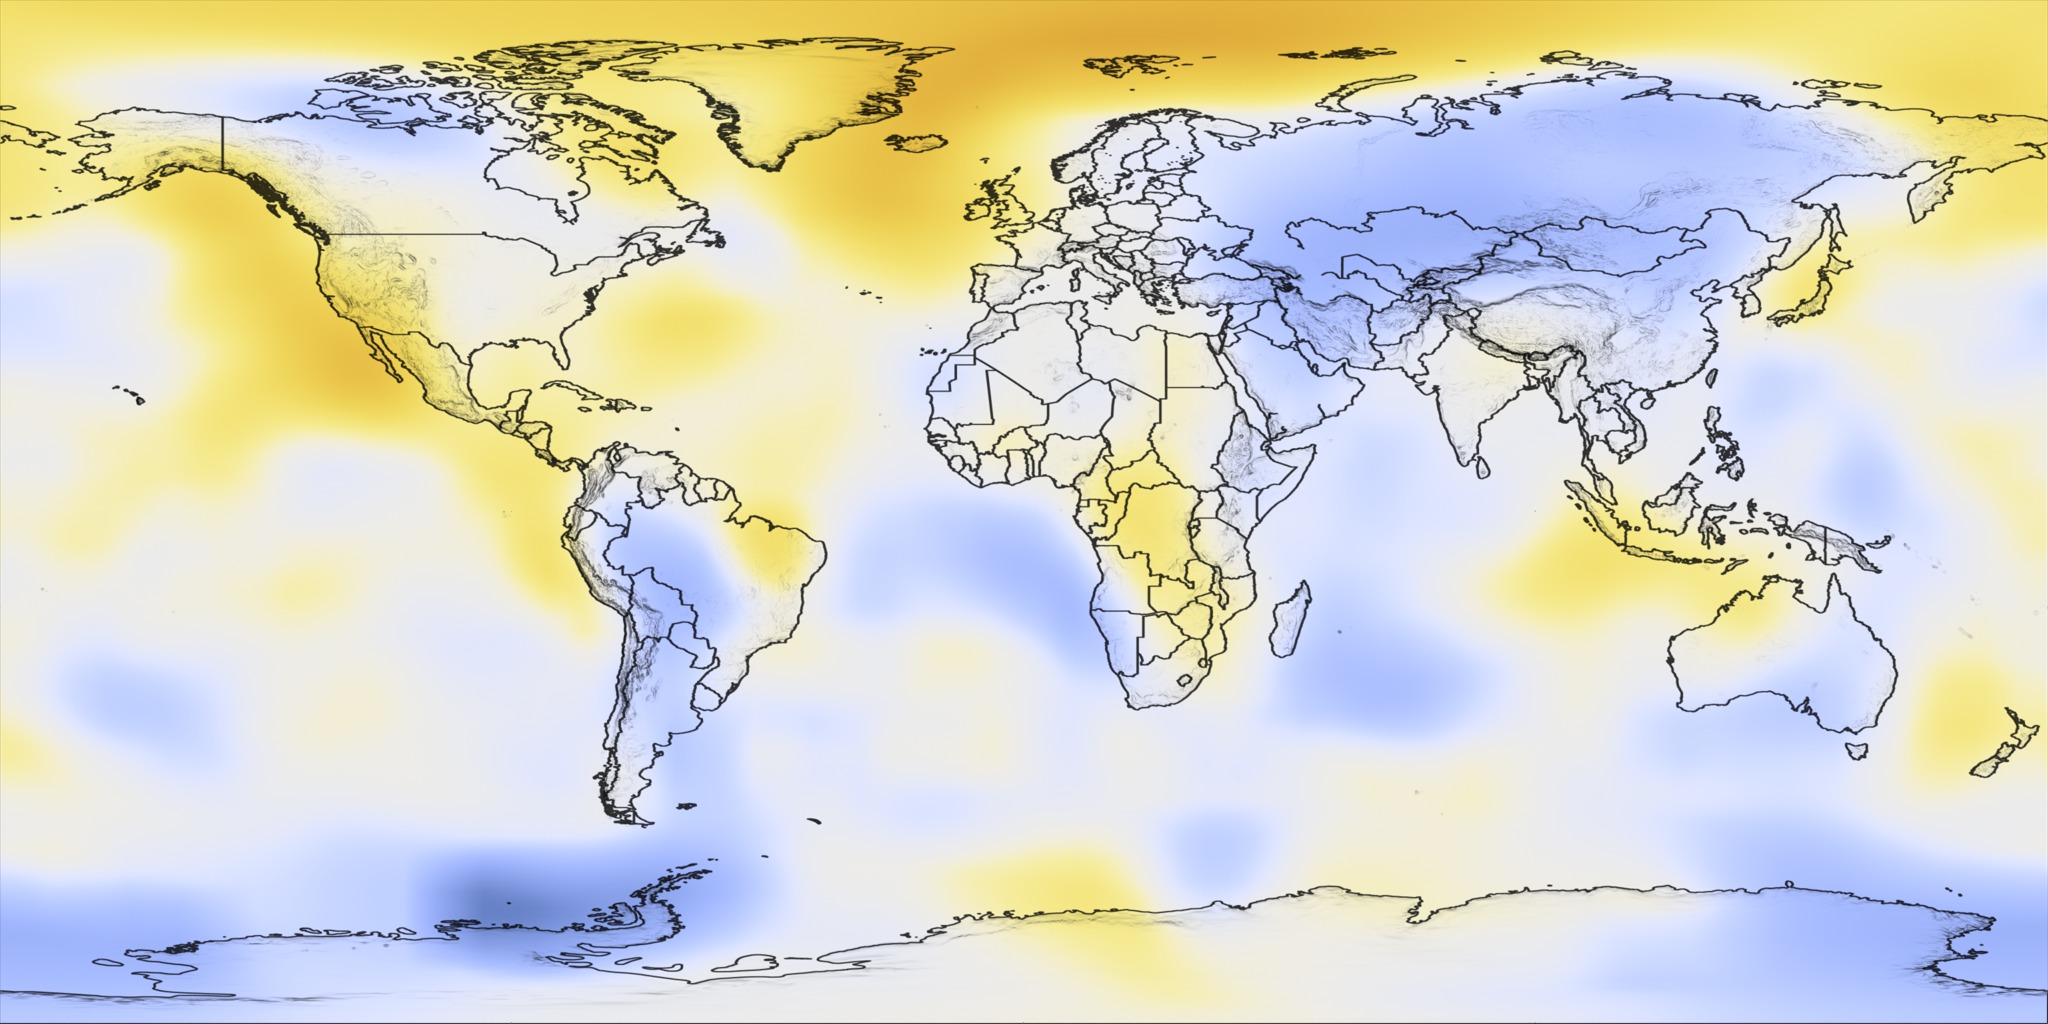
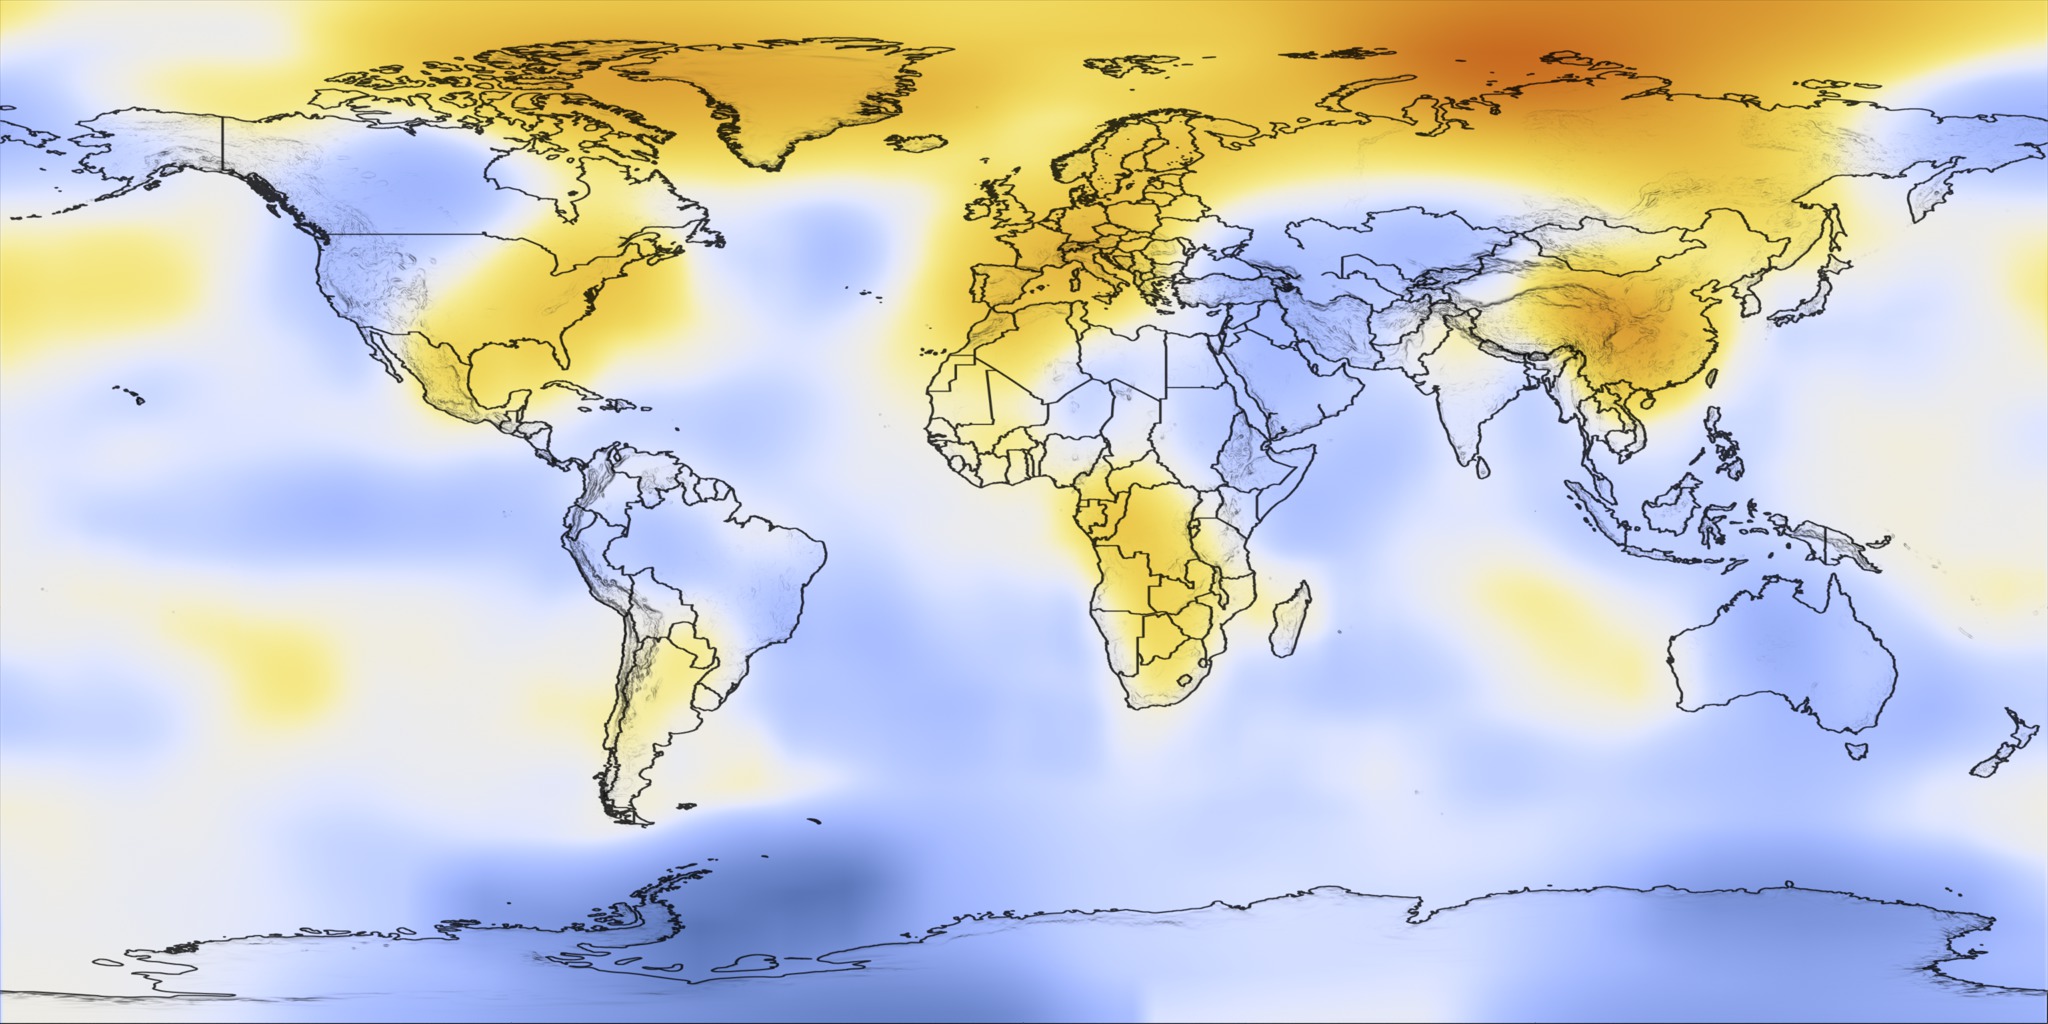
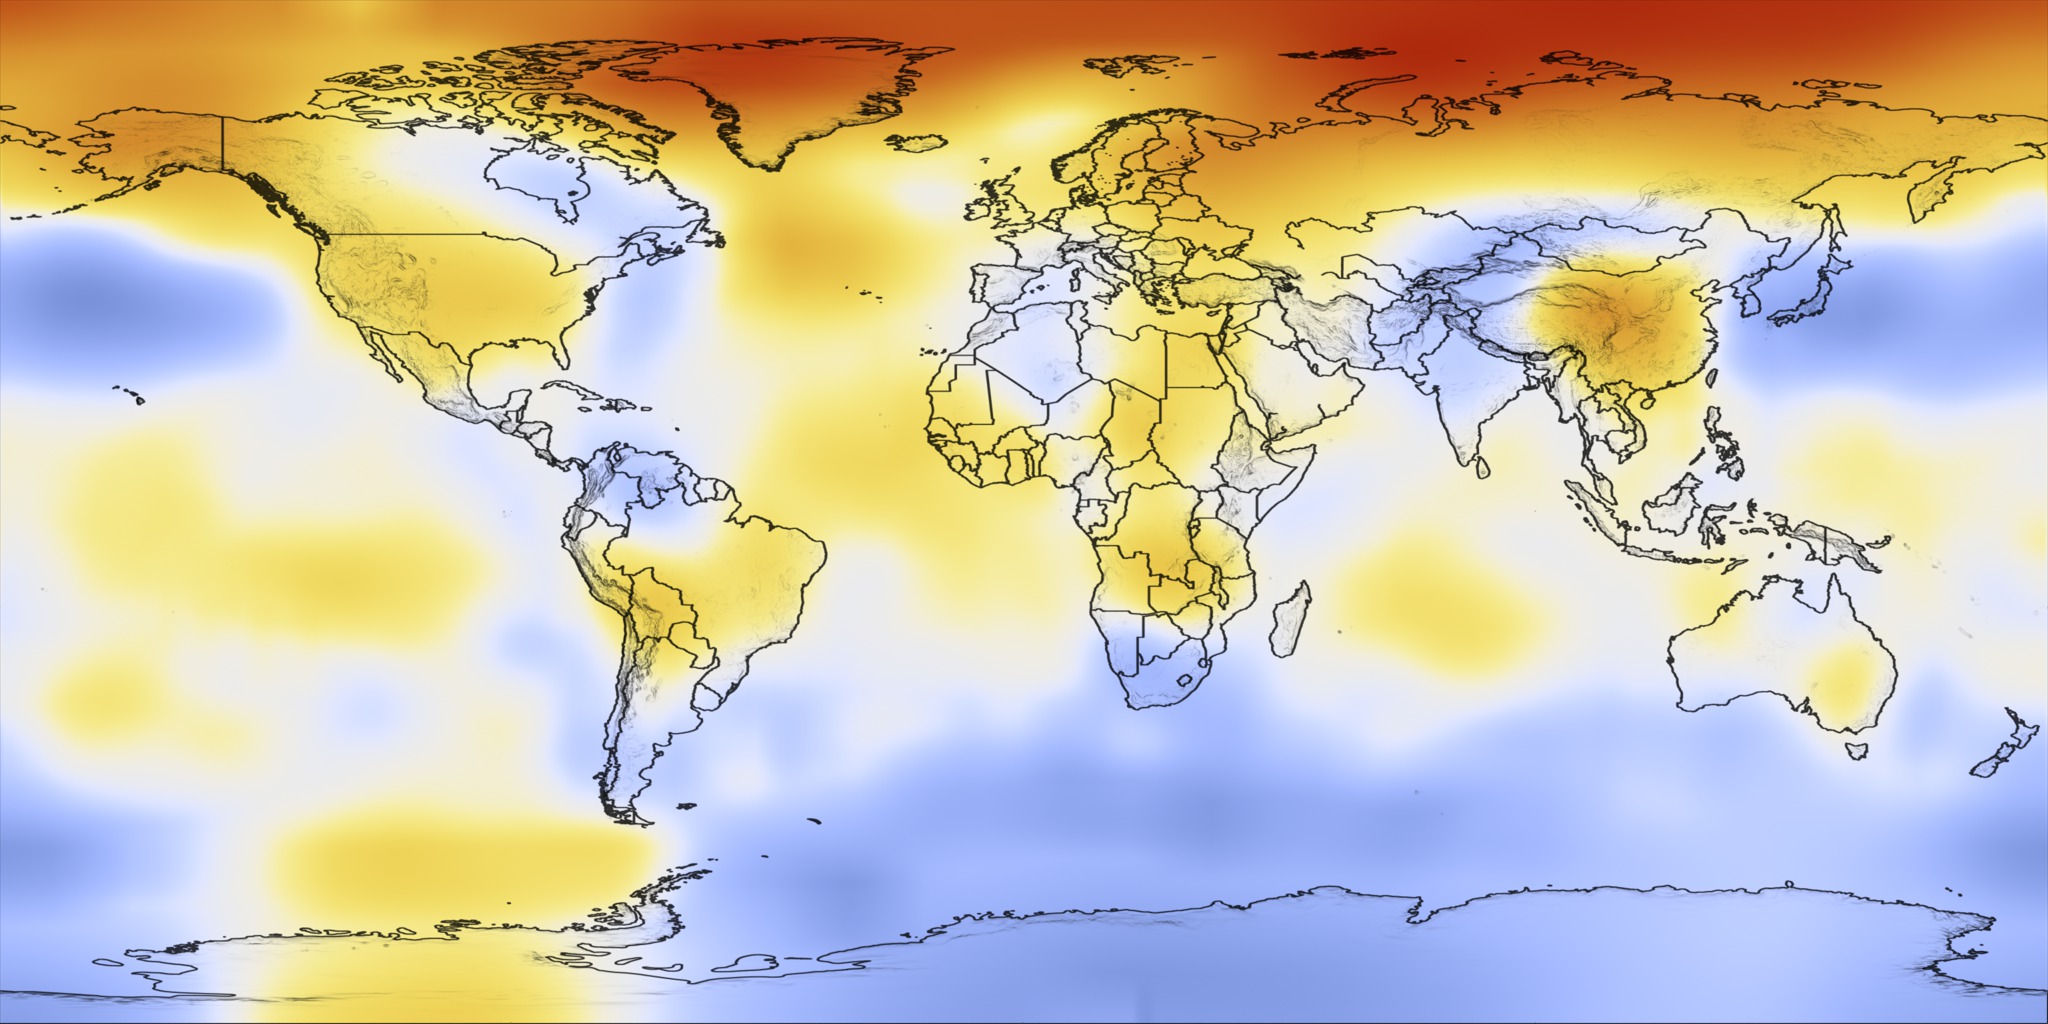
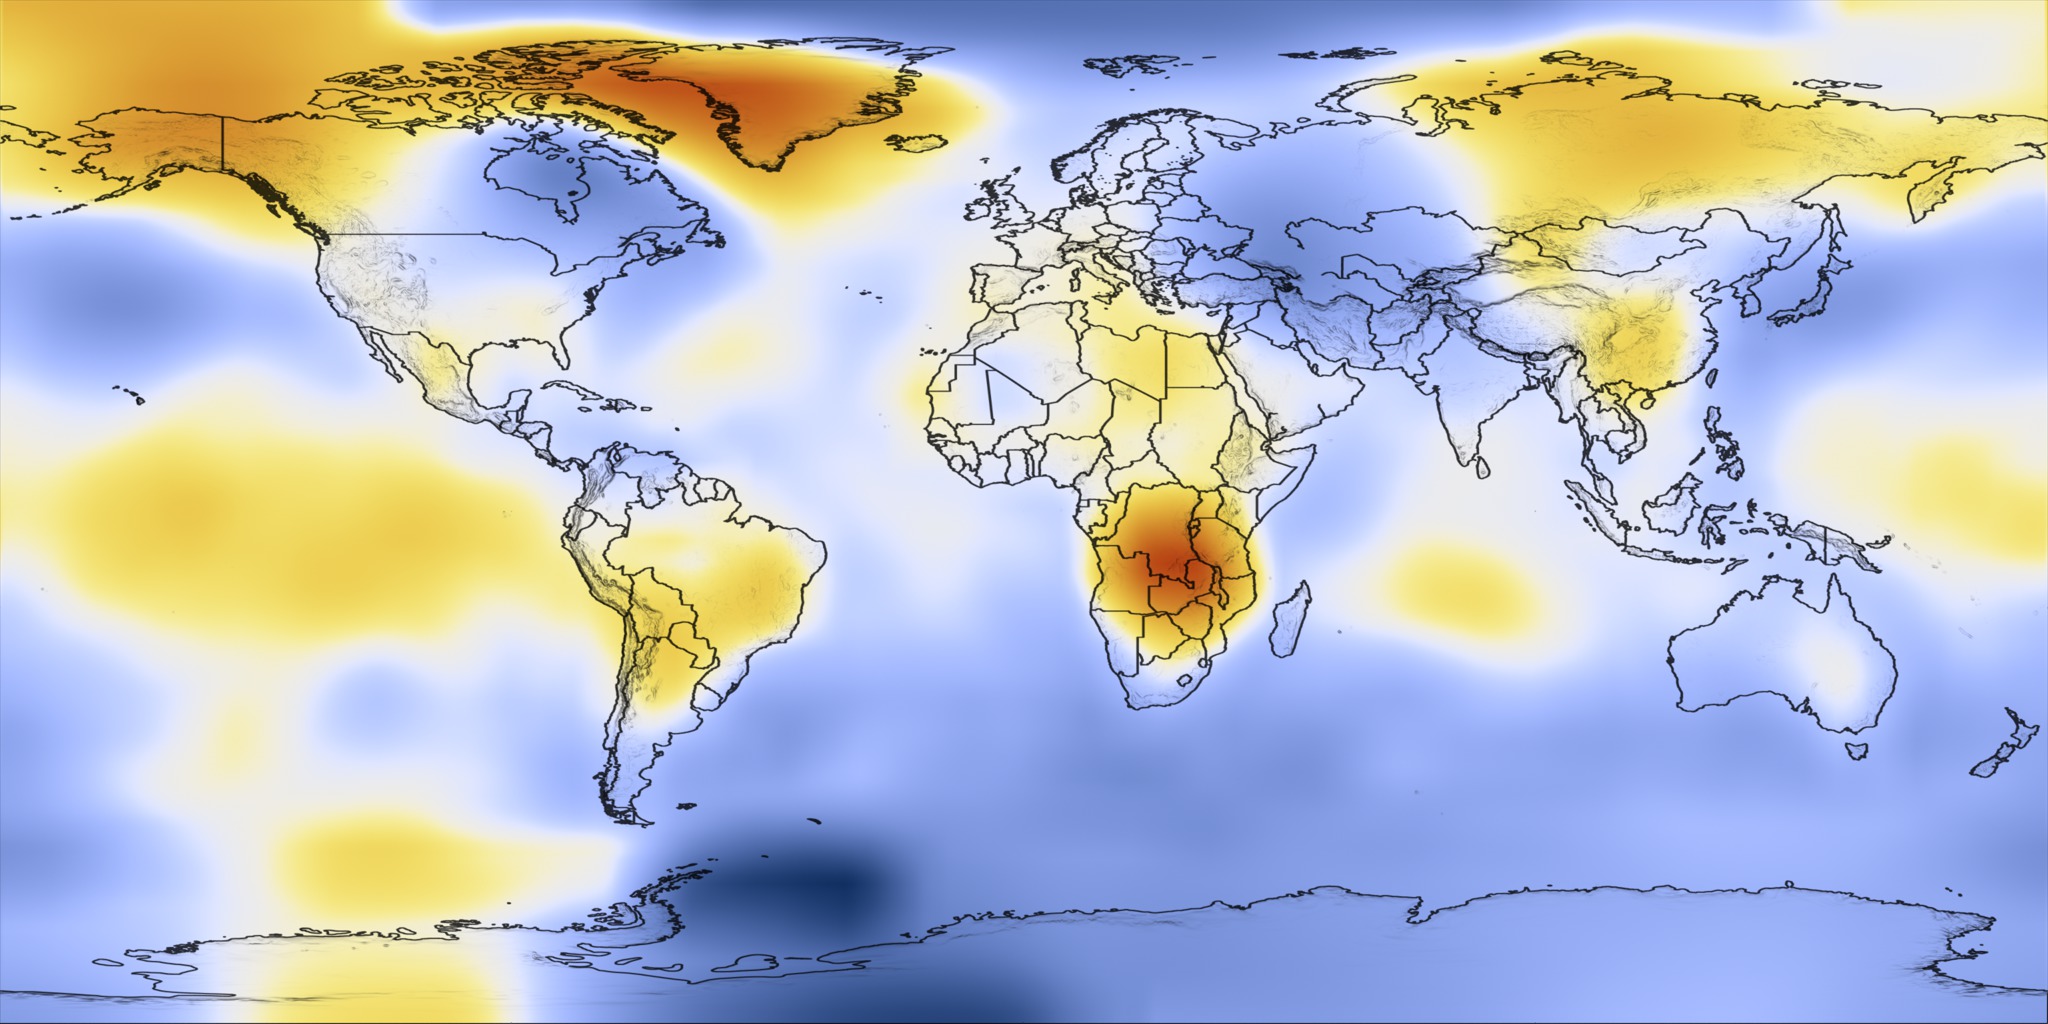
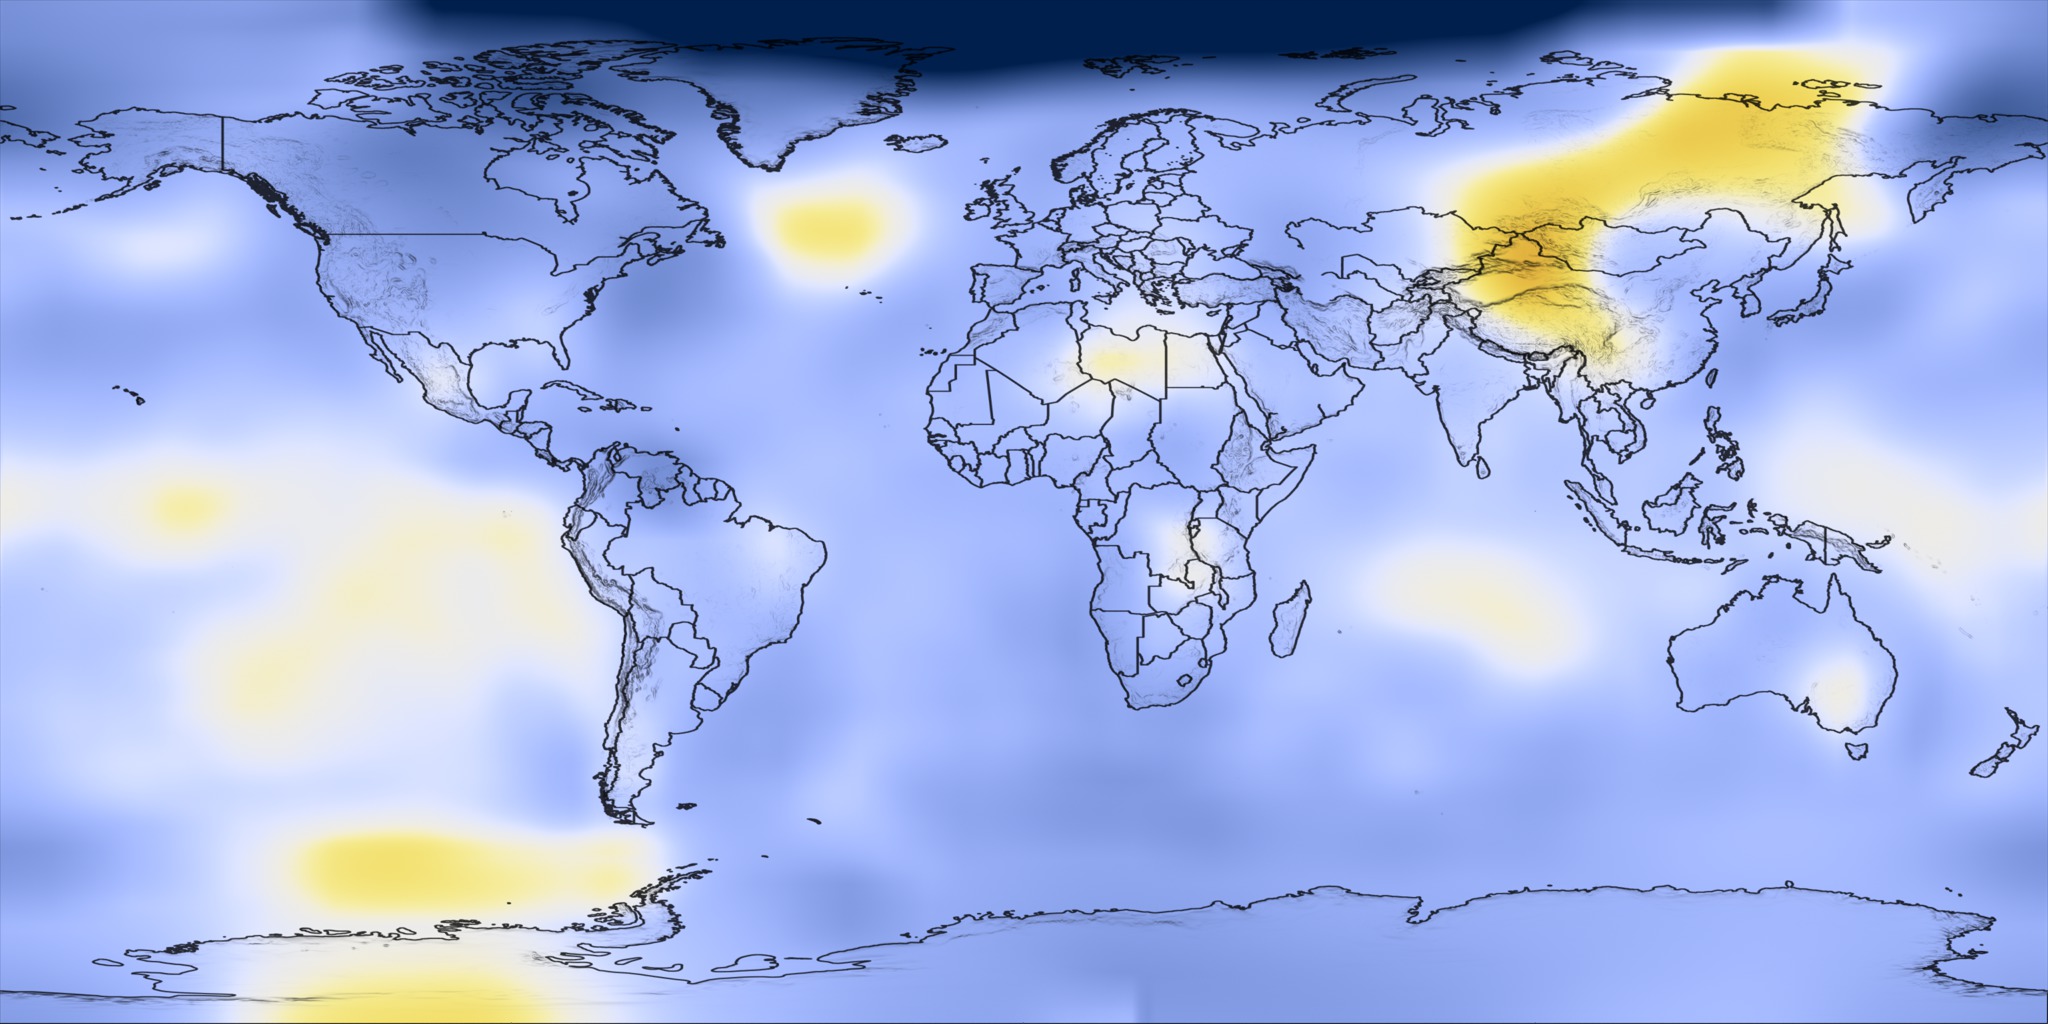
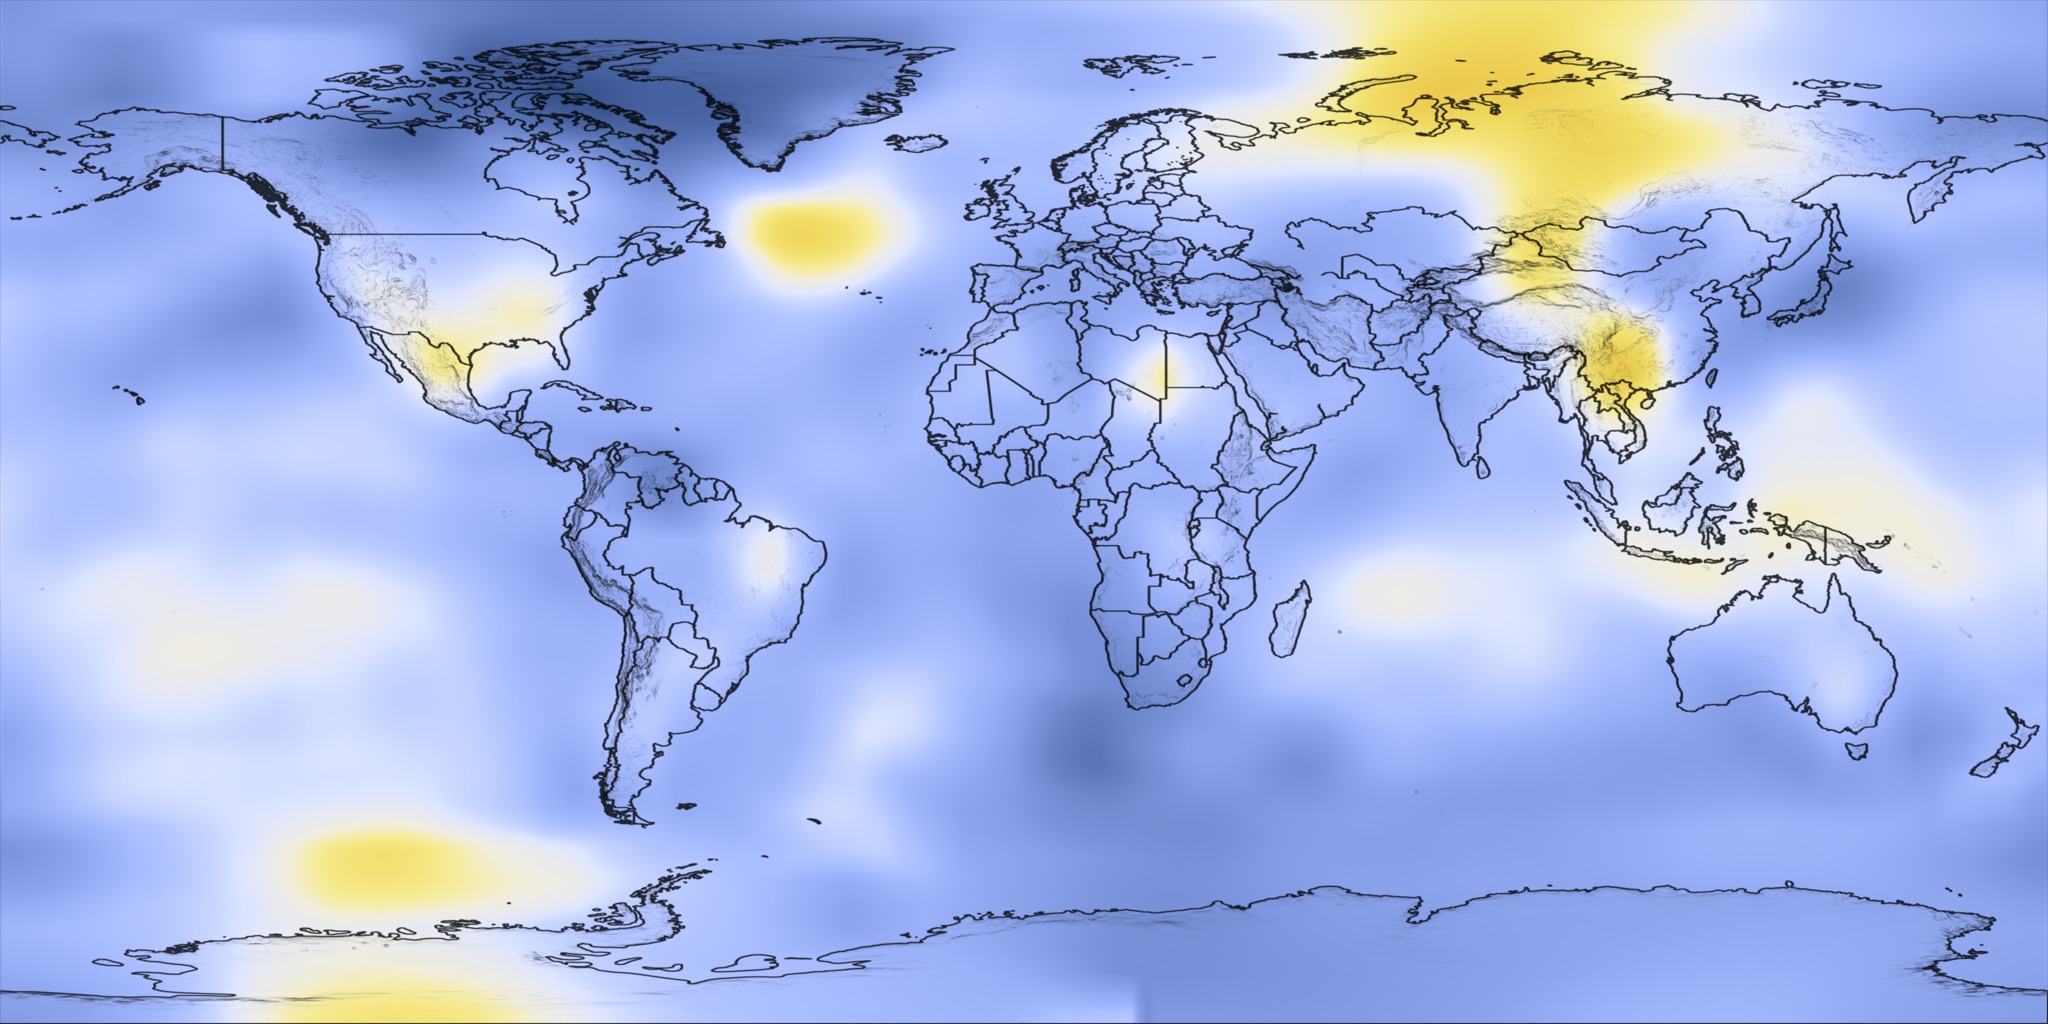
Five-Year Average Global Temperature Anomalies from 1881 to 2009 for Science On a Sphere
For more information on the data used to generate these images, please see http://data.giss.nasa.gov/gistemp.
Visualization Credits
Lori Perkins (NASA/GSFC): Lead Animator
James Hansen Ph.D. (NASA/GSFC GISS): Scientist
Makiko Sato Ph.D. (NASA/GSFC GISS): Scientist
Reto A. Ruedy Ph.D. (NASA/GSFC GISS): Scientist
Ken Lo Ph.D. (NASA/GSFC GISS): Scientist
David Lea Ph.D. (University of California, Santa Barbara): Scientist
Martin Medina-Elizade (University of California, Santa Barbara): Scientist
Please give credit for this item to:
NASA/Goddard Space Flight Center Scientific Visualization Studio Data provided by Robert B. Schmunk (NASA/GSFC GISS)
NASA/Goddard Space Flight Center Scientific Visualization Studio Data provided by Robert B. Schmunk (NASA/GSFC GISS)
Science Paper:
http://www.nasa.gov/topics/earth/features/earth_temp.html
Short URL to share this page:
https://svs.gsfc.nasa.gov/3684
Data Used:
Note: While we identify the data sets used in these visualizations, we do not store any further details nor the data sets themselves on our site.
This item is part of these series:
Global Temperature Anomalies
Agriculture Animations - Climate Change
Keywords:
SVS >> Climate
SVS >> Global Warming
SVS >> HDTV
DLESE >> Physical oceanography
SVS >> Surface Temperature
GCMD >> Earth Science >> Biosphere >> Ecological Dynamics >> Extinction
GCMD >> Earth Science >> Climate Indicators >> Teleconnections >> El Nino Southern Oscillation
GCMD >> Earth Science >> Oceans >> Coastal Processes >> Sea Level Rise
SVS >> Model Data
SVS >> iPod
SVS >> Science On a Sphere
SVS >> For Educators
NASA Science >> Earth
GCMD keywords can be found on the Internet with the following citation: Olsen, L.M., G. Major, K. Shein, J. Scialdone, S. Ritz, T. Stevens, M. Morahan, A. Aleman, R. Vogel, S. Leicester, H. Weir, M. Meaux, S. Grebas, C.Solomon, M. Holland, T. Northcutt, R. A. Restrepo, R. Bilodeau, 2013. NASA/Global Change Master Directory (GCMD) Earth Science Keywords. Version 8.0.0.0.0
http://www.nasa.gov/topics/earth/features/earth_temp.html
Short URL to share this page:
https://svs.gsfc.nasa.gov/3684
Data Used:
GISS Surface Temperature Analysis (GISTEMP)/GISTEMP
Model - NASA/GISSThis item is part of these series:
Global Temperature Anomalies
Agriculture Animations - Climate Change
Keywords:
SVS >> Climate
SVS >> Global Warming
SVS >> HDTV
DLESE >> Physical oceanography
SVS >> Surface Temperature
GCMD >> Earth Science >> Biosphere >> Ecological Dynamics >> Extinction
GCMD >> Earth Science >> Climate Indicators >> Teleconnections >> El Nino Southern Oscillation
GCMD >> Earth Science >> Oceans >> Coastal Processes >> Sea Level Rise
SVS >> Model Data
SVS >> iPod
SVS >> Science On a Sphere
SVS >> For Educators
NASA Science >> Earth
GCMD keywords can be found on the Internet with the following citation: Olsen, L.M., G. Major, K. Shein, J. Scialdone, S. Ritz, T. Stevens, M. Morahan, A. Aleman, R. Vogel, S. Leicester, H. Weir, M. Meaux, S. Grebas, C.Solomon, M. Holland, T. Northcutt, R. A. Restrepo, R. Bilodeau, 2013. NASA/Global Change Master Directory (GCMD) Earth Science Keywords. Version 8.0.0.0.0


