Earth
ID: 3659
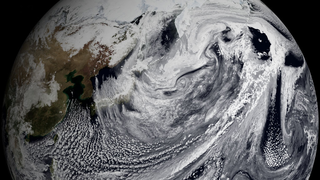
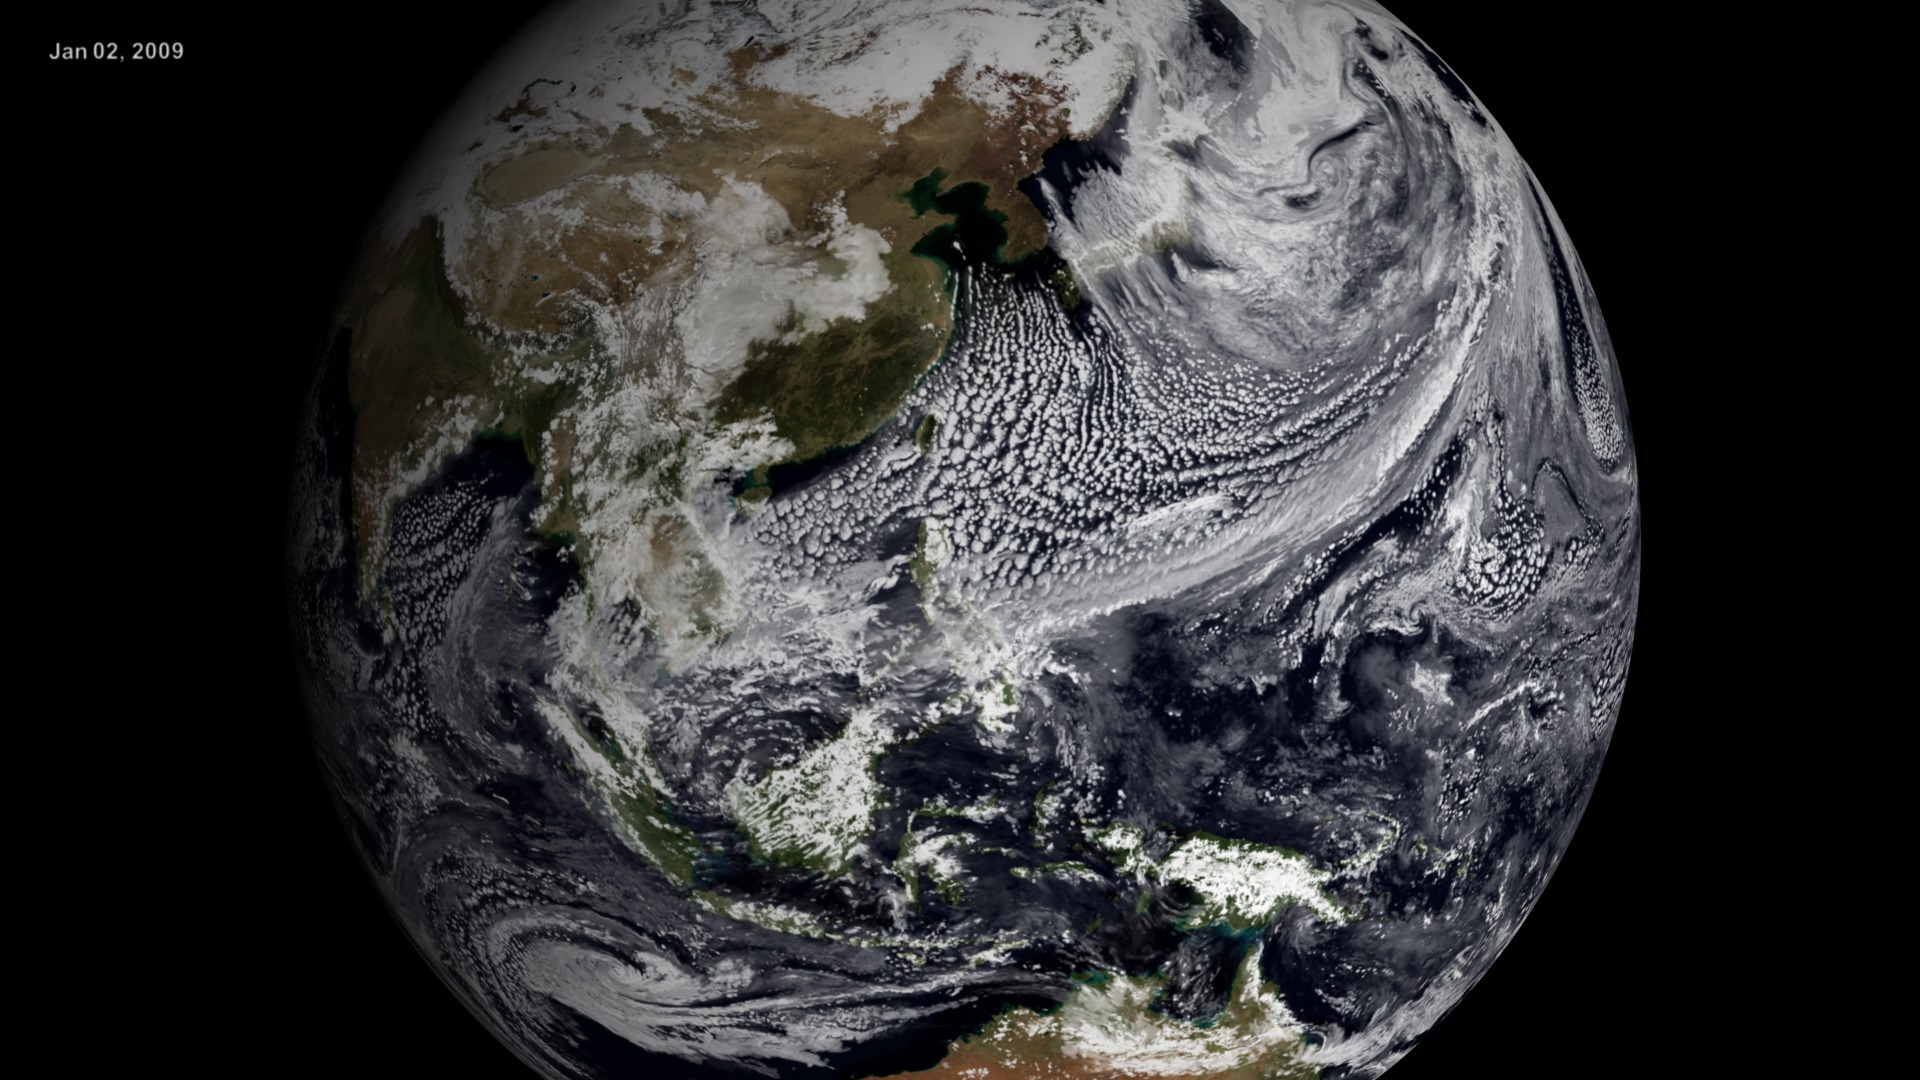
This visualization shows clouds from a simulation using the Goddard Earth Observing System Model, Verison 5 (GEOS-5). The global atmospheric simulation ran at 3.5 km per grid cell and covered a single day: January 2, 2009. The model output the results at 10 minute intervals. Since there is only one day of simulation data, the sequence of clouds repeats several times. The white flash indicates the sequence is about to repeat.
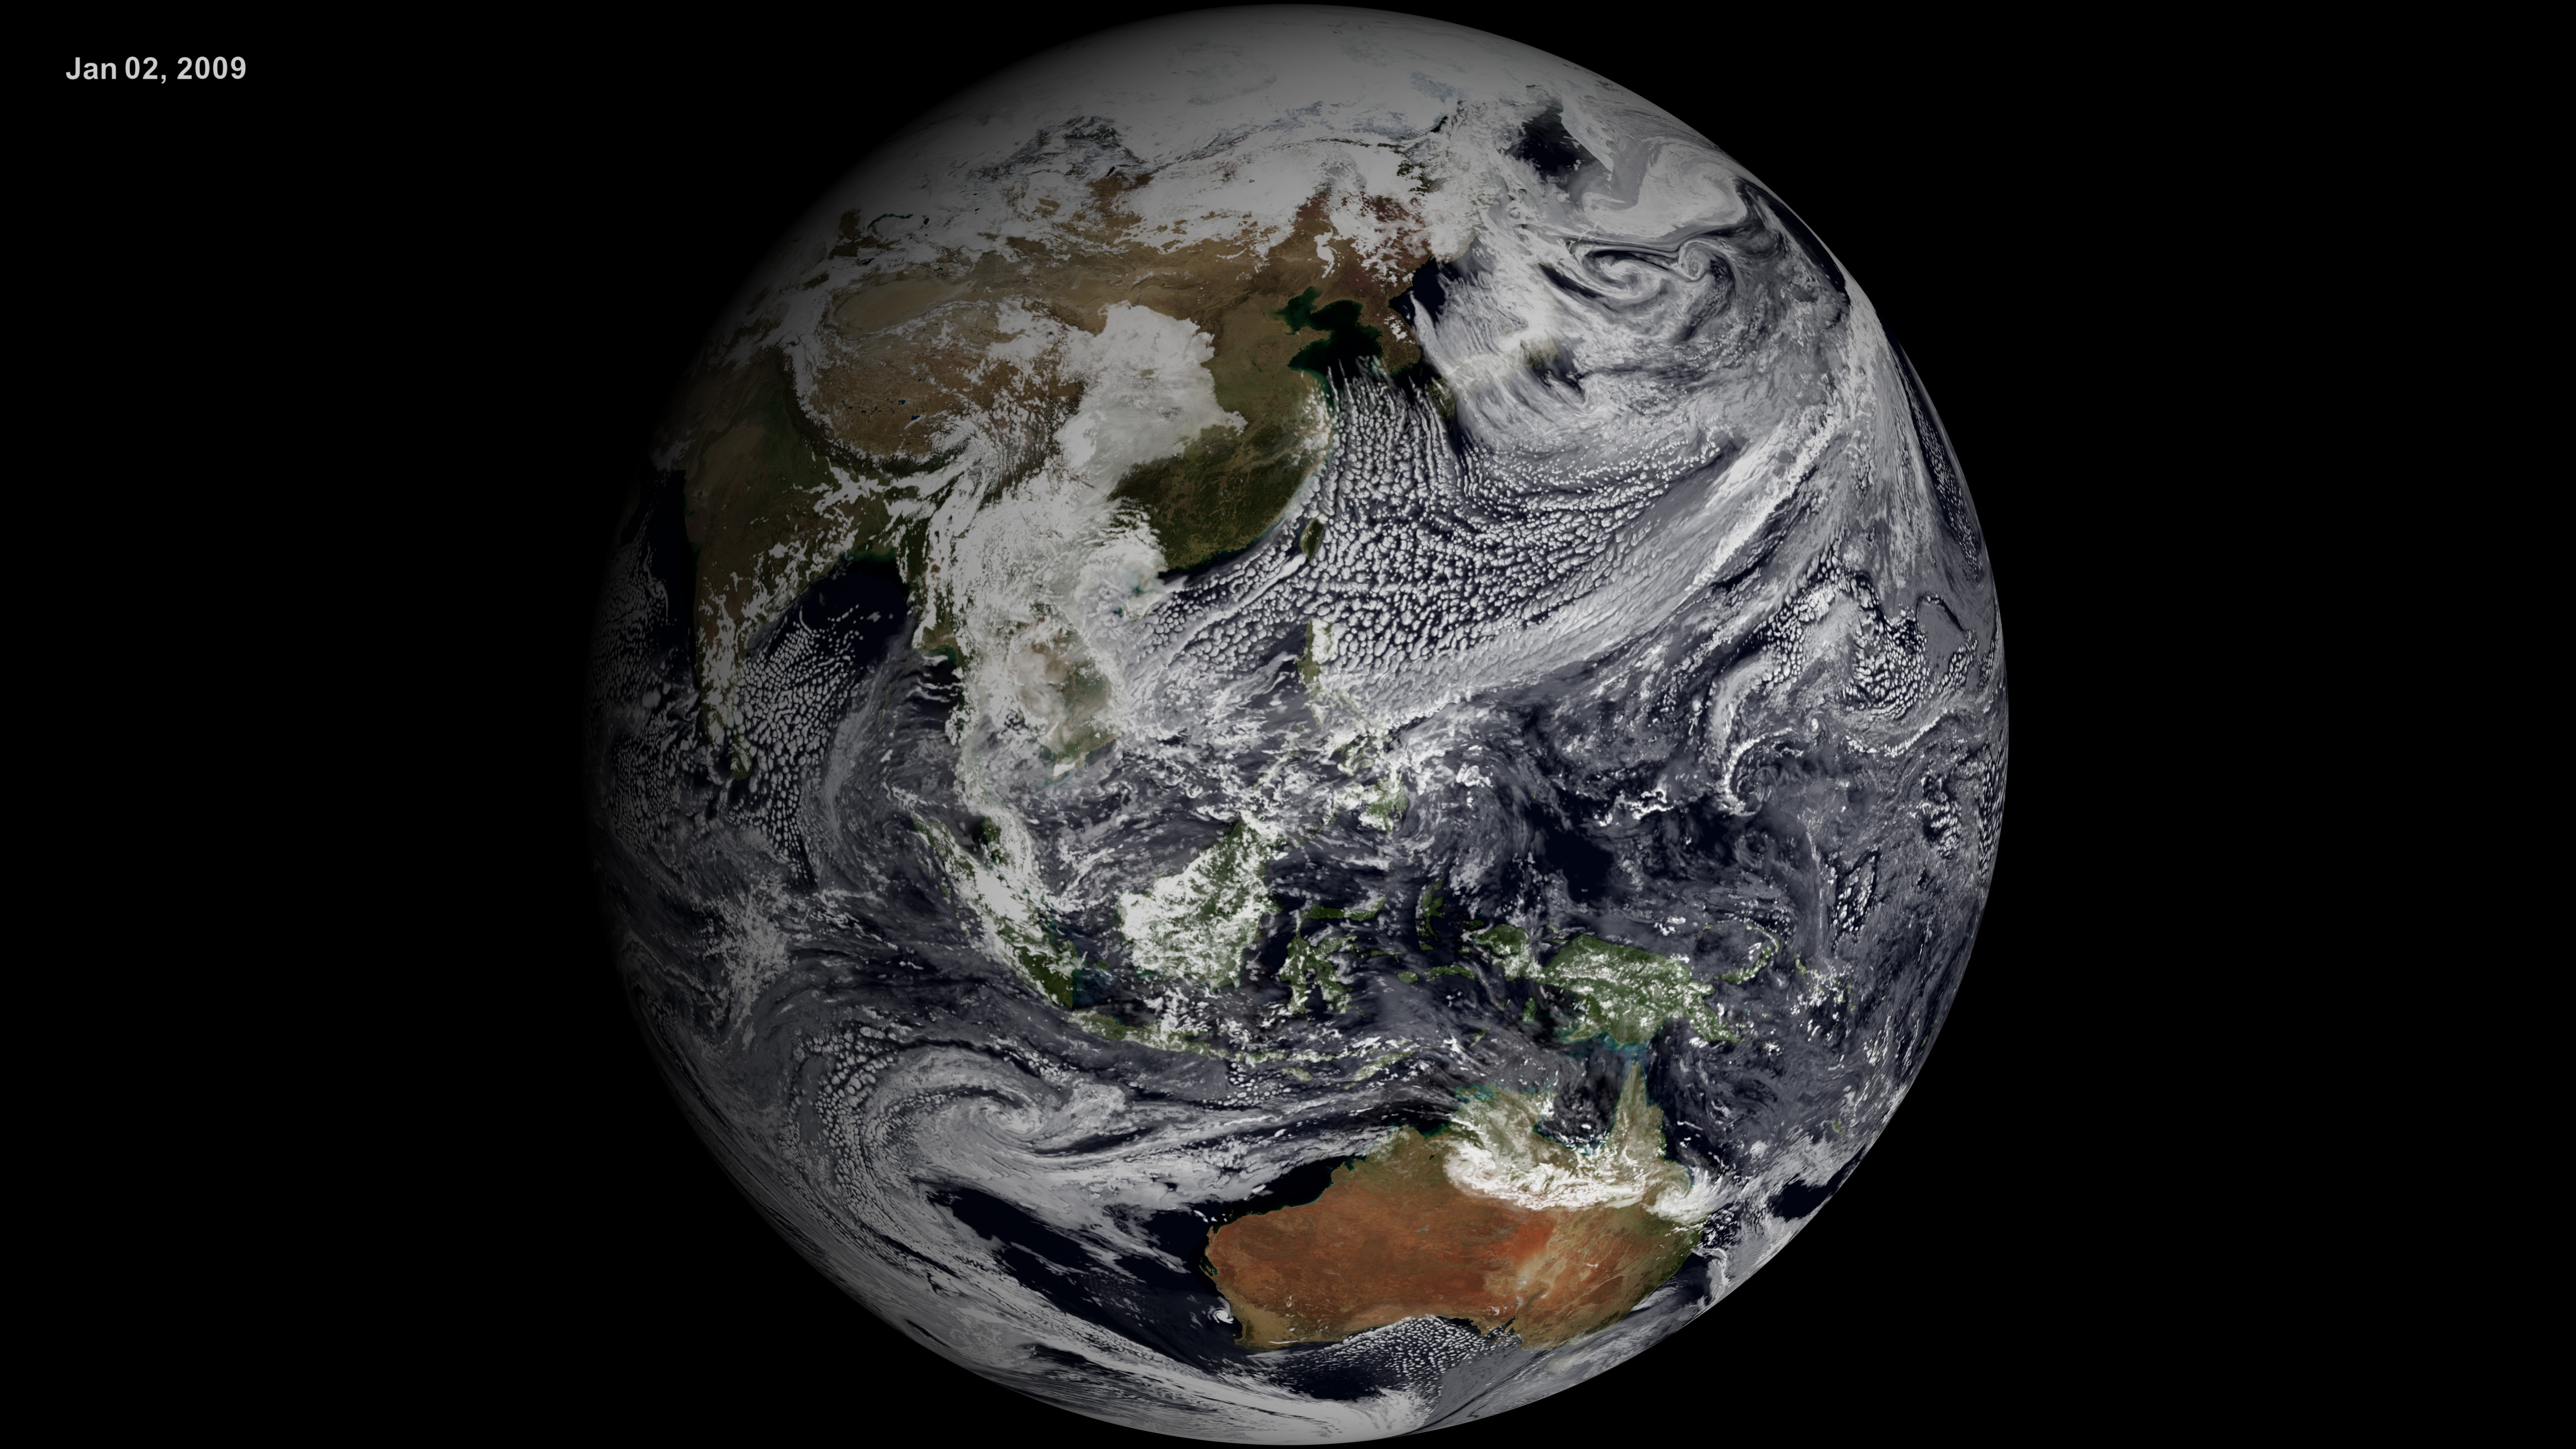
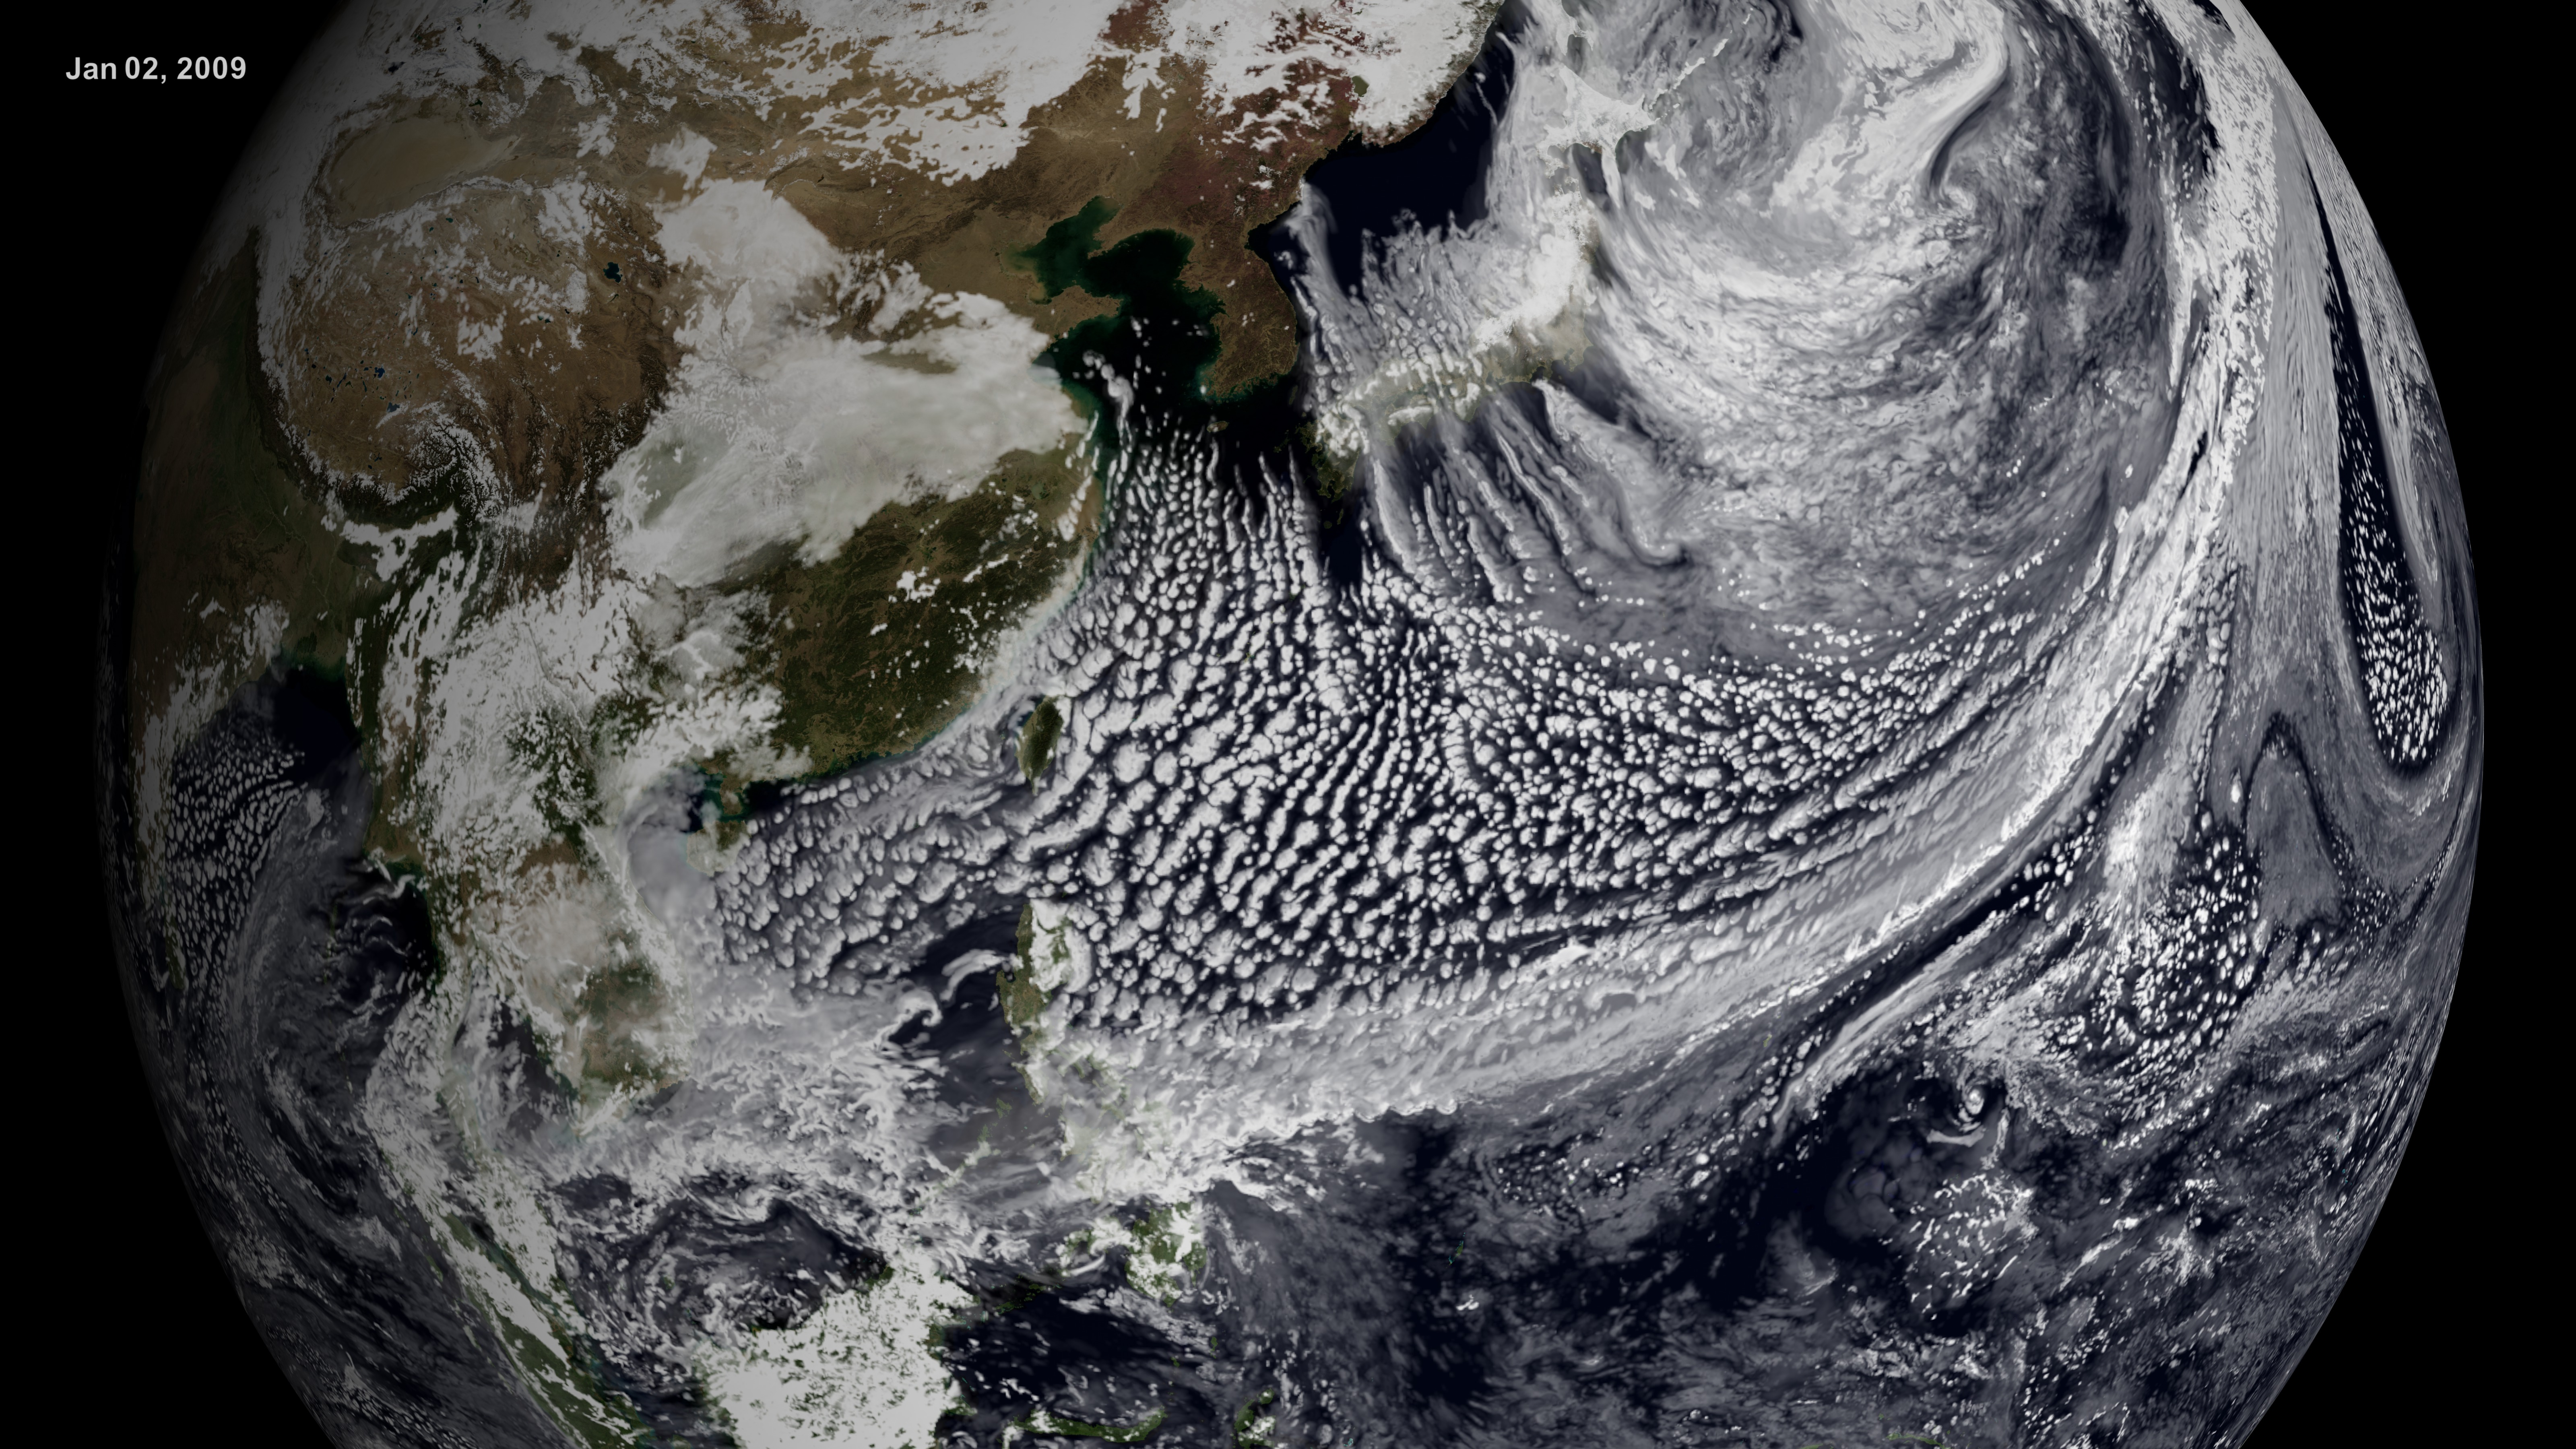
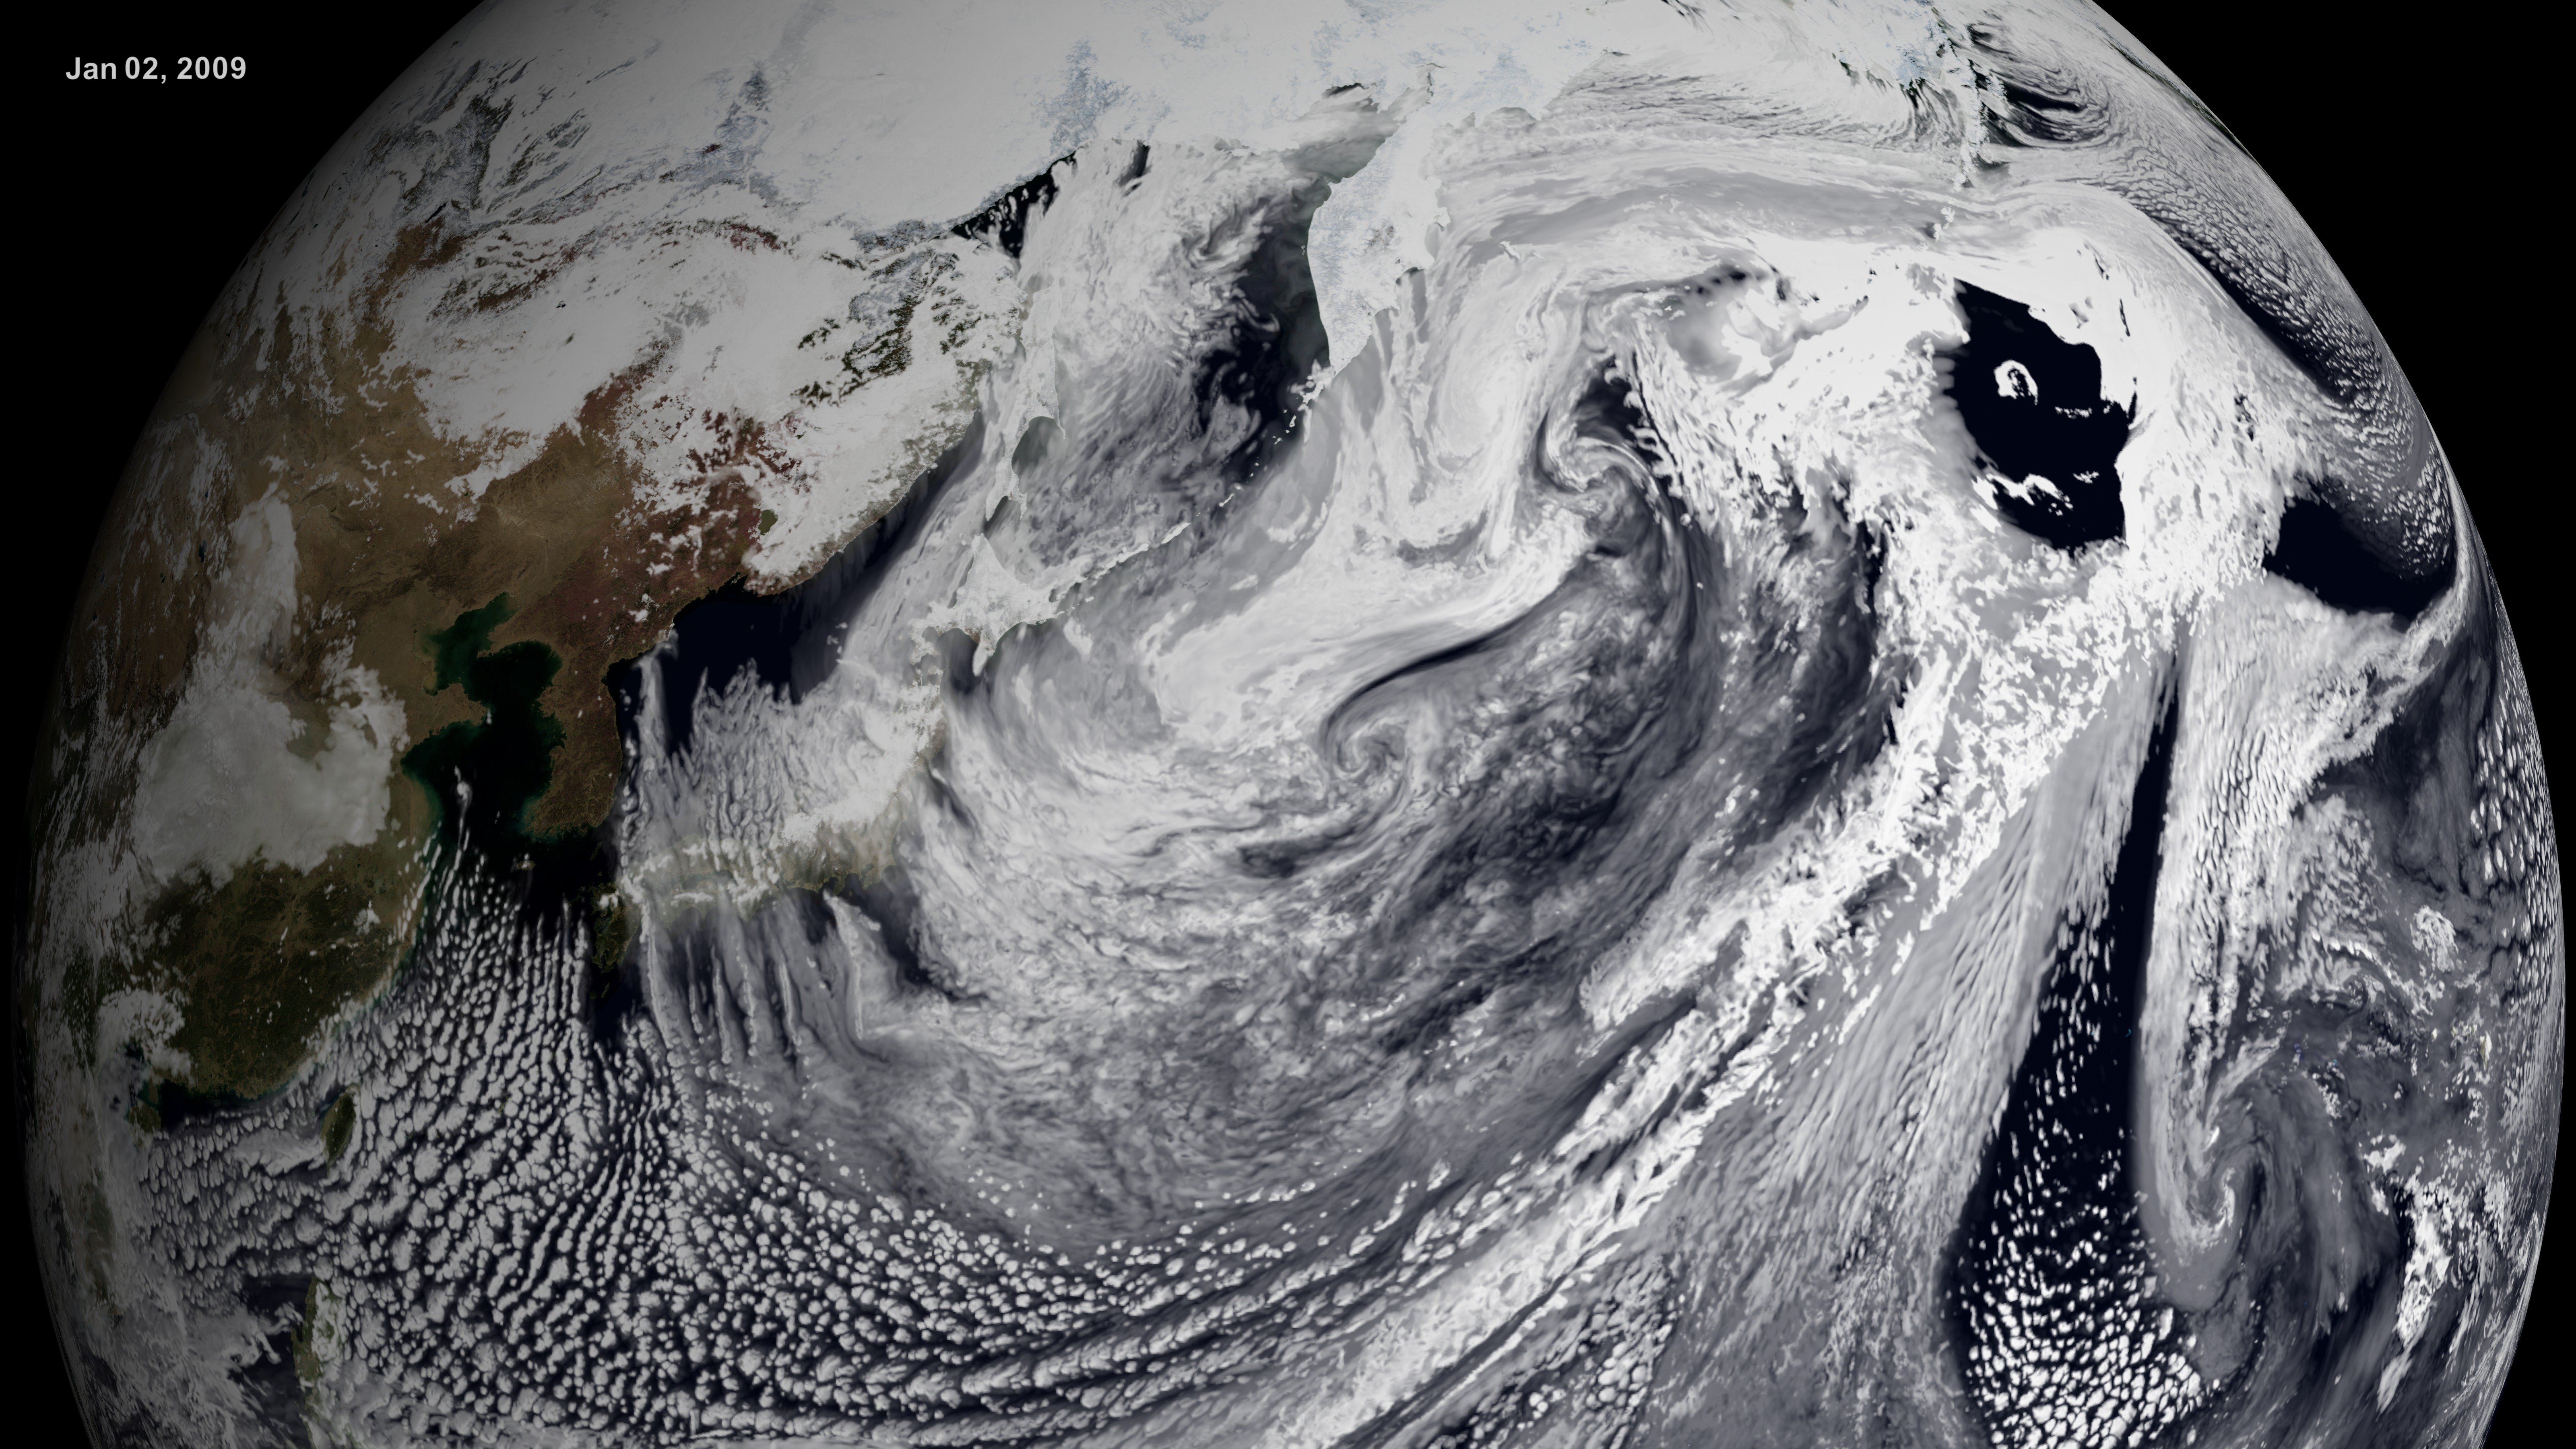
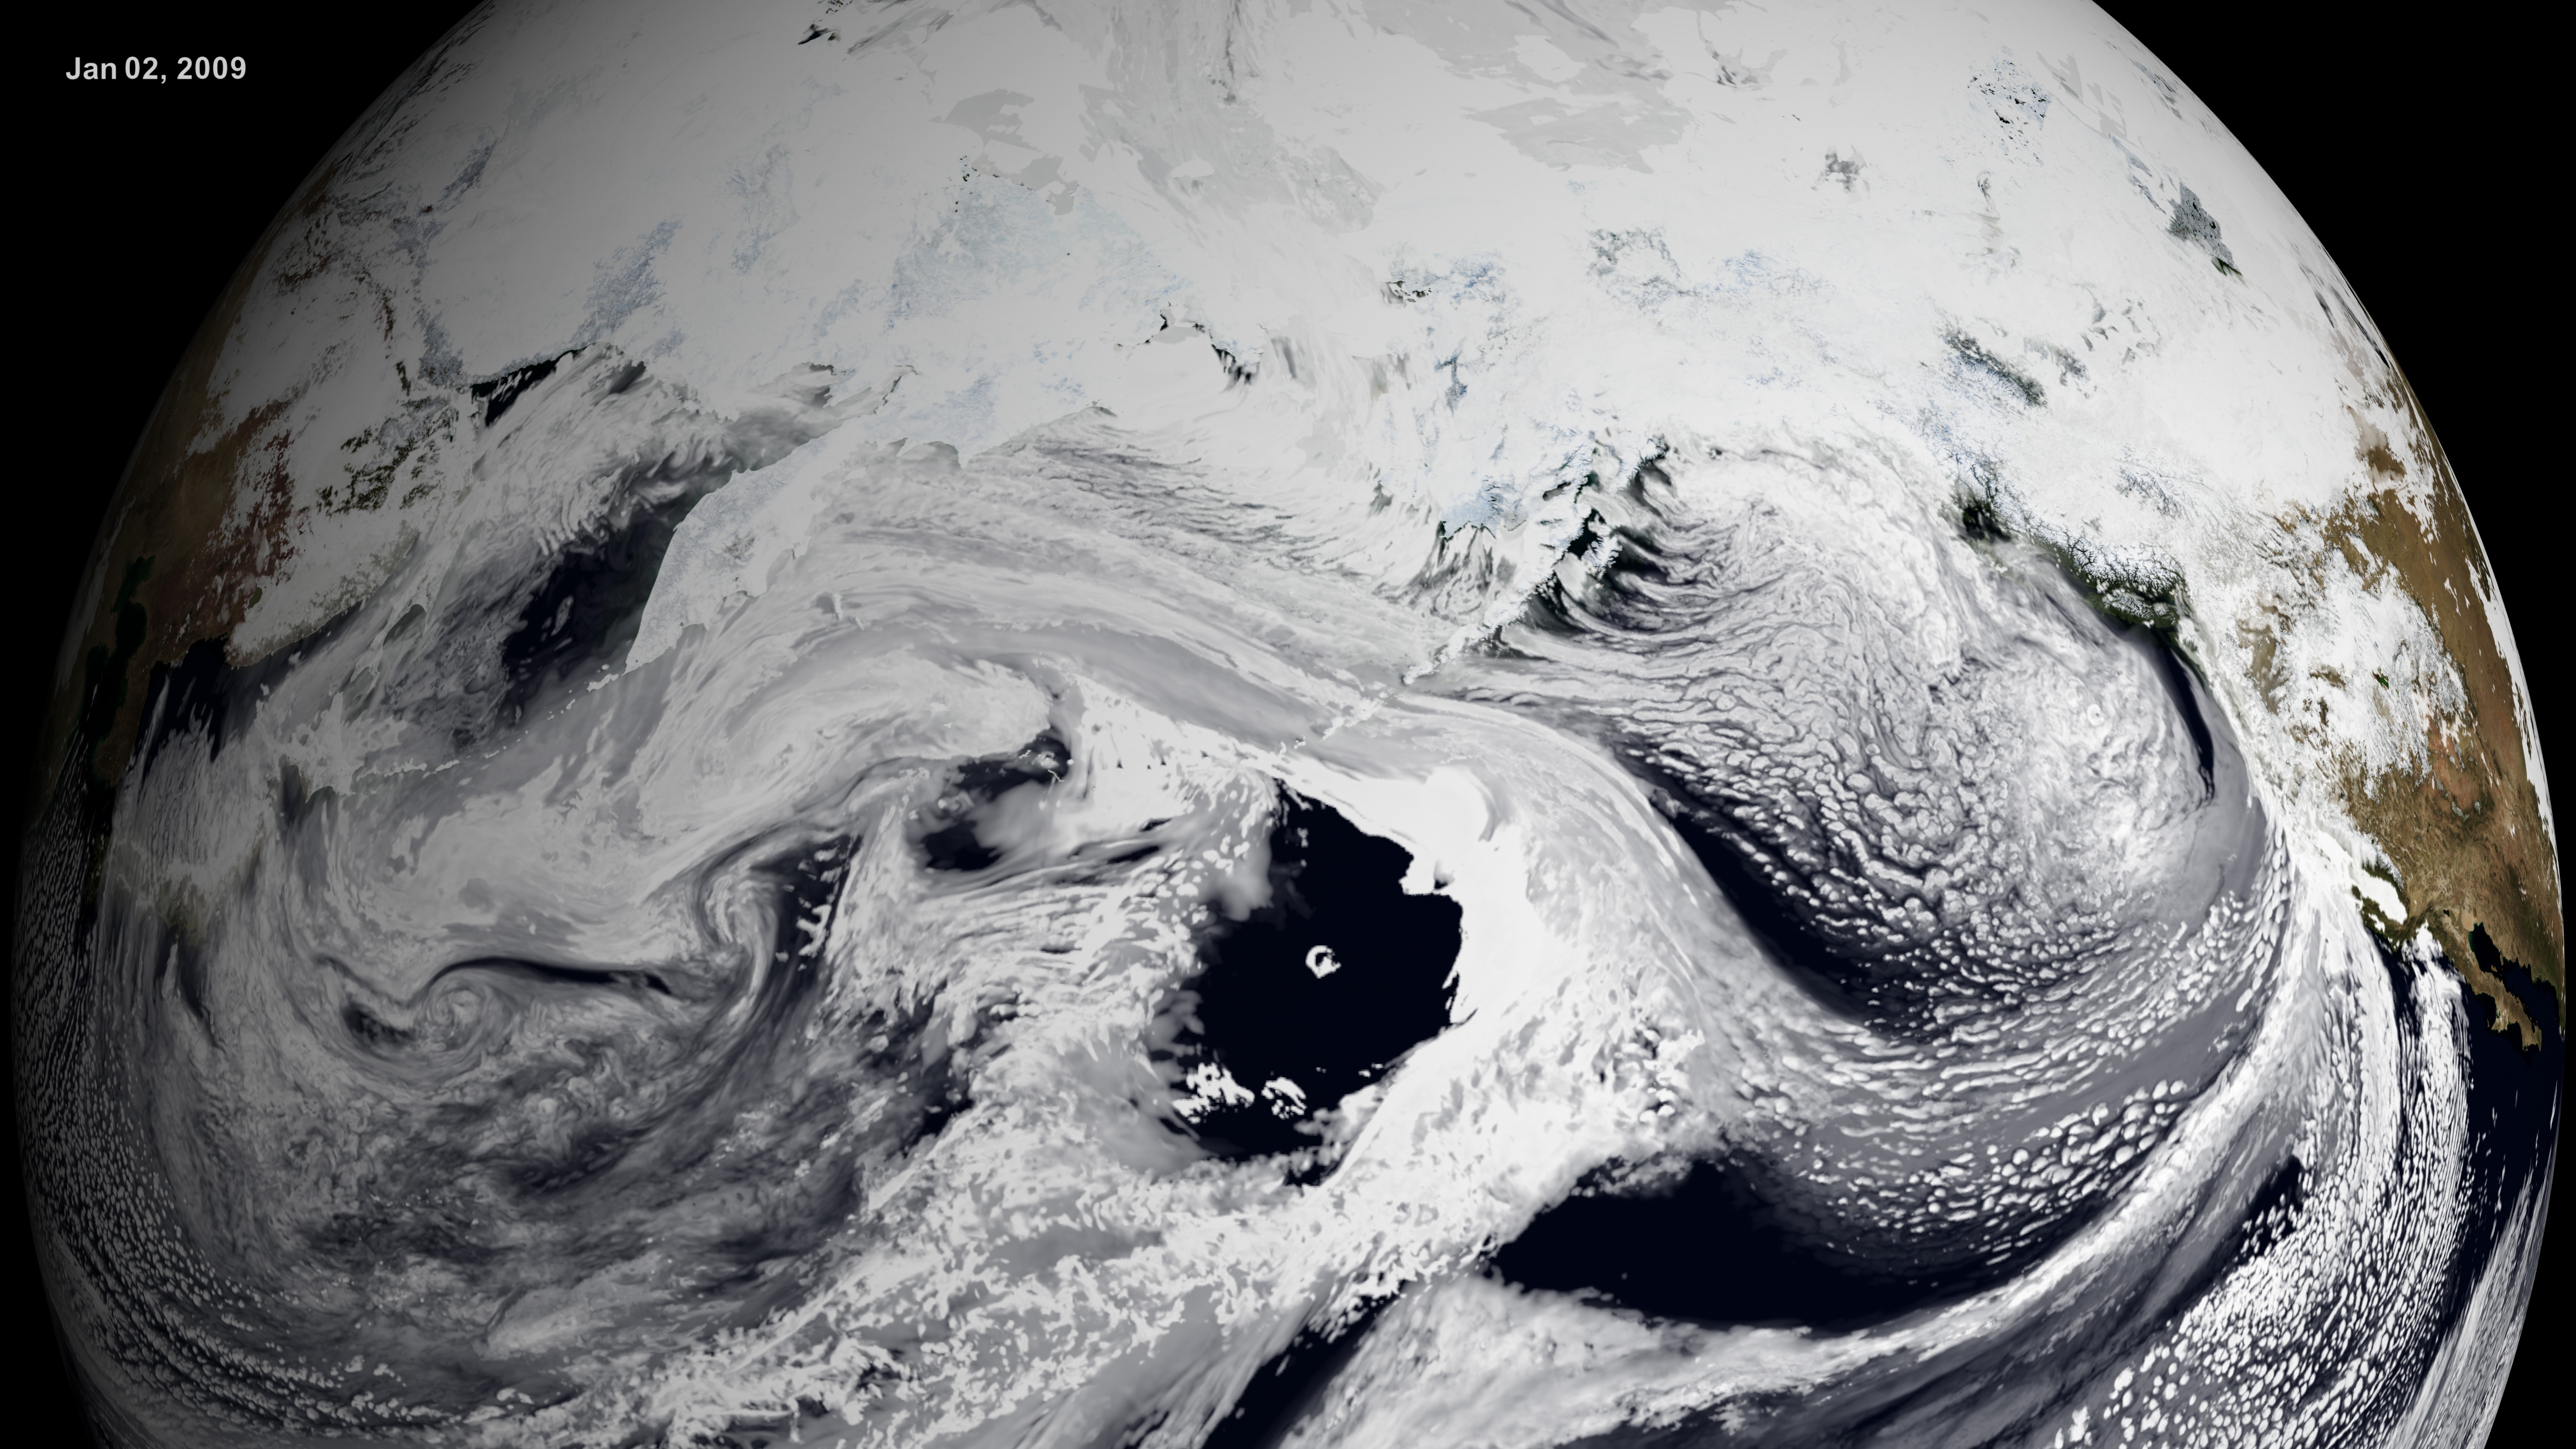
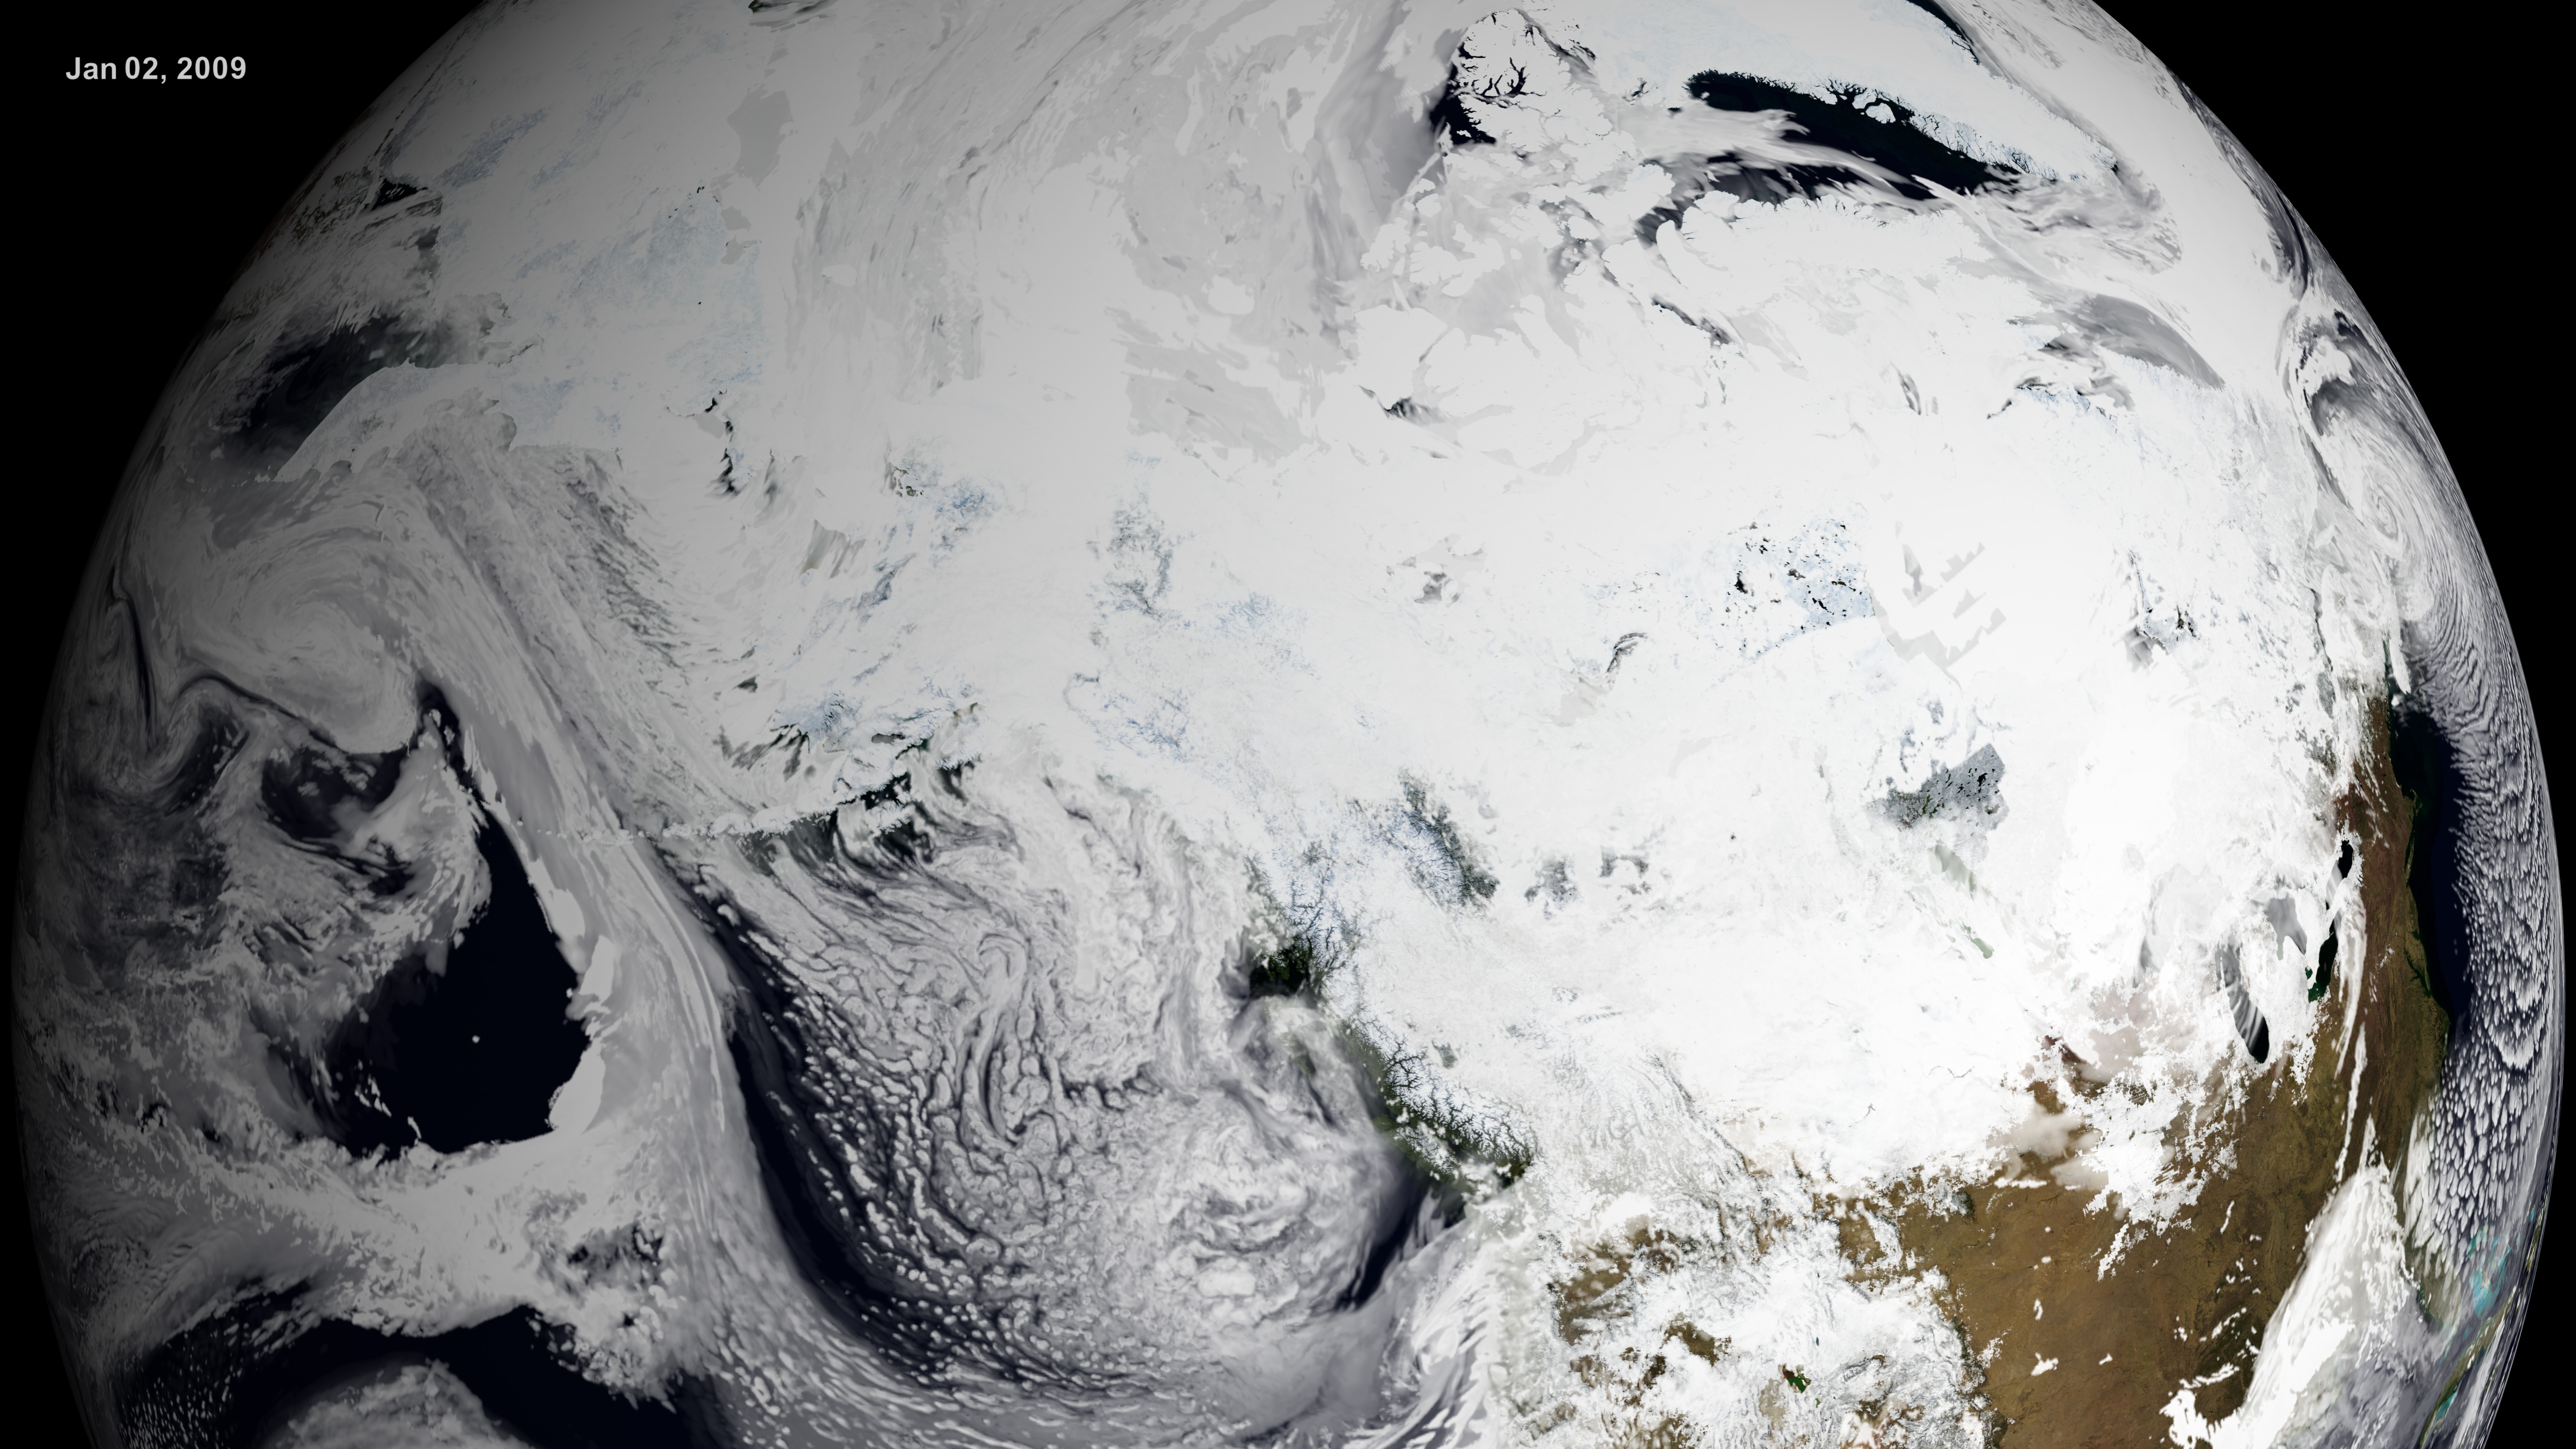
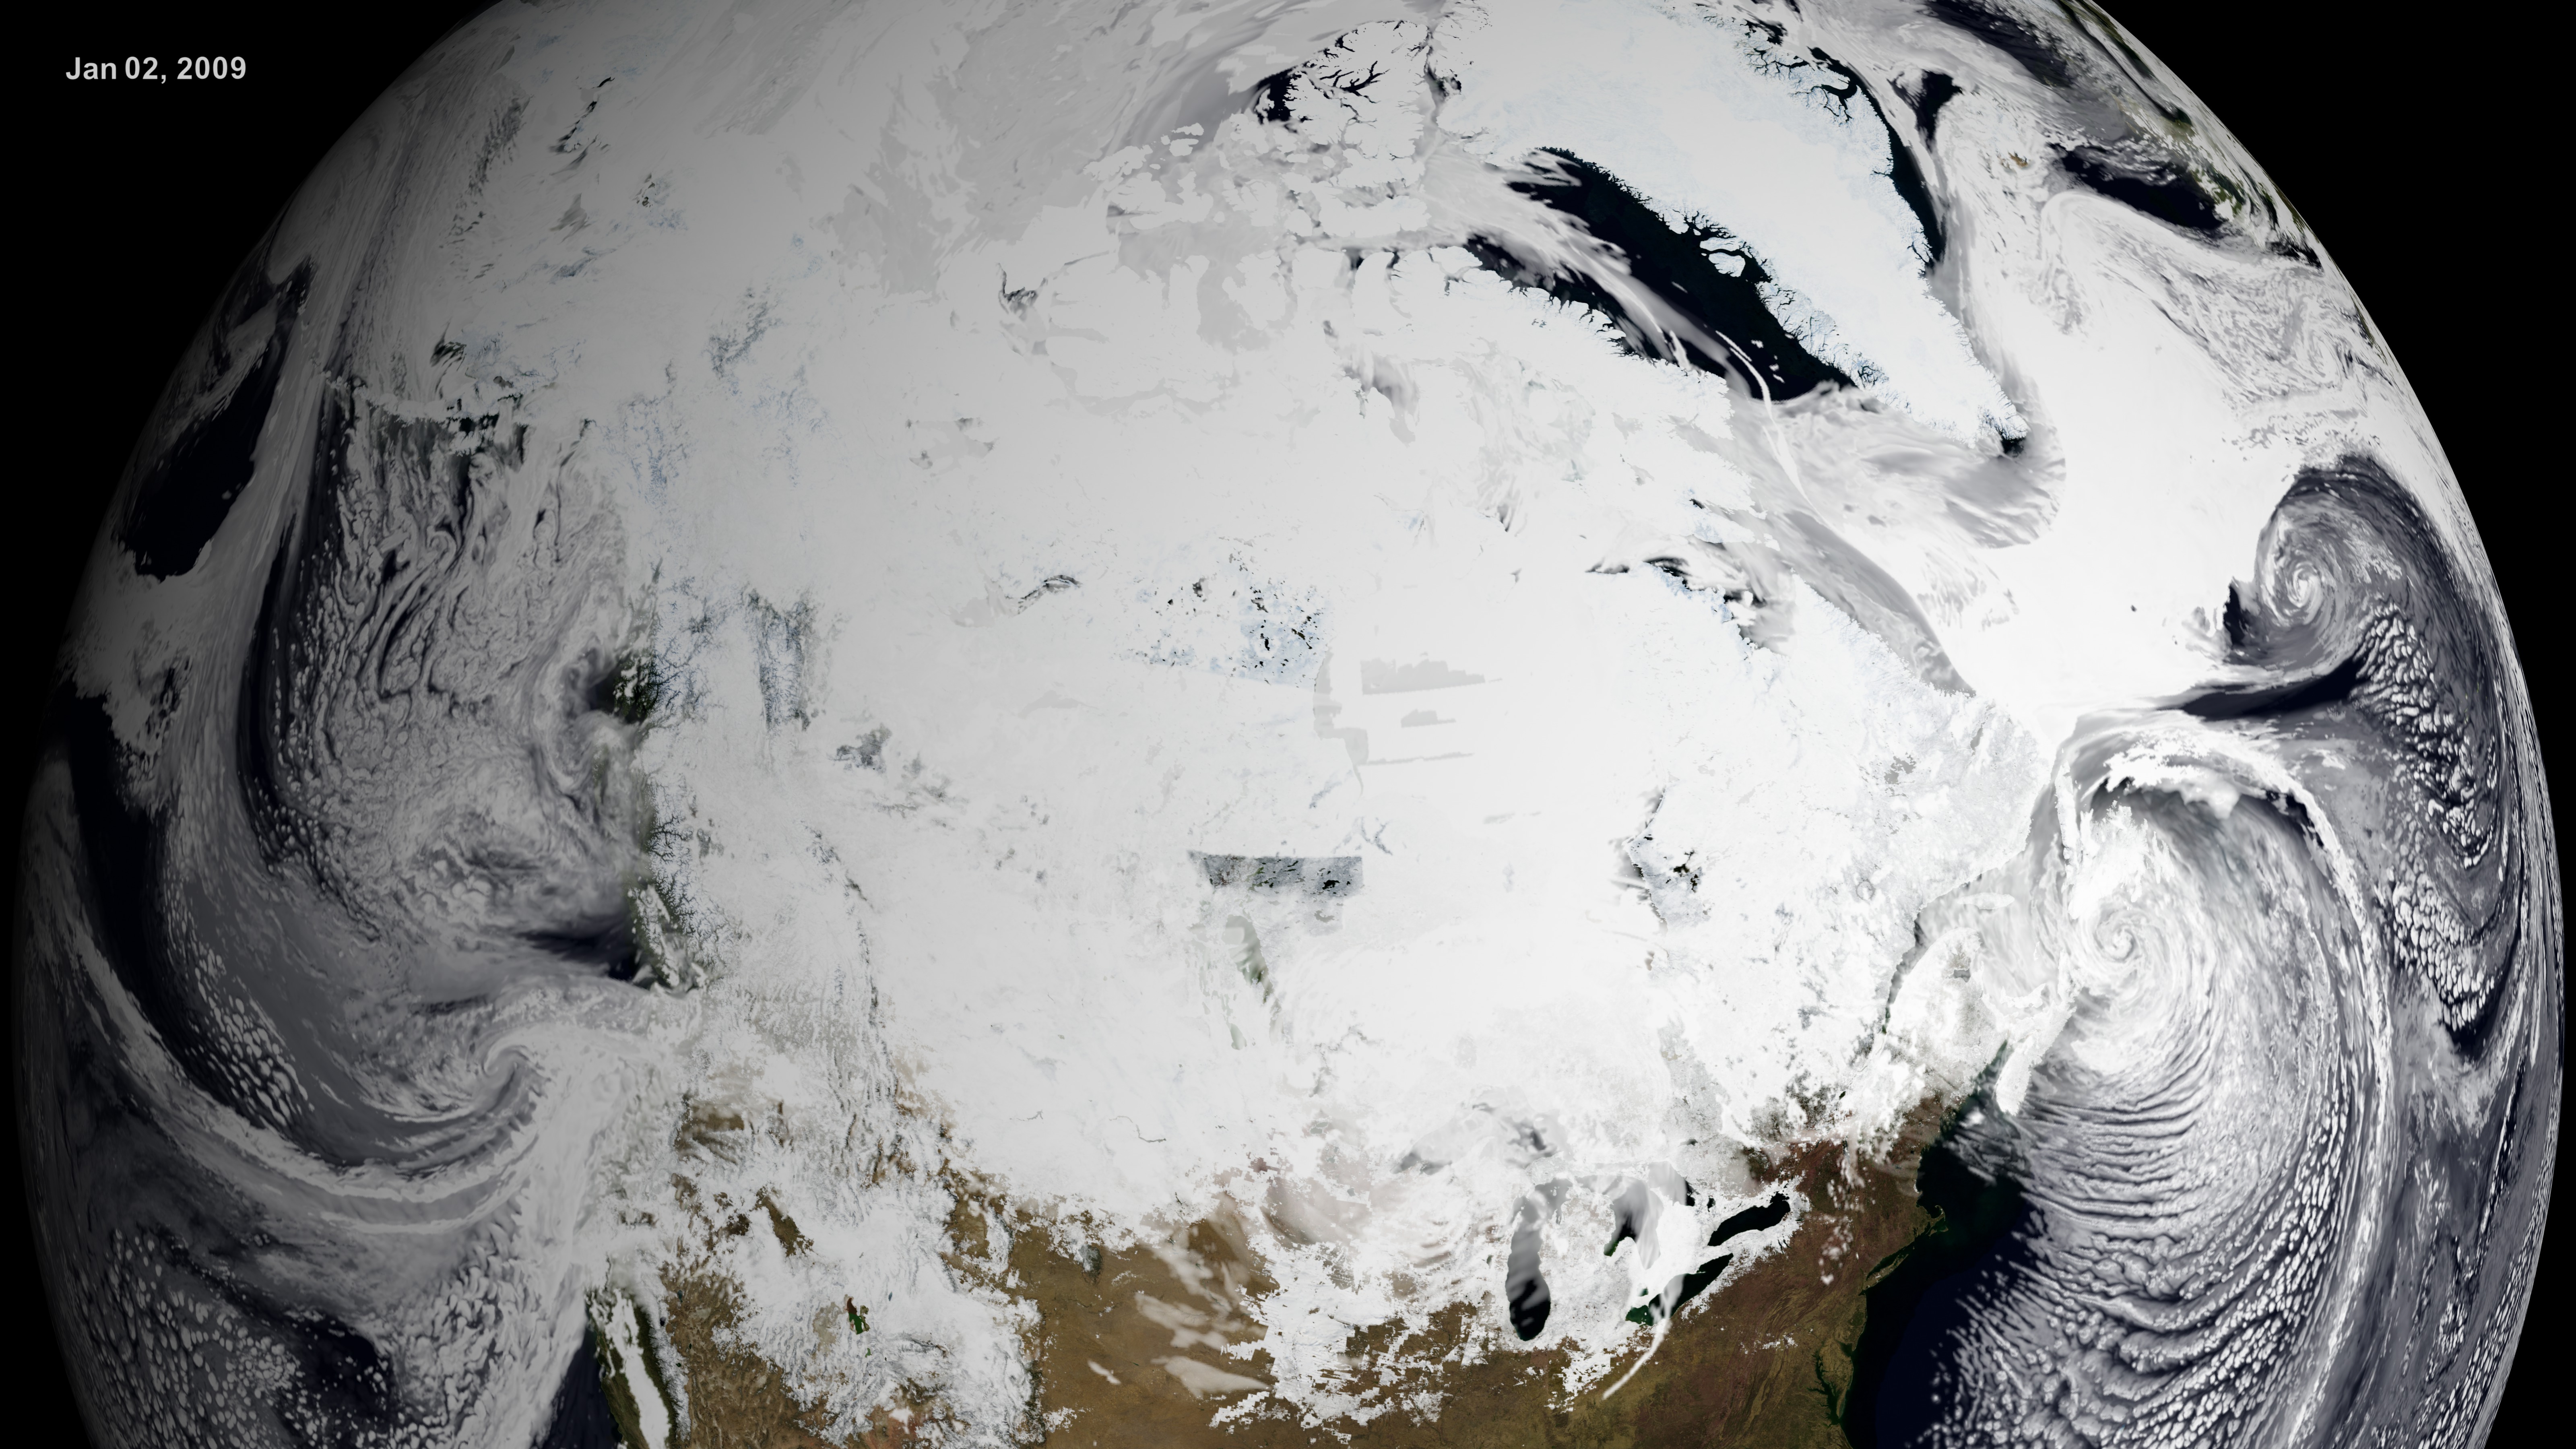
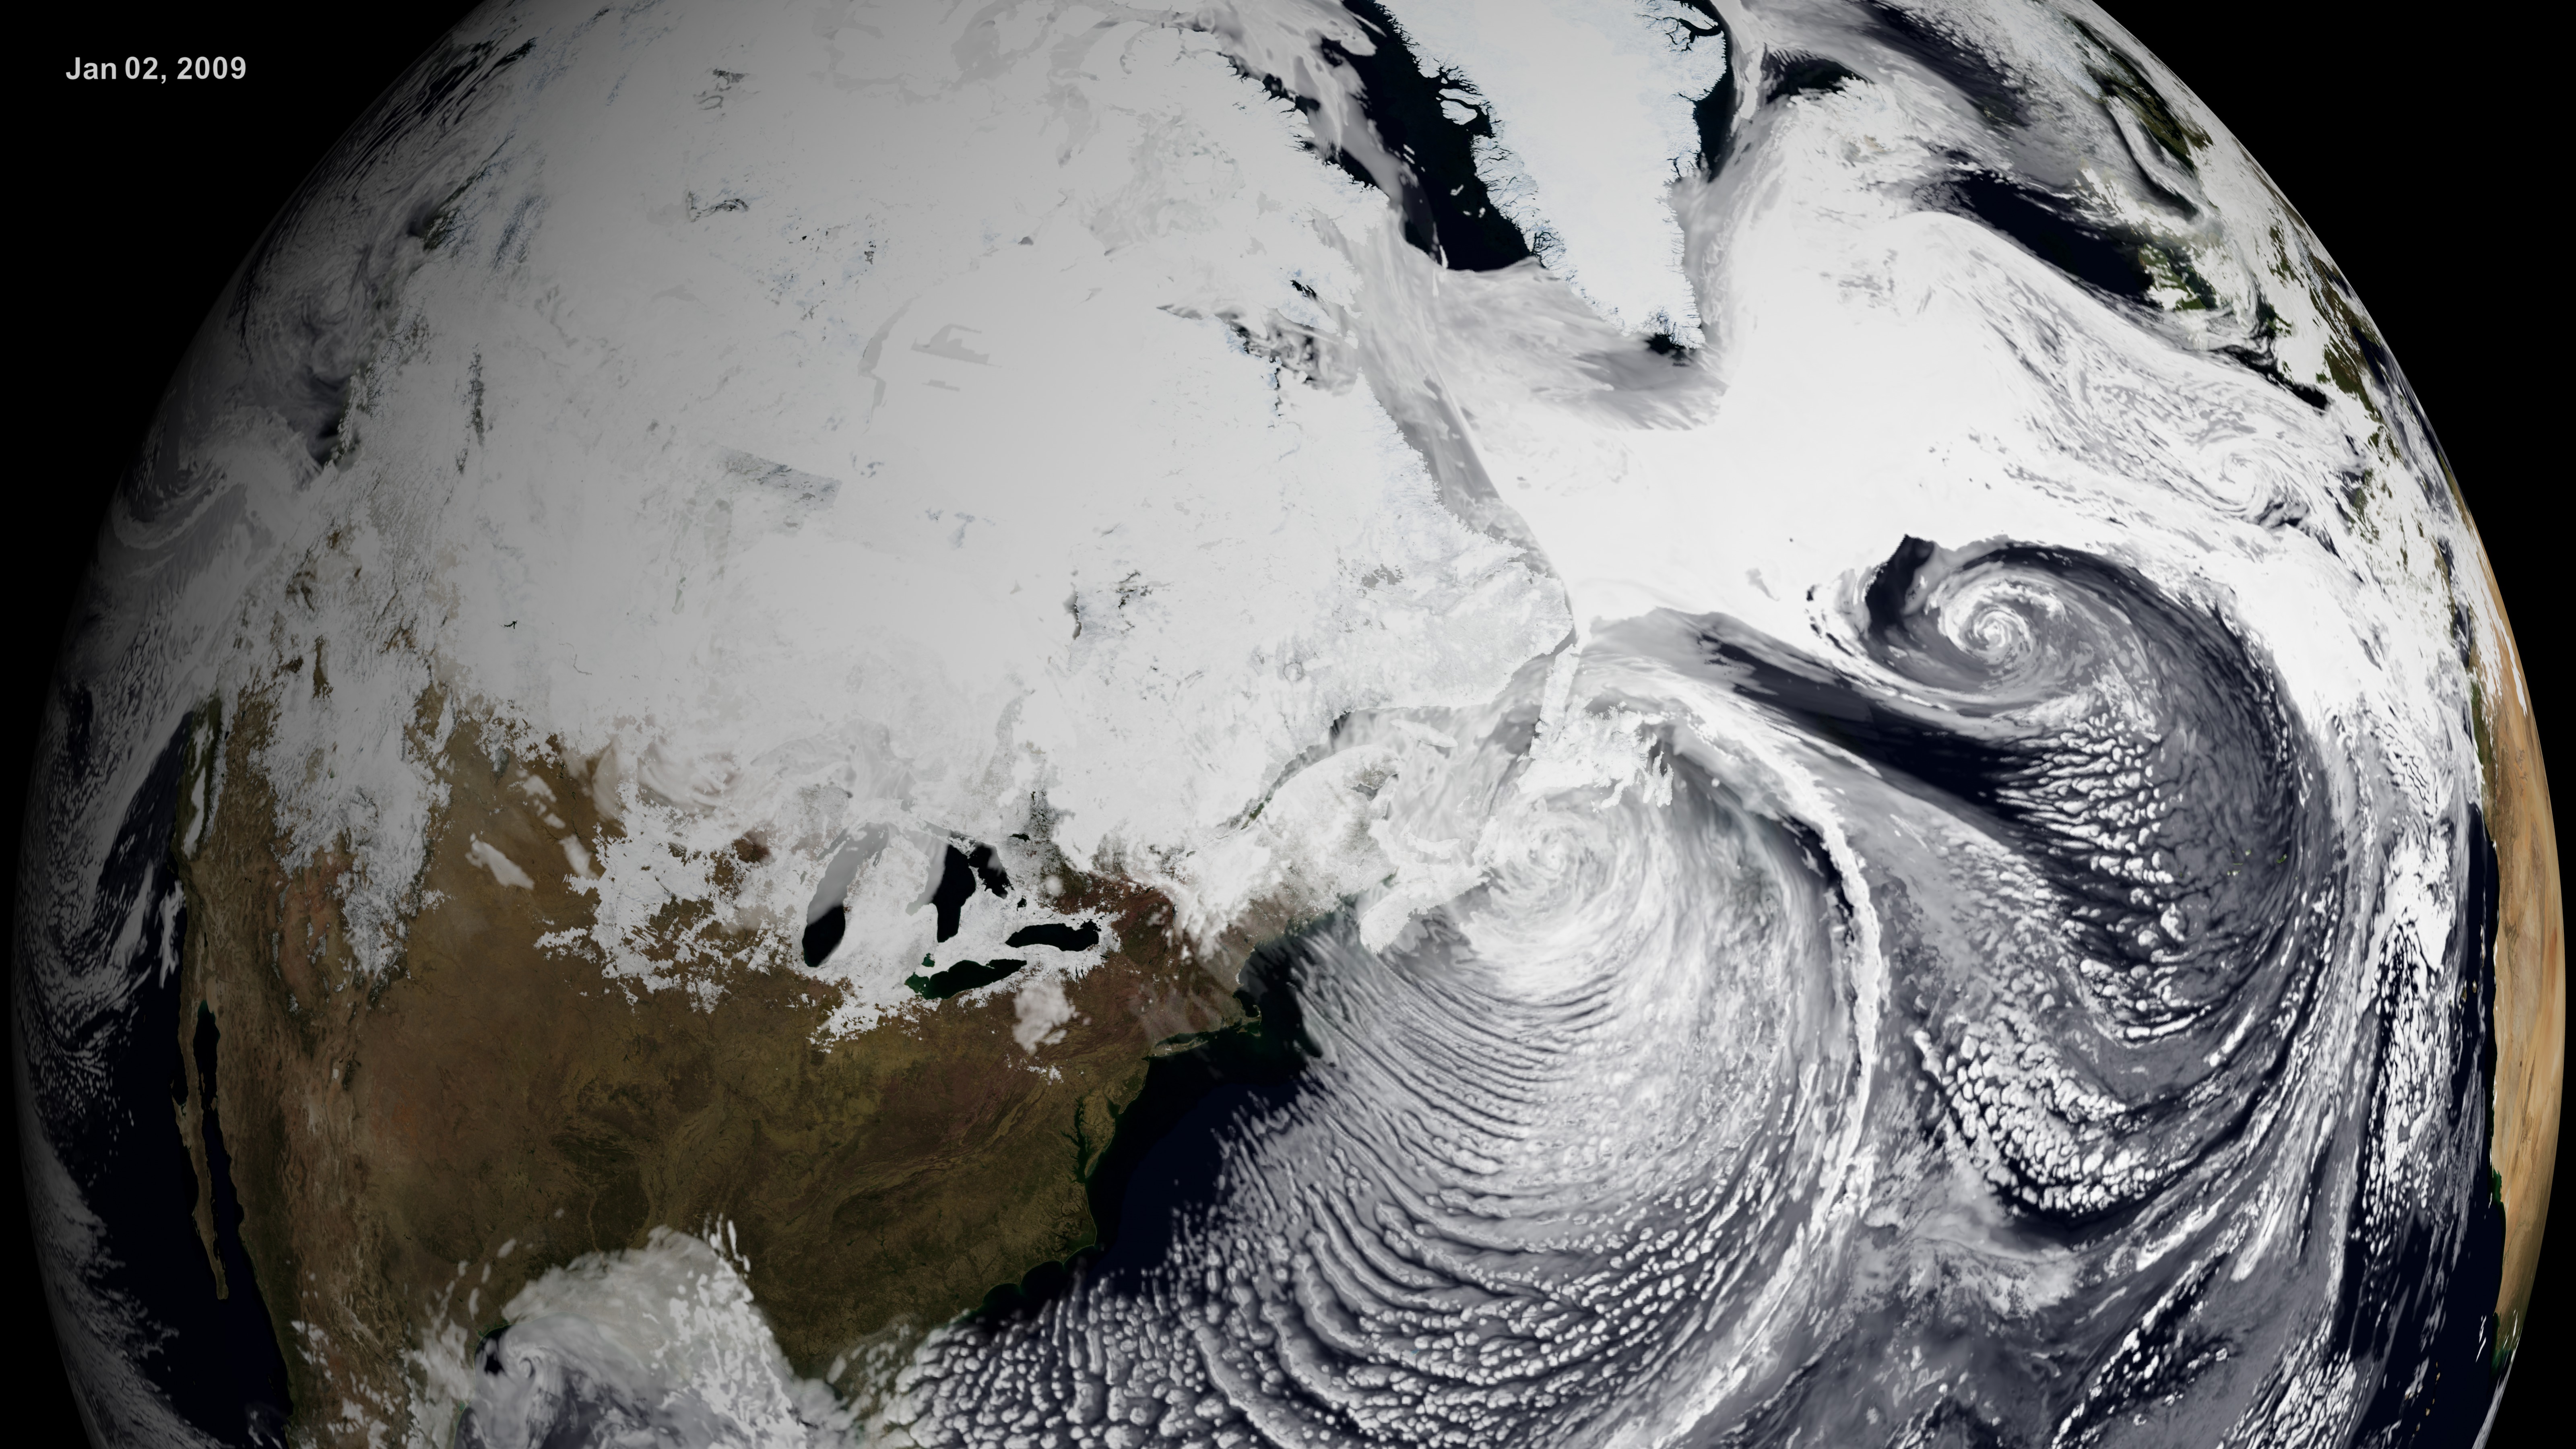
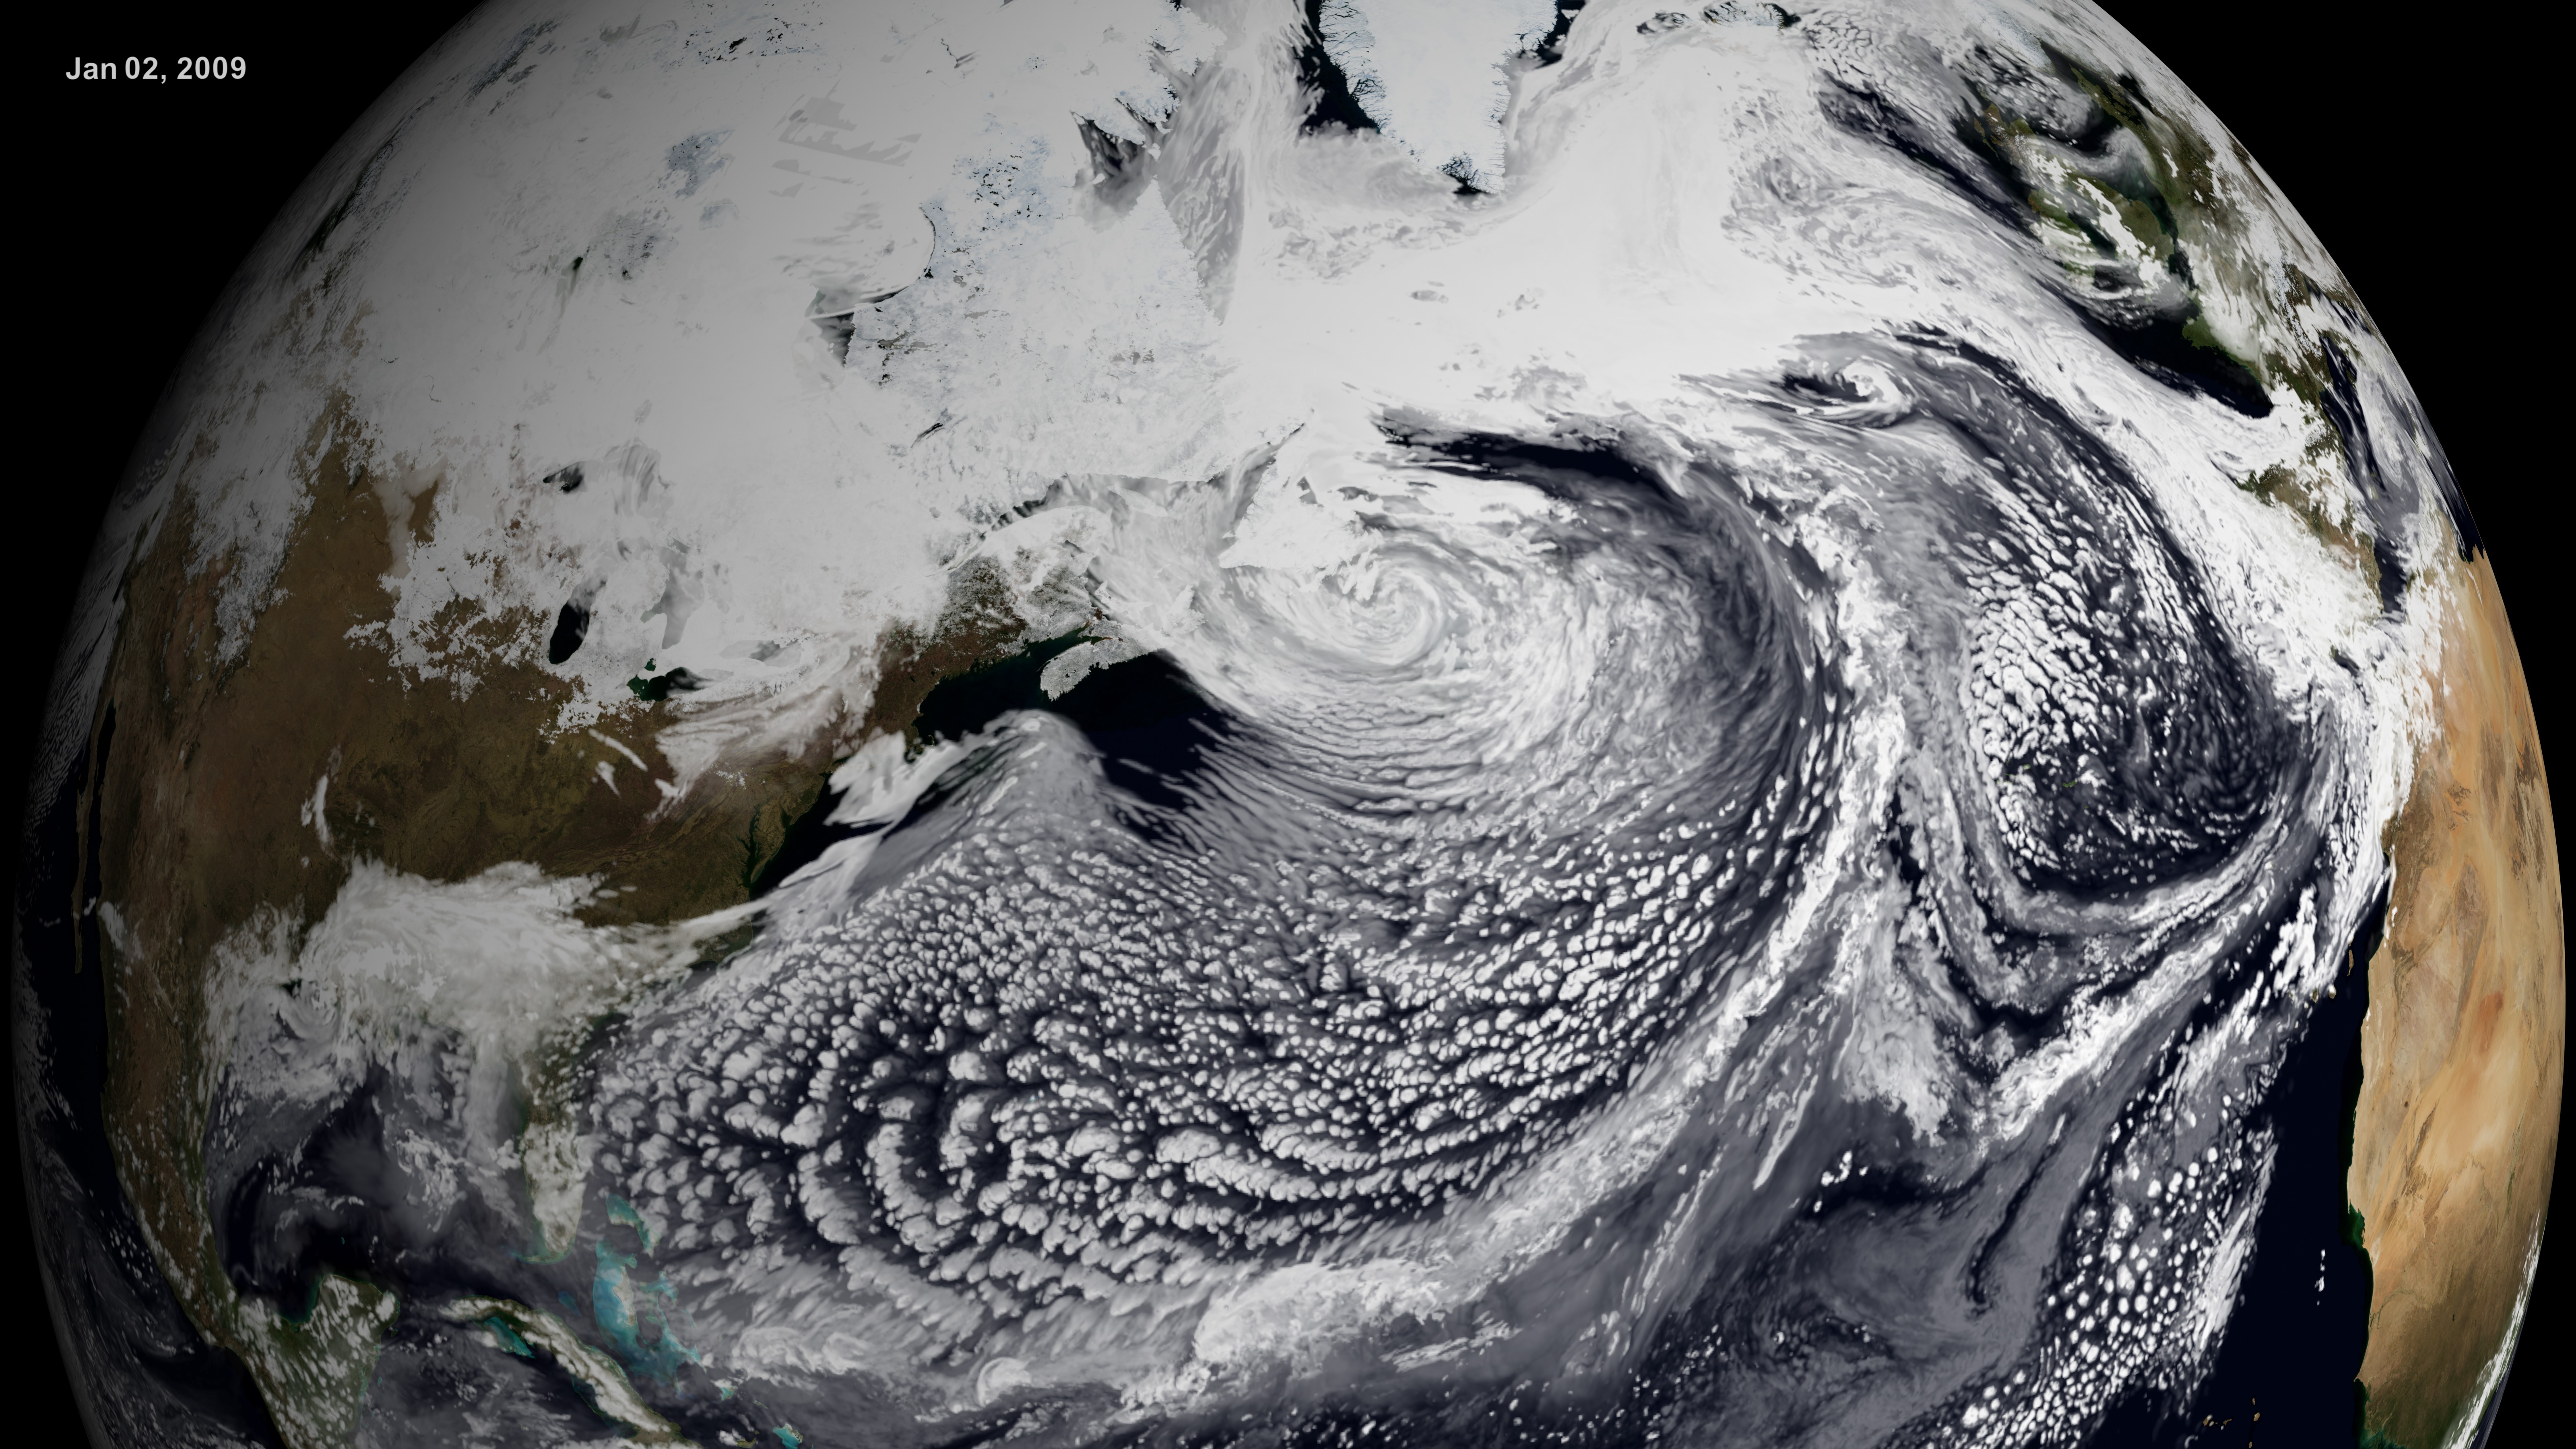
GEOS-5 Modeled Clouds at 3.5-km Global Resolution
Related
Visualization Credits
Please give credit for this item to:
NASA/Goddard Space Flight Center Scientific Visualization Studio The Blue Marble Next Generation data is courtesy of Reto Stockli (NASA/GSFC) and NASA's Earth Observatory.
NASA/Goddard Space Flight Center Scientific Visualization Studio The Blue Marble Next Generation data is courtesy of Reto Stockli (NASA/GSFC) and NASA's Earth Observatory.
Short URL to share this page:
https://svs.gsfc.nasa.gov/3659
Mission:
Terra
Data Used:
Note: While we identify the data sets used in these visualizations, we do not store any further details nor the data sets themselves on our site.
Keywords:
DLESE >> Atmospheric science
SVS >> HDTV
SVS >> Simulation
GCMD >> Earth Science >> Atmosphere >> Clouds
SVS >> Model Data
SVS >> Global Climate Models
SVS >> iPod
SVS >> For Educators
SVS >> Air Currents
SVS >> Water Cycle >> Condensation
SVS >> Water Currents
NASA Science >> Earth
GCMD keywords can be found on the Internet with the following citation: Olsen, L.M., G. Major, K. Shein, J. Scialdone, S. Ritz, T. Stevens, M. Morahan, A. Aleman, R. Vogel, S. Leicester, H. Weir, M. Meaux, S. Grebas, C.Solomon, M. Holland, T. Northcutt, R. A. Restrepo, R. Bilodeau, 2013. NASA/Global Change Master Directory (GCMD) Earth Science Keywords. Version 8.0.0.0.0
https://svs.gsfc.nasa.gov/3659
Mission:
Terra
Data Used:
Terra and Aqua/MODIS/Blue Marble: Next Generation also referred to as: BMNG
1/1/2004 - 12/31/2004
Credit:
The Blue Marble data is courtesy of Reto Stockli (NASA/GSFC).
The Blue Marble data is courtesy of Reto Stockli (NASA/GSFC).
GEOS-5 Atmospheric Model on the Cubed-Sphere also referred to as: GEOS-5 Cubed-Sphere
Model - NASA GMAO
The model is the GEOS-5 atmospheric model on the cubed-sphere, run at 14-km global resolution for 30-days. GEOS-5 is described here http://gmao.gsfc.nasa.gov/systems/geos5/ and the cubed-sphere work is described here http://sivo.gsfc.nasa.gov/cubedsphere_overview.html.
Keywords:
DLESE >> Atmospheric science
SVS >> HDTV
SVS >> Simulation
GCMD >> Earth Science >> Atmosphere >> Clouds
SVS >> Model Data
SVS >> Global Climate Models
SVS >> iPod
SVS >> For Educators
SVS >> Air Currents
SVS >> Water Cycle >> Condensation
SVS >> Water Currents
NASA Science >> Earth
GCMD keywords can be found on the Internet with the following citation: Olsen, L.M., G. Major, K. Shein, J. Scialdone, S. Ritz, T. Stevens, M. Morahan, A. Aleman, R. Vogel, S. Leicester, H. Weir, M. Meaux, S. Grebas, C.Solomon, M. Holland, T. Northcutt, R. A. Restrepo, R. Bilodeau, 2013. NASA/Global Change Master Directory (GCMD) Earth Science Keywords. Version 8.0.0.0.0


