Earth
ID: 3644
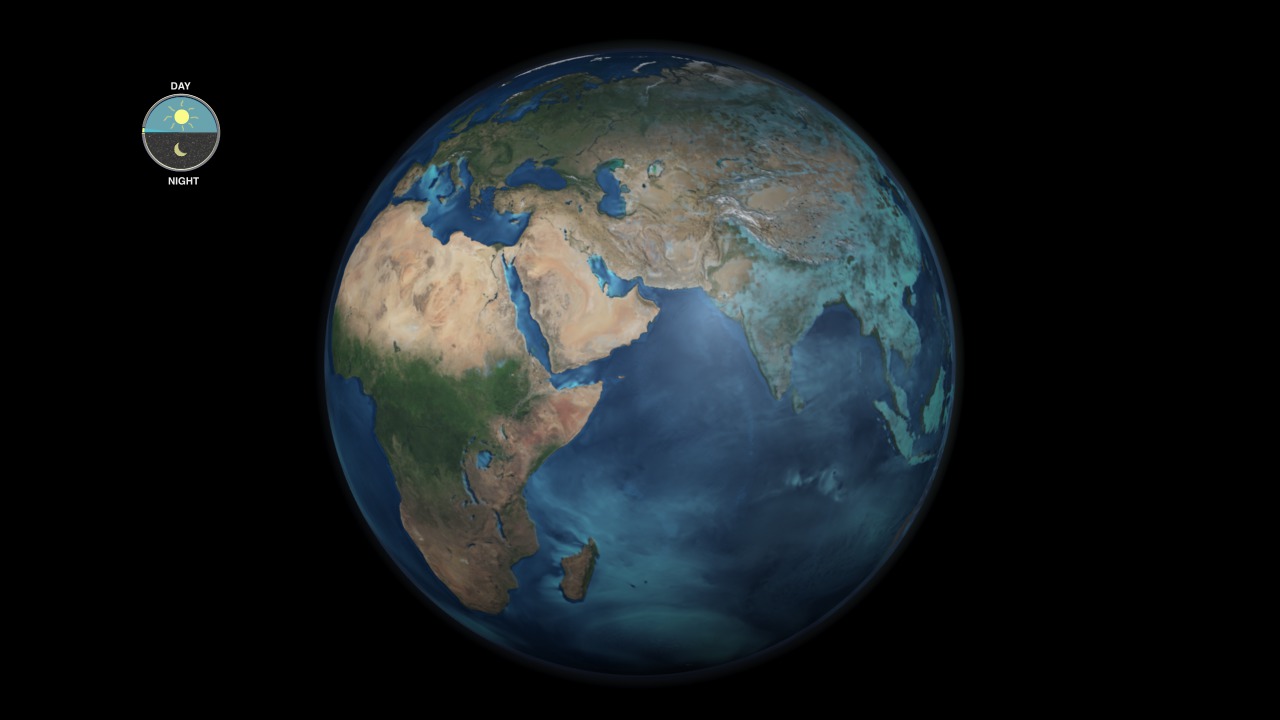
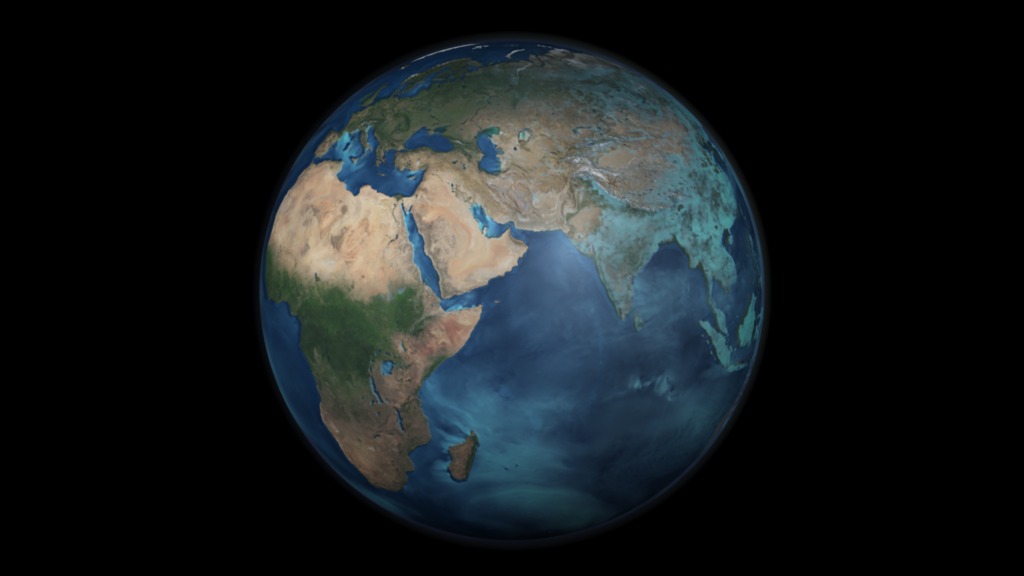
This animation of the global hourly evaporation shows how heating from the sun during the day causes increased evaporation over land areas. Two versions of this animation are provided: one with a day/night clock inset and one without. The animation was created using data from the GEOS-5 atmospheric model on the cubed-sphere, run at 14-km global resolution for 30-days.
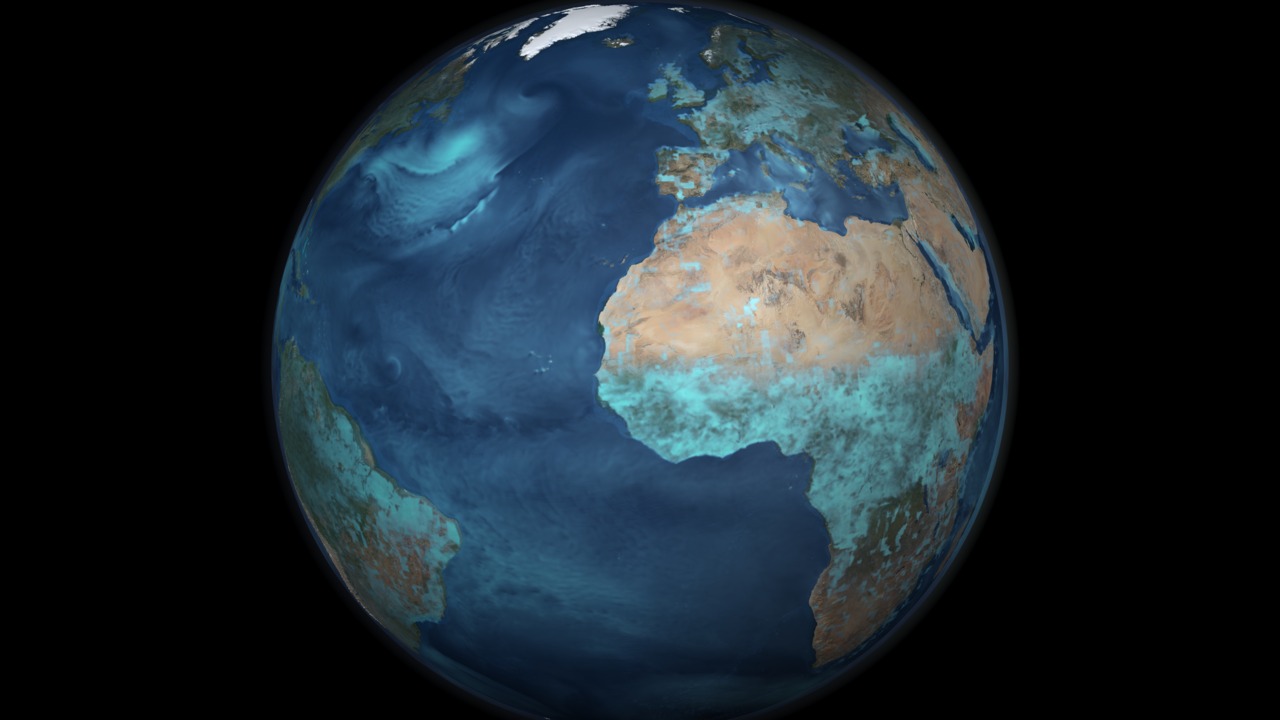
Hourly Evaporation from the GEOS-5 Model
For more information on the GEOS-5, see http://gmao.gsfc.nasa.gov/systems/geos5.
For more information on the cubed-sphere work, see http://sivo.gsfc.nasa.gov/cubedsphere_overview.html.
Visualization Credits
Cindy Starr (Global Science and Technology, Inc.): Lead Visualizer
Michelle Williams (UMBC): Producer
Matthew Rodell (NASA/GSFC): Scientist
William Putman (NASA/GSFC): Scientist
Michelle Williams (UMBC): Producer
Matthew Rodell (NASA/GSFC): Scientist
William Putman (NASA/GSFC): Scientist
Please give credit for this item to:
NASA/Goddard Space Flight Center Scientific Visualization Studio The Blue Marble data is courtesy of Reto Stockli (NASA/GSFC).
NASA/Goddard Space Flight Center Scientific Visualization Studio The Blue Marble data is courtesy of Reto Stockli (NASA/GSFC).
Short URL to share this page:
https://svs.gsfc.nasa.gov/3644
Data Used:
Note: While we identify the data sets used in these visualizations, we do not store any further details nor the data sets themselves on our site.
This item is part of this series:
Earth Science Week
Keywords:
DLESE >> Atmospheric science
SVS >> Evaporation
SVS >> HDTV
GCMD >> Earth Science >> Atmosphere
GCMD >> Earth Science >> Atmosphere >> Atmospheric Phenomena
SVS >> Hyperwall
SVS >> For Educators
SVS >> Water Cycle >> Condensation
SVS >> Day/night
SVS >> Rainforest
SVS >> Sun and Earth
NASA Science >> Earth
GCMD keywords can be found on the Internet with the following citation: Olsen, L.M., G. Major, K. Shein, J. Scialdone, S. Ritz, T. Stevens, M. Morahan, A. Aleman, R. Vogel, S. Leicester, H. Weir, M. Meaux, S. Grebas, C.Solomon, M. Holland, T. Northcutt, R. A. Restrepo, R. Bilodeau, 2013. NASA/Global Change Master Directory (GCMD) Earth Science Keywords. Version 8.0.0.0.0
https://svs.gsfc.nasa.gov/3644
Data Used:
GEOS-5 Atmospheric Model on the Cubed-Sphere also referred to as: GEOS-5 Cubed-Sphere
Model - NASA GMAO
The model is the GEOS-5 atmospheric model on the cubed-sphere, run at 14-km global resolution for 30-days. GEOS-5 is described here http://gmao.gsfc.nasa.gov/systems/geos5/ and the cubed-sphere work is described here http://sivo.gsfc.nasa.gov/cubedsphere_overview.html.
This item is part of this series:
Earth Science Week
Keywords:
DLESE >> Atmospheric science
SVS >> Evaporation
SVS >> HDTV
GCMD >> Earth Science >> Atmosphere
GCMD >> Earth Science >> Atmosphere >> Atmospheric Phenomena
SVS >> Hyperwall
SVS >> For Educators
SVS >> Water Cycle >> Condensation
SVS >> Day/night
SVS >> Rainforest
SVS >> Sun and Earth
NASA Science >> Earth
GCMD keywords can be found on the Internet with the following citation: Olsen, L.M., G. Major, K. Shein, J. Scialdone, S. Ritz, T. Stevens, M. Morahan, A. Aleman, R. Vogel, S. Leicester, H. Weir, M. Meaux, S. Grebas, C.Solomon, M. Holland, T. Northcutt, R. A. Restrepo, R. Bilodeau, 2013. NASA/Global Change Master Directory (GCMD) Earth Science Keywords. Version 8.0.0.0.0


