Earth
ID: 3625
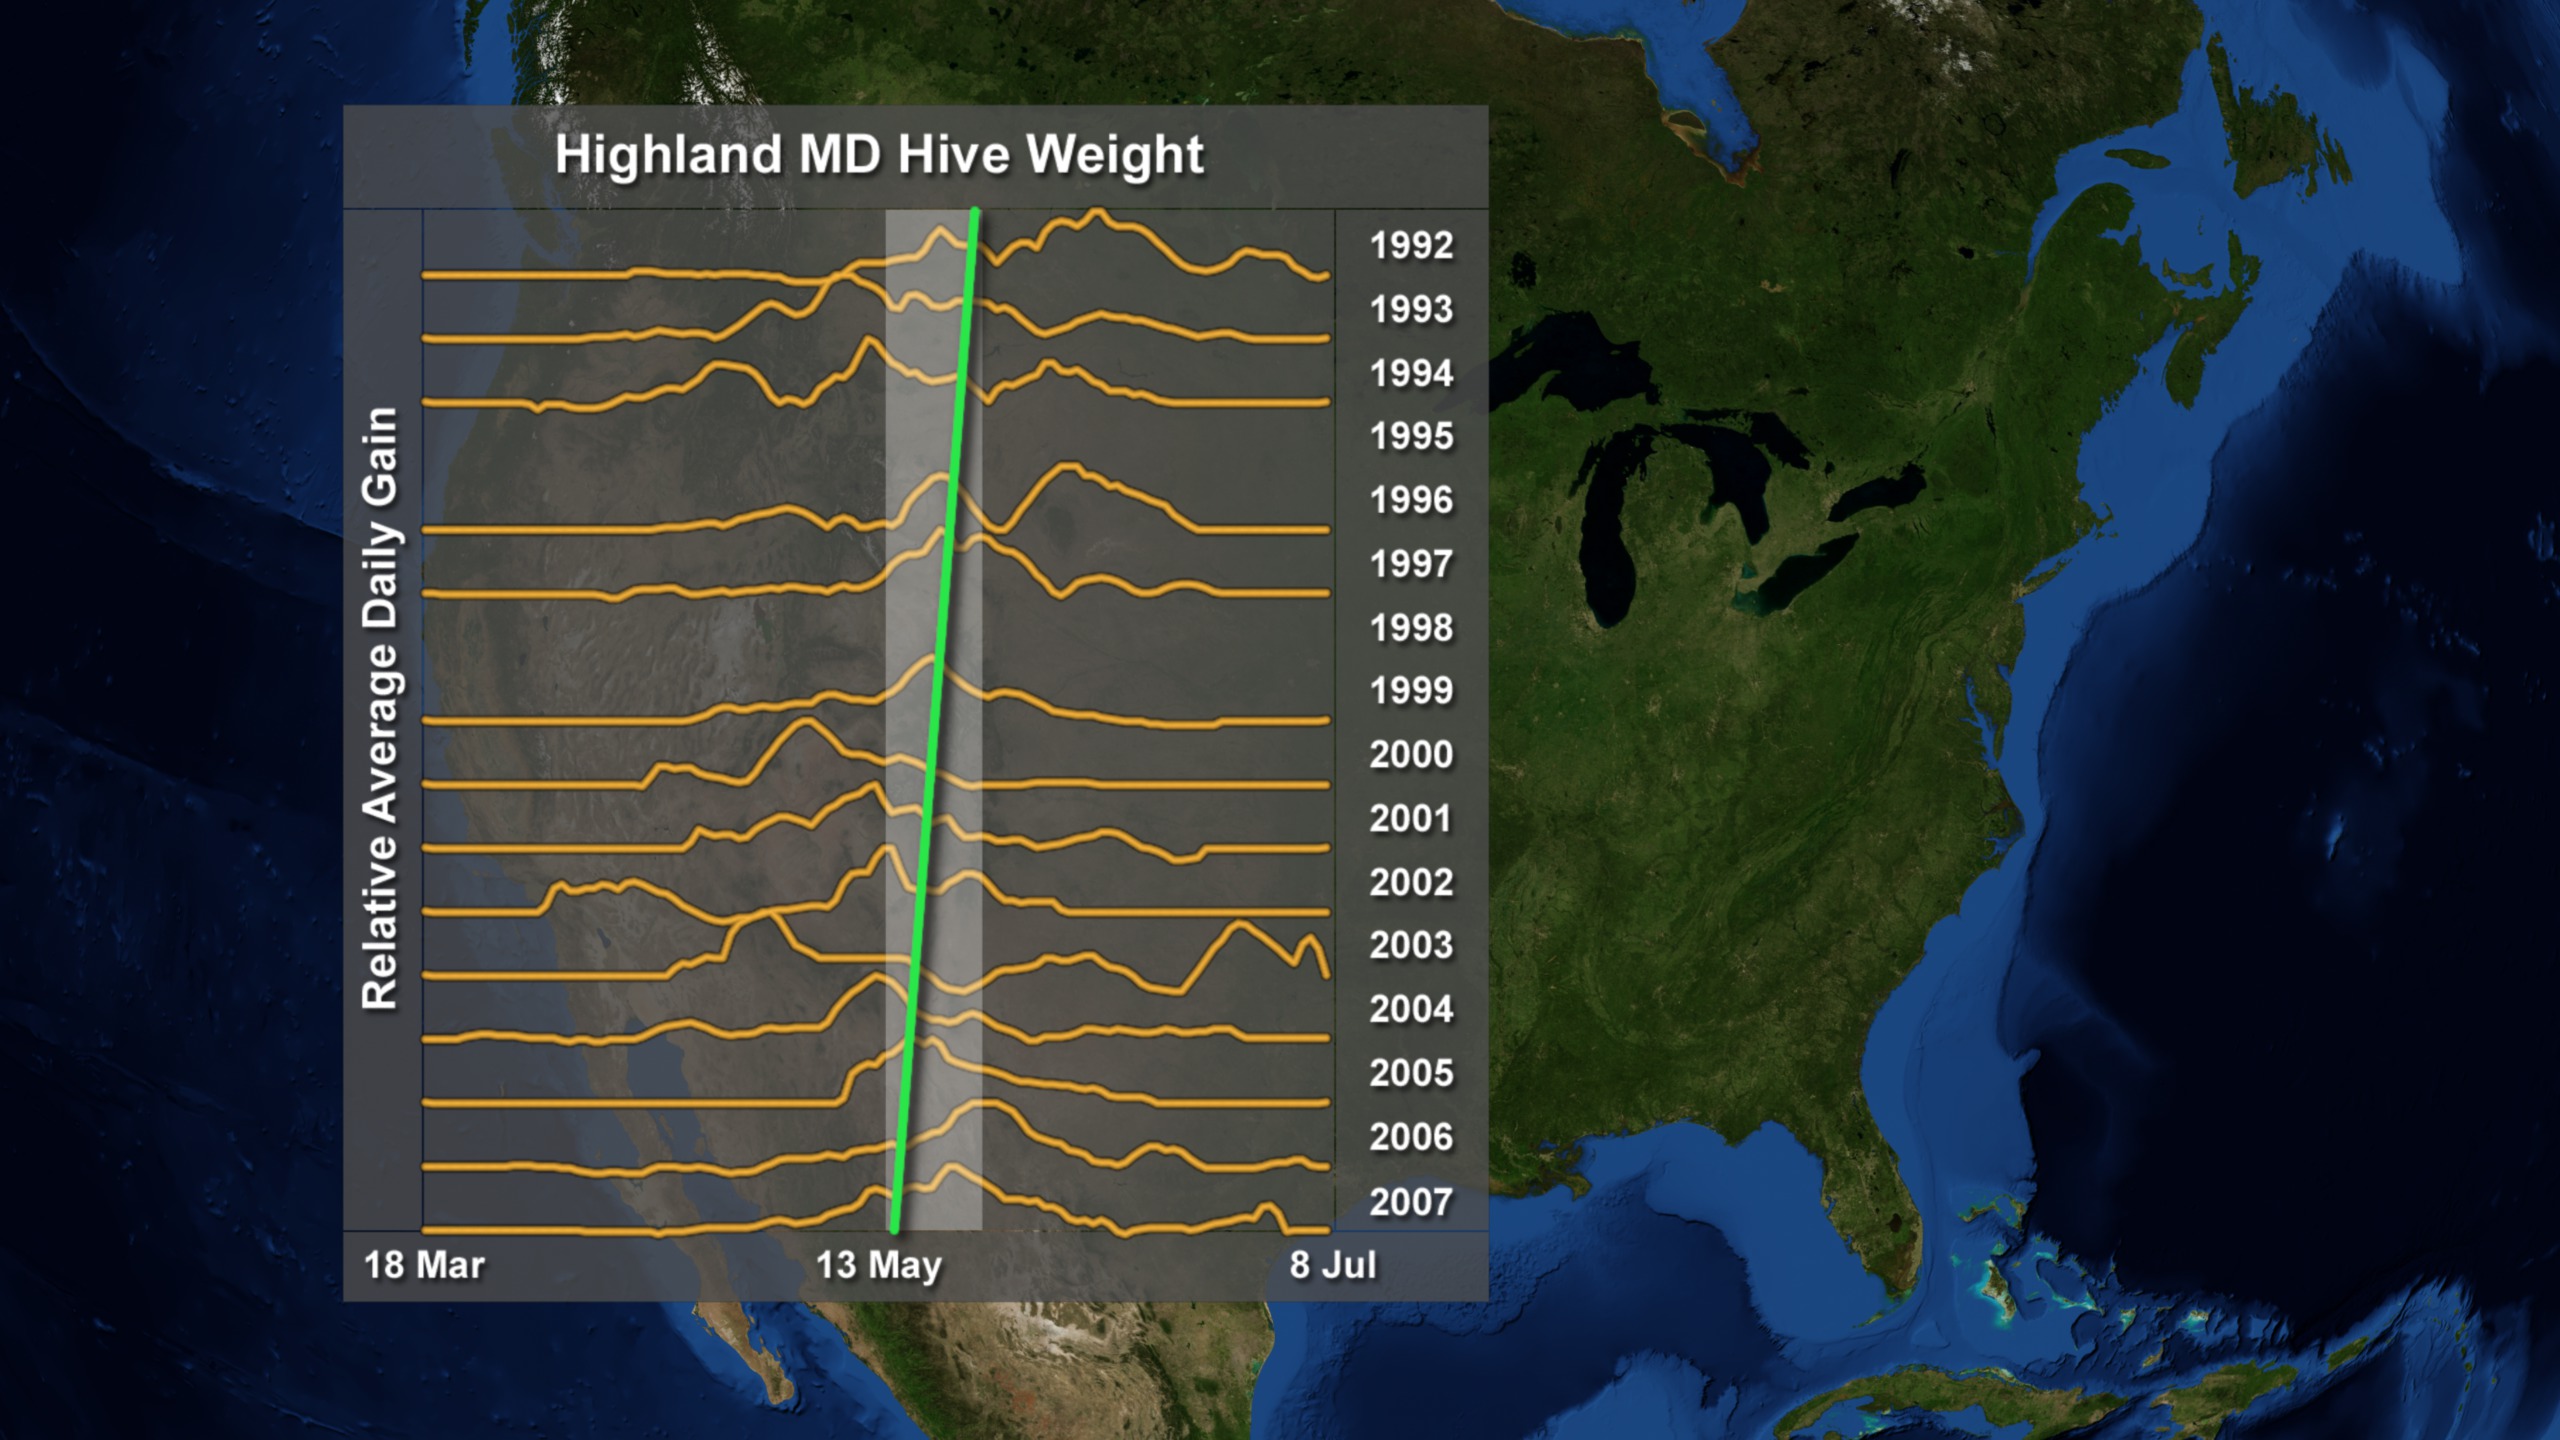
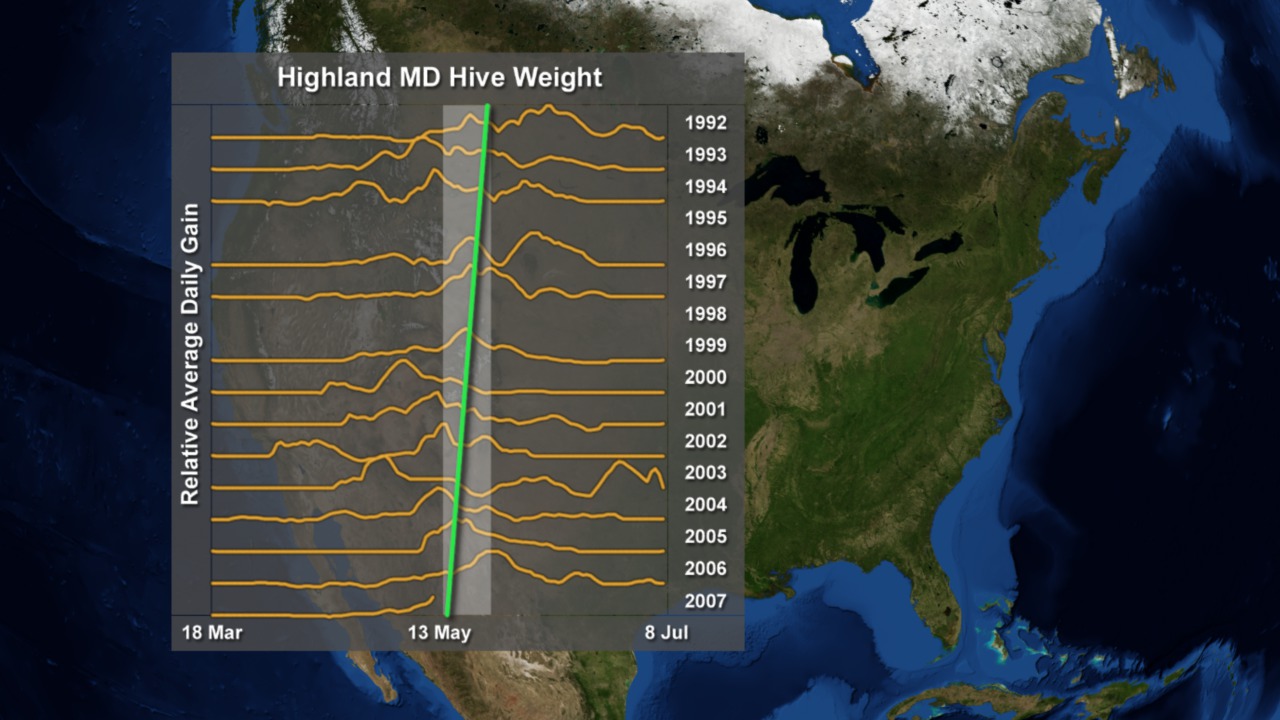
This animation illustrates the relationship between the annual vegetation cycle and seasonal variations in the weights of honey bee hives. The weight of a hive increases in the spring as bees bring back nectar from flowering plants. The change in hive weight over time can be compared with satellite measurements of vegetation. Tracking a large number of hives this way can reveal the effects of changing climate and land use on the interaction of plants and pollinators. Data from this hive in Highland, Maryland and others suggests that for some locations in the U.S., spring is arriving earlier by as much as half a day per year, probably due to a combination of climate and the warming effect of urbanization.
Honey Bees Weigh In on Climate
This animation has been incorporated into the video "Feeling the Sting of Climate Change," which provides more background and introduces HoneyBeeNet, a central repository for hive weight data from across the U.S.
Visualization Credits
Ernie Wright (UMBC): Lead Animator
Cindy Starr (Global Science and Technology, Inc.): Visualizer
Jennifer A. Shoemaker (UMBC): Producer
Wayne E. Esaias (NASA/GSFC): Scientist
Cindy Starr (Global Science and Technology, Inc.): Visualizer
Jennifer A. Shoemaker (UMBC): Producer
Wayne E. Esaias (NASA/GSFC): Scientist
Please give credit for this item to:
NASA/Goddard Space Flight Center Scientific Visualization Studio The Next Generation Blue Marble data is courtesy of Reto Stockli (NASA/GSFC).
NASA/Goddard Space Flight Center Scientific Visualization Studio The Next Generation Blue Marble data is courtesy of Reto Stockli (NASA/GSFC).
Short URL to share this page:
https://svs.gsfc.nasa.gov/3625
Mission:
Terra
Data Used:
Note: While we identify the data sets used in these visualizations, we do not store any further details nor the data sets themselves on our site.
This item is part of this series:
Honey Bees and Climate Change
Keywords:
DLESE >> Agricultural science
DLESE >> Biology
SVS >> Global Warming
SVS >> HDTV
GCMD >> Earth Science >> Agriculture
GCMD >> Earth Science >> Climate Indicators
GCMD >> Earth Science >> Biosphere >> Ecological Dynamics >> Pollinator Species
GCMD >> Earth Science >> Biosphere >> Vegetation >> Vegetation Cover
GCMD >> Location >> North America
SVS >> Climate Change
SVS >> Bees
SVS >> For Educators
SVS >> Food Chain
SVS >> Zoology >> Insects
SVS >> Farming
NASA Science >> Earth
GCMD keywords can be found on the Internet with the following citation: Olsen, L.M., G. Major, K. Shein, J. Scialdone, S. Ritz, T. Stevens, M. Morahan, A. Aleman, R. Vogel, S. Leicester, H. Weir, M. Meaux, S. Grebas, C.Solomon, M. Holland, T. Northcutt, R. A. Restrepo, R. Bilodeau, 2013. NASA/Global Change Master Directory (GCMD) Earth Science Keywords. Version 8.0.0.0.0
https://svs.gsfc.nasa.gov/3625
Mission:
Terra
Data Used:
Terra and Aqua/MODIS/Blue Marble Land Cover
1 Jan - 31 Dec 2004
Credit:
The Blue Marble data is courtesy of Reto Stockli (NASA/GSFC).
The Blue Marble data is courtesy of Reto Stockli (NASA/GSFC).
also referred to as: Highland, MD Bee Hive Weight
Data Compilation - HoneyBeeNet - 1992 - 2007This item is part of this series:
Honey Bees and Climate Change
Keywords:
DLESE >> Agricultural science
DLESE >> Biology
SVS >> Global Warming
SVS >> HDTV
GCMD >> Earth Science >> Agriculture
GCMD >> Earth Science >> Climate Indicators
GCMD >> Earth Science >> Biosphere >> Ecological Dynamics >> Pollinator Species
GCMD >> Earth Science >> Biosphere >> Vegetation >> Vegetation Cover
GCMD >> Location >> North America
SVS >> Climate Change
SVS >> Bees
SVS >> For Educators
SVS >> Food Chain
SVS >> Zoology >> Insects
SVS >> Farming
NASA Science >> Earth
GCMD keywords can be found on the Internet with the following citation: Olsen, L.M., G. Major, K. Shein, J. Scialdone, S. Ritz, T. Stevens, M. Morahan, A. Aleman, R. Vogel, S. Leicester, H. Weir, M. Meaux, S. Grebas, C.Solomon, M. Holland, T. Northcutt, R. A. Restrepo, R. Bilodeau, 2013. NASA/Global Change Master Directory (GCMD) Earth Science Keywords. Version 8.0.0.0.0


