Earth
ID: 3596
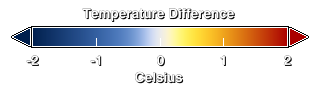
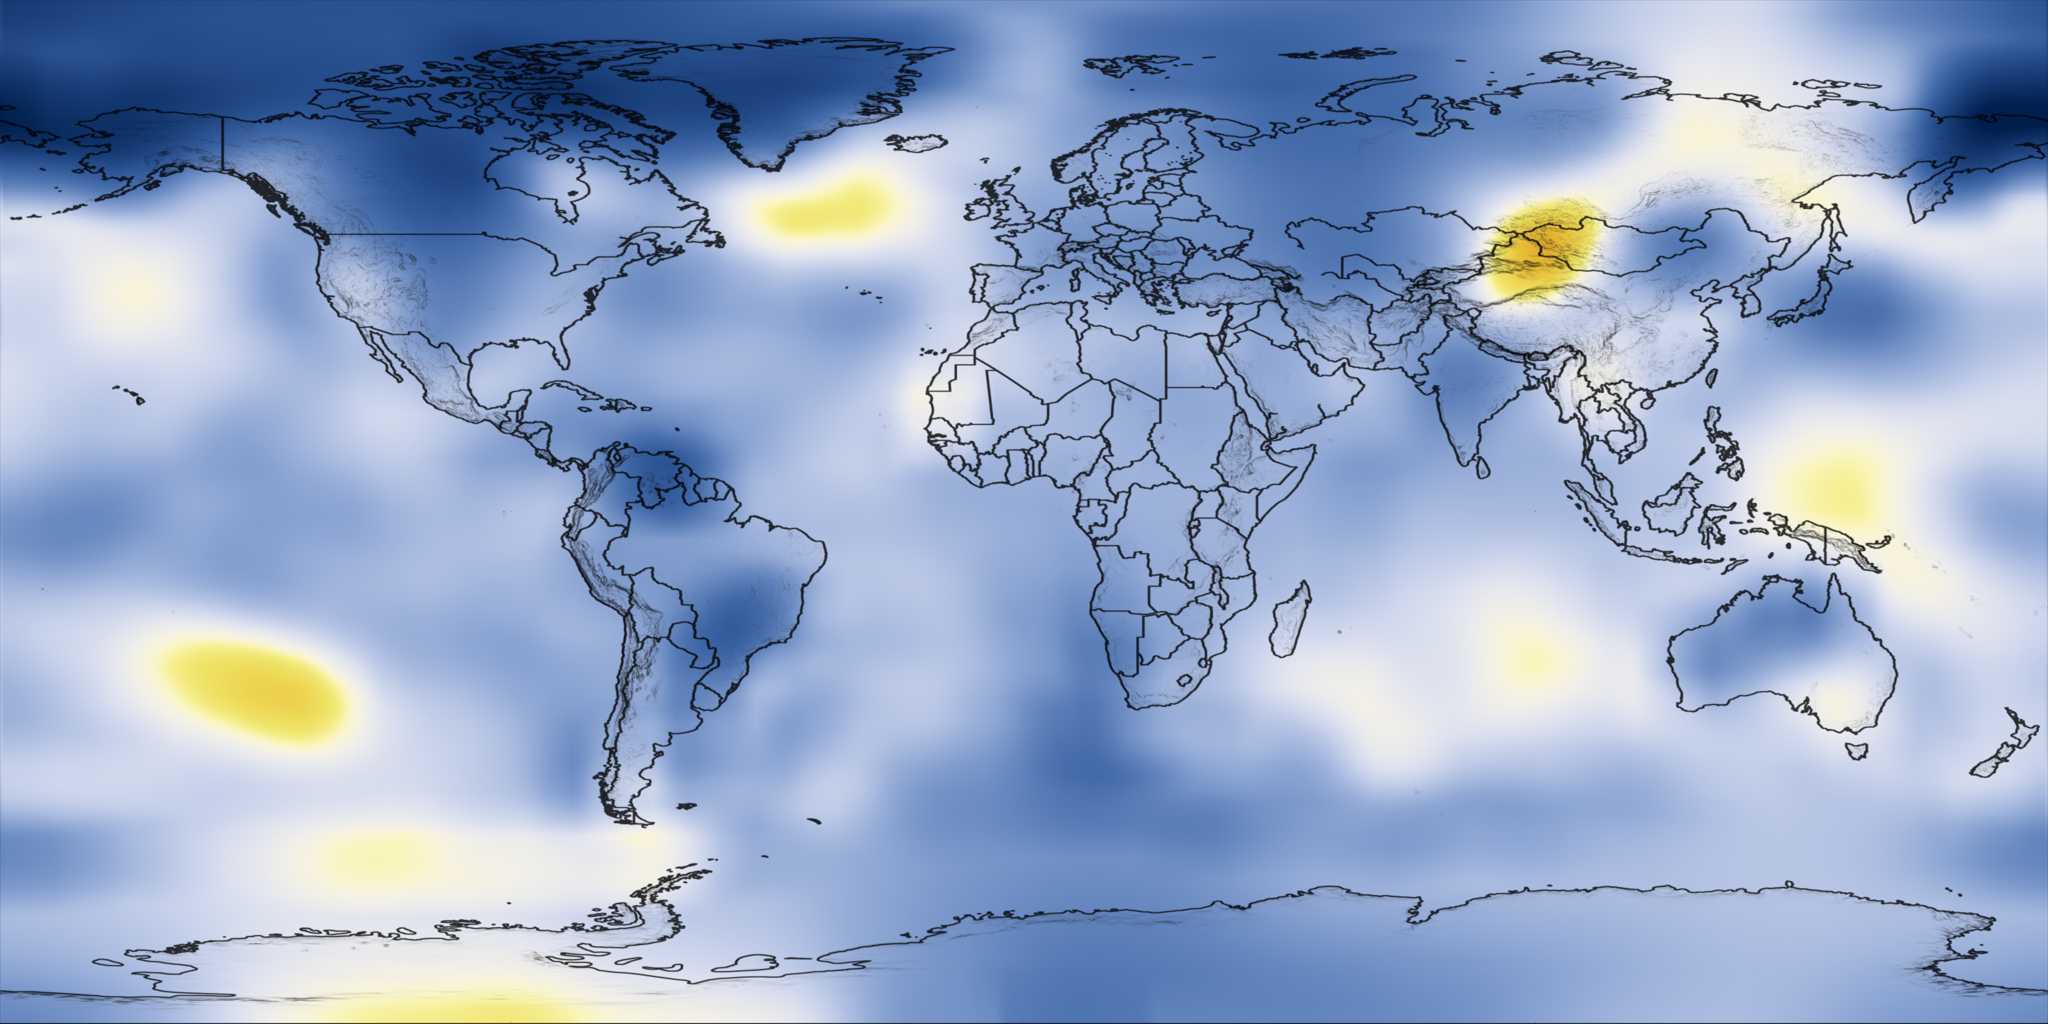
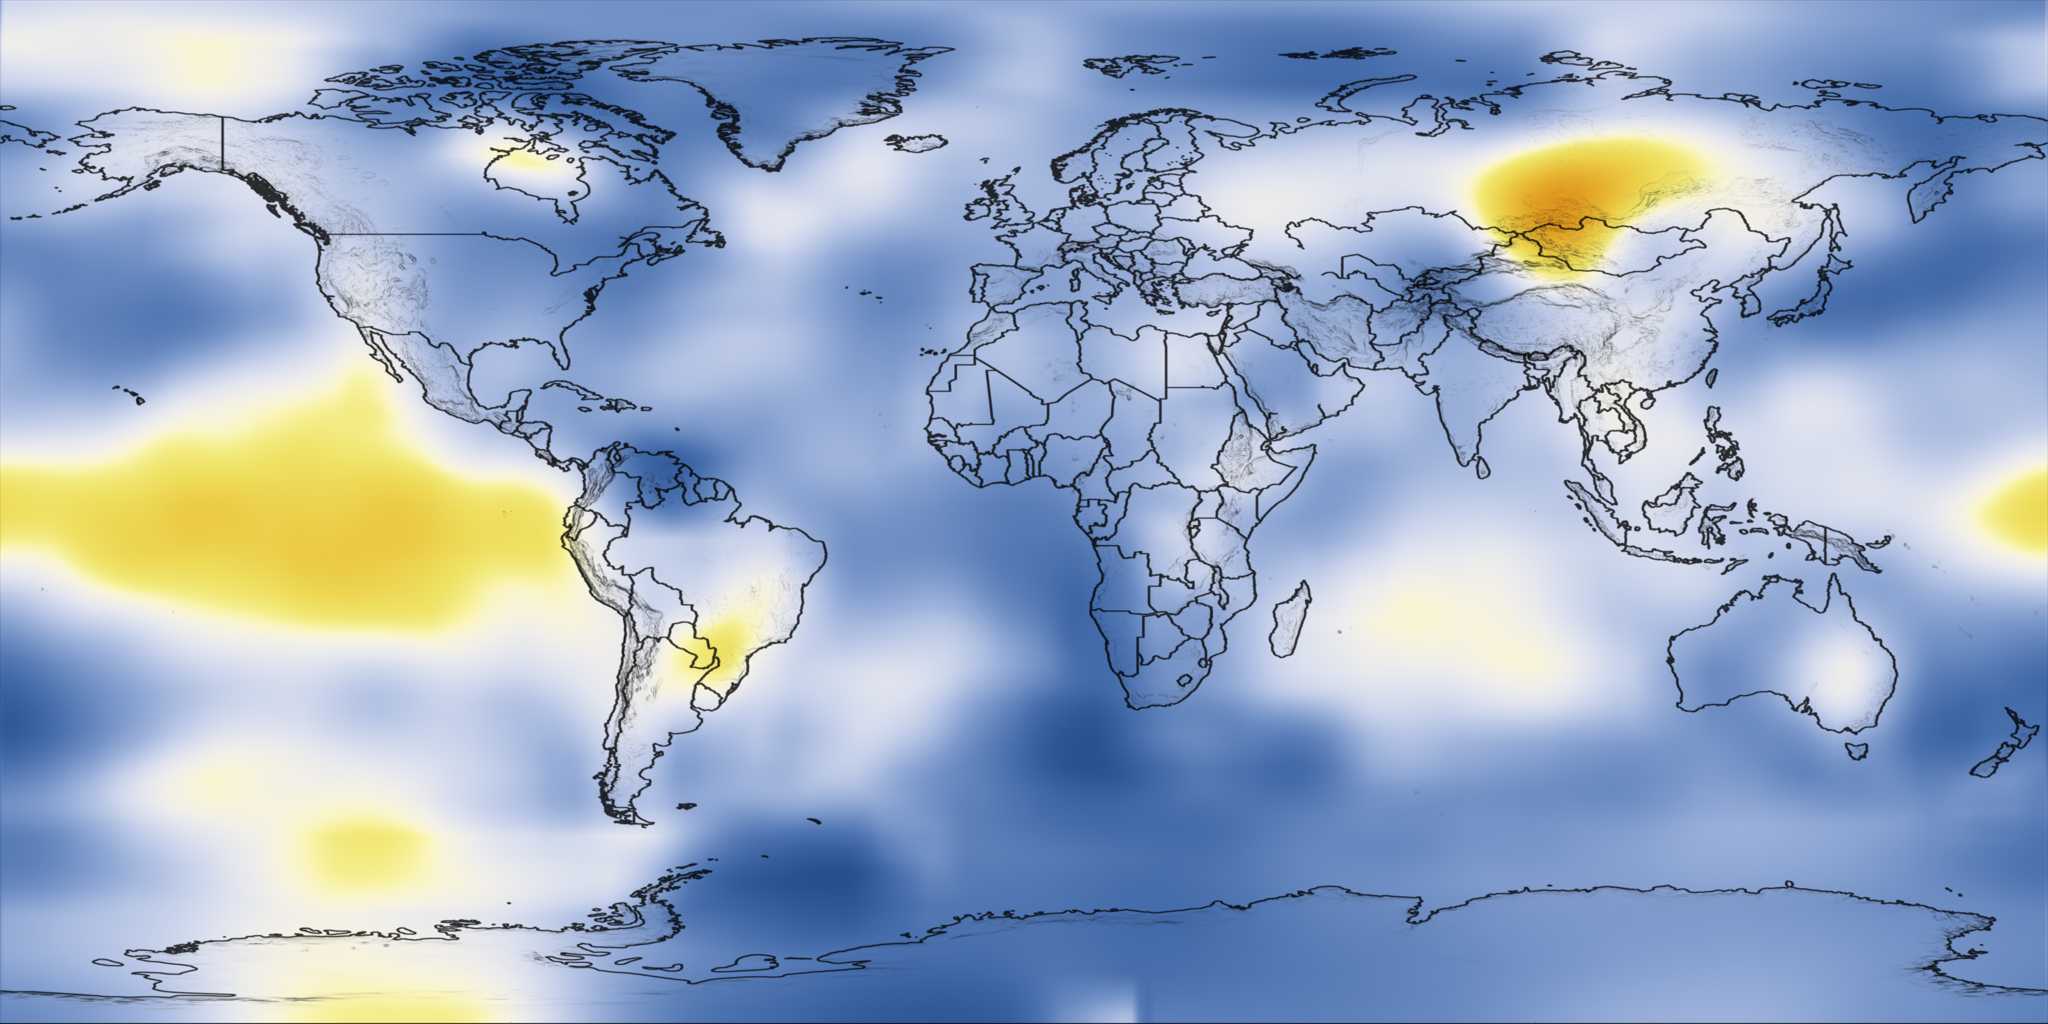
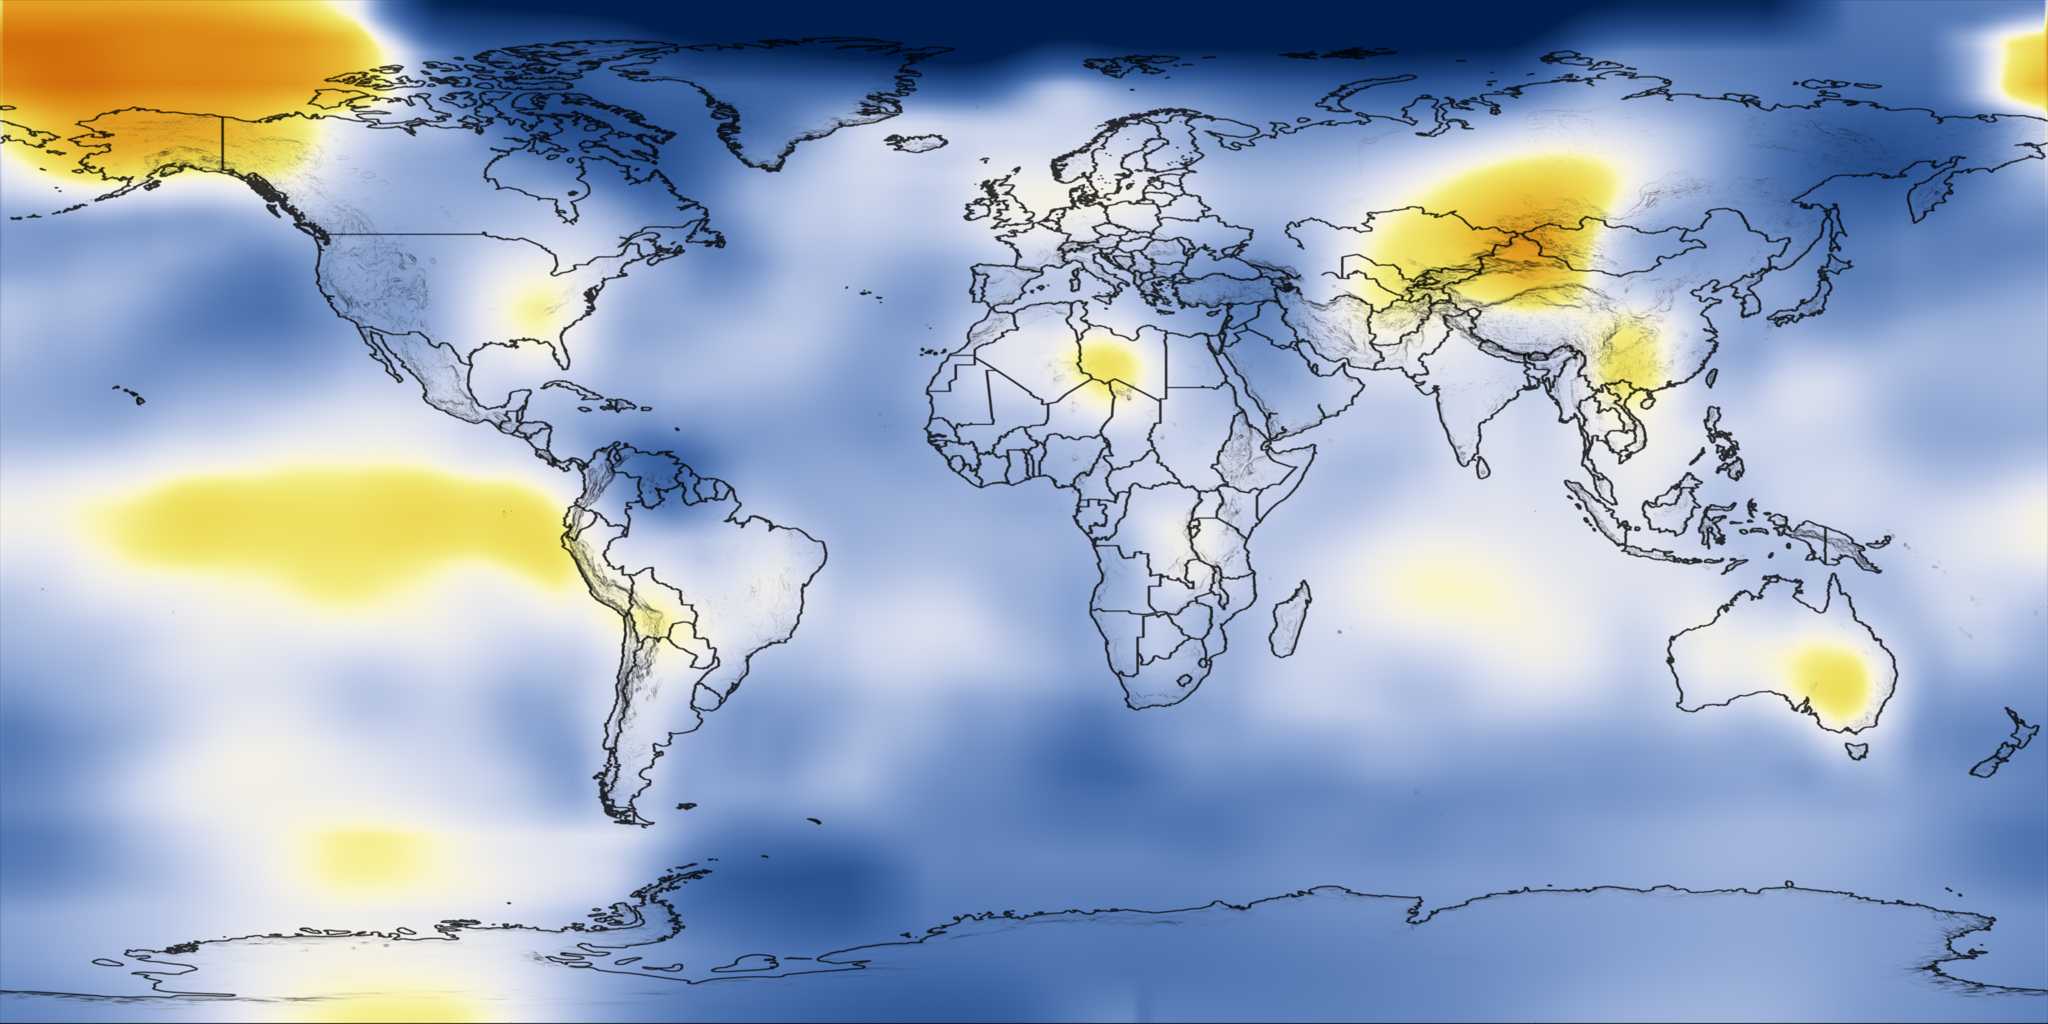
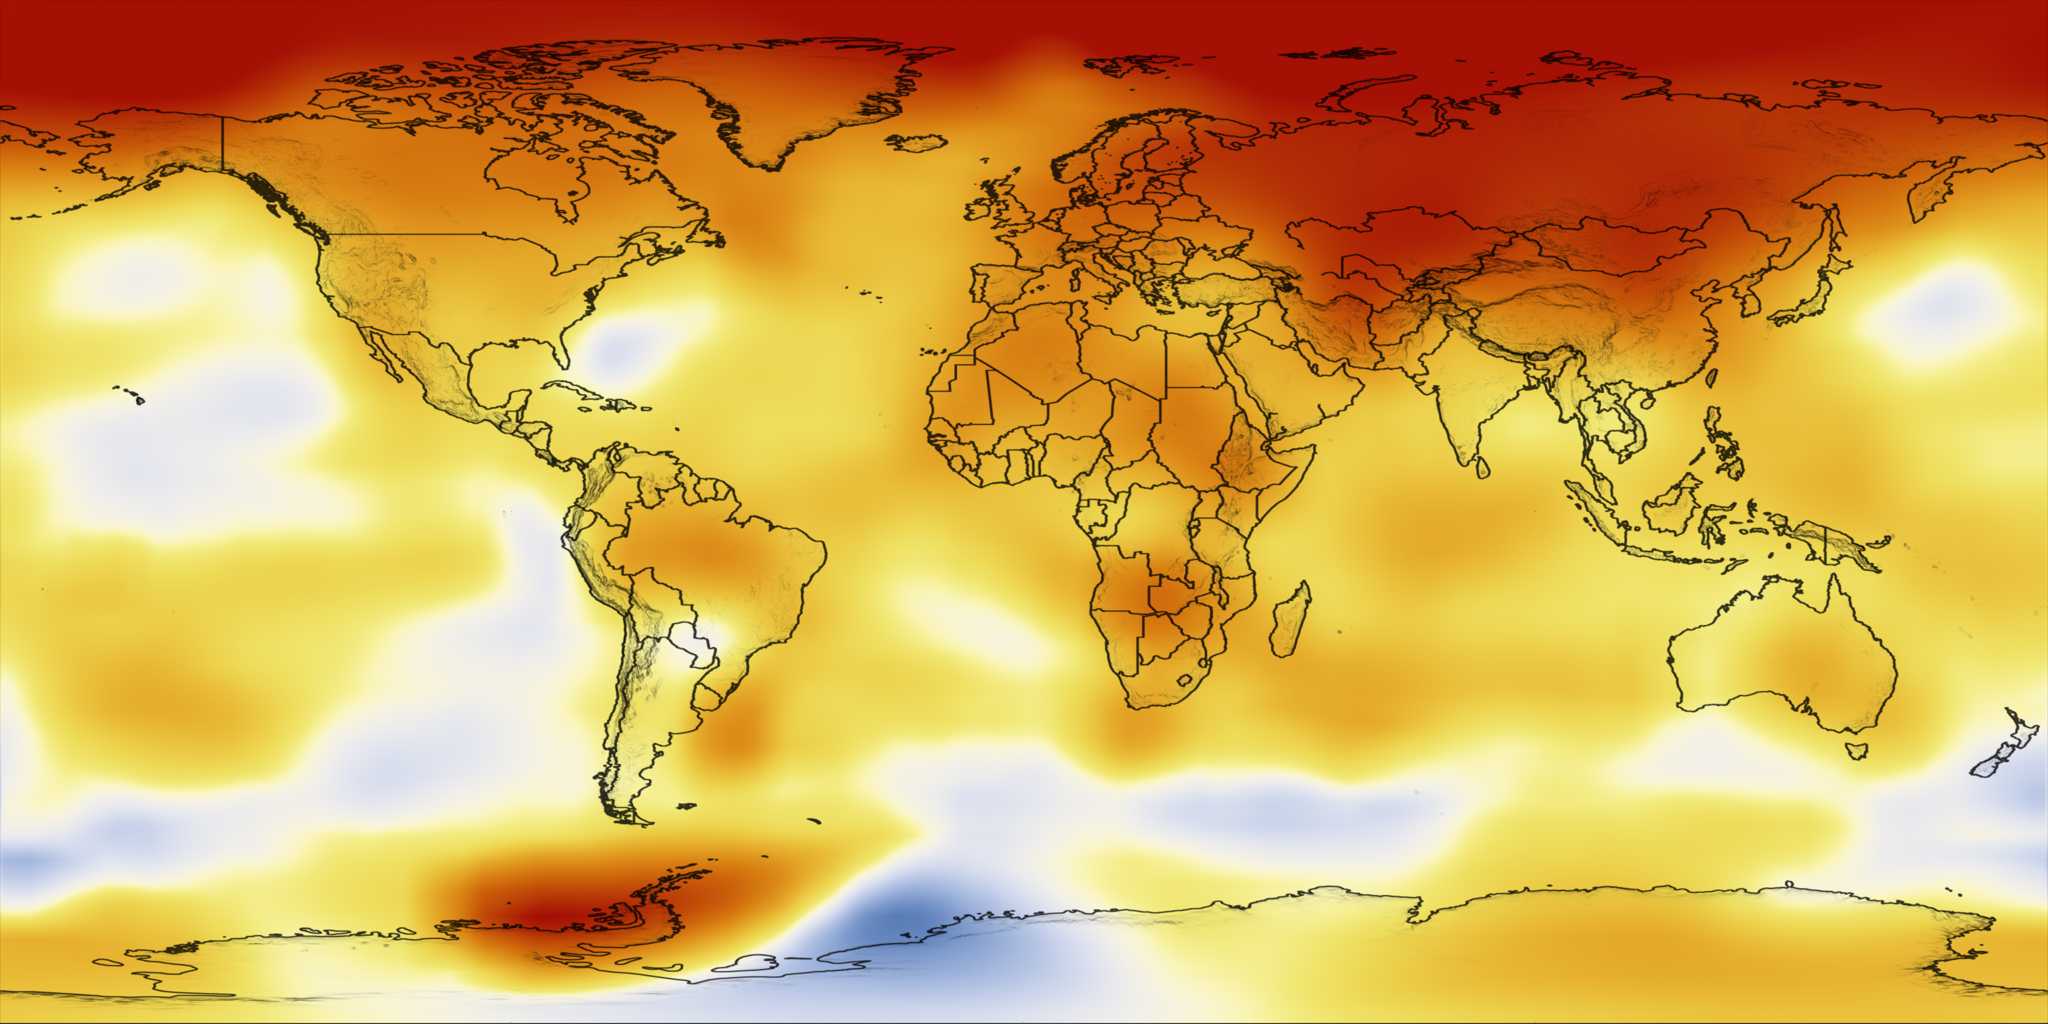
Each year, scientists at NASA Goddard Institute for Space Studies analyze global temperature data. A rapid warming trend has occurred over the past 30 years. Calendar year 2008 was the coolest year since 2000, according to the Goddard Institute for Space Studies analysis of surface air temperature measurements. In this analysis, 2008 is the ninth warmest year in the period of instrumental measurements, which extends back to 1881. 2005 is the hottest year on record, and 2007 is tied with 1998 for second place. The Earth is experiencing the warmest level of the current interglacial period, or interval between ice ages, which has lasted nearly 12,000 years. This color-coded map displays a long term progression of changing global surface temperatures, from 1881 to 2008. Dark red indicates the greatest warming and dark blue indicates the greatest cooling.

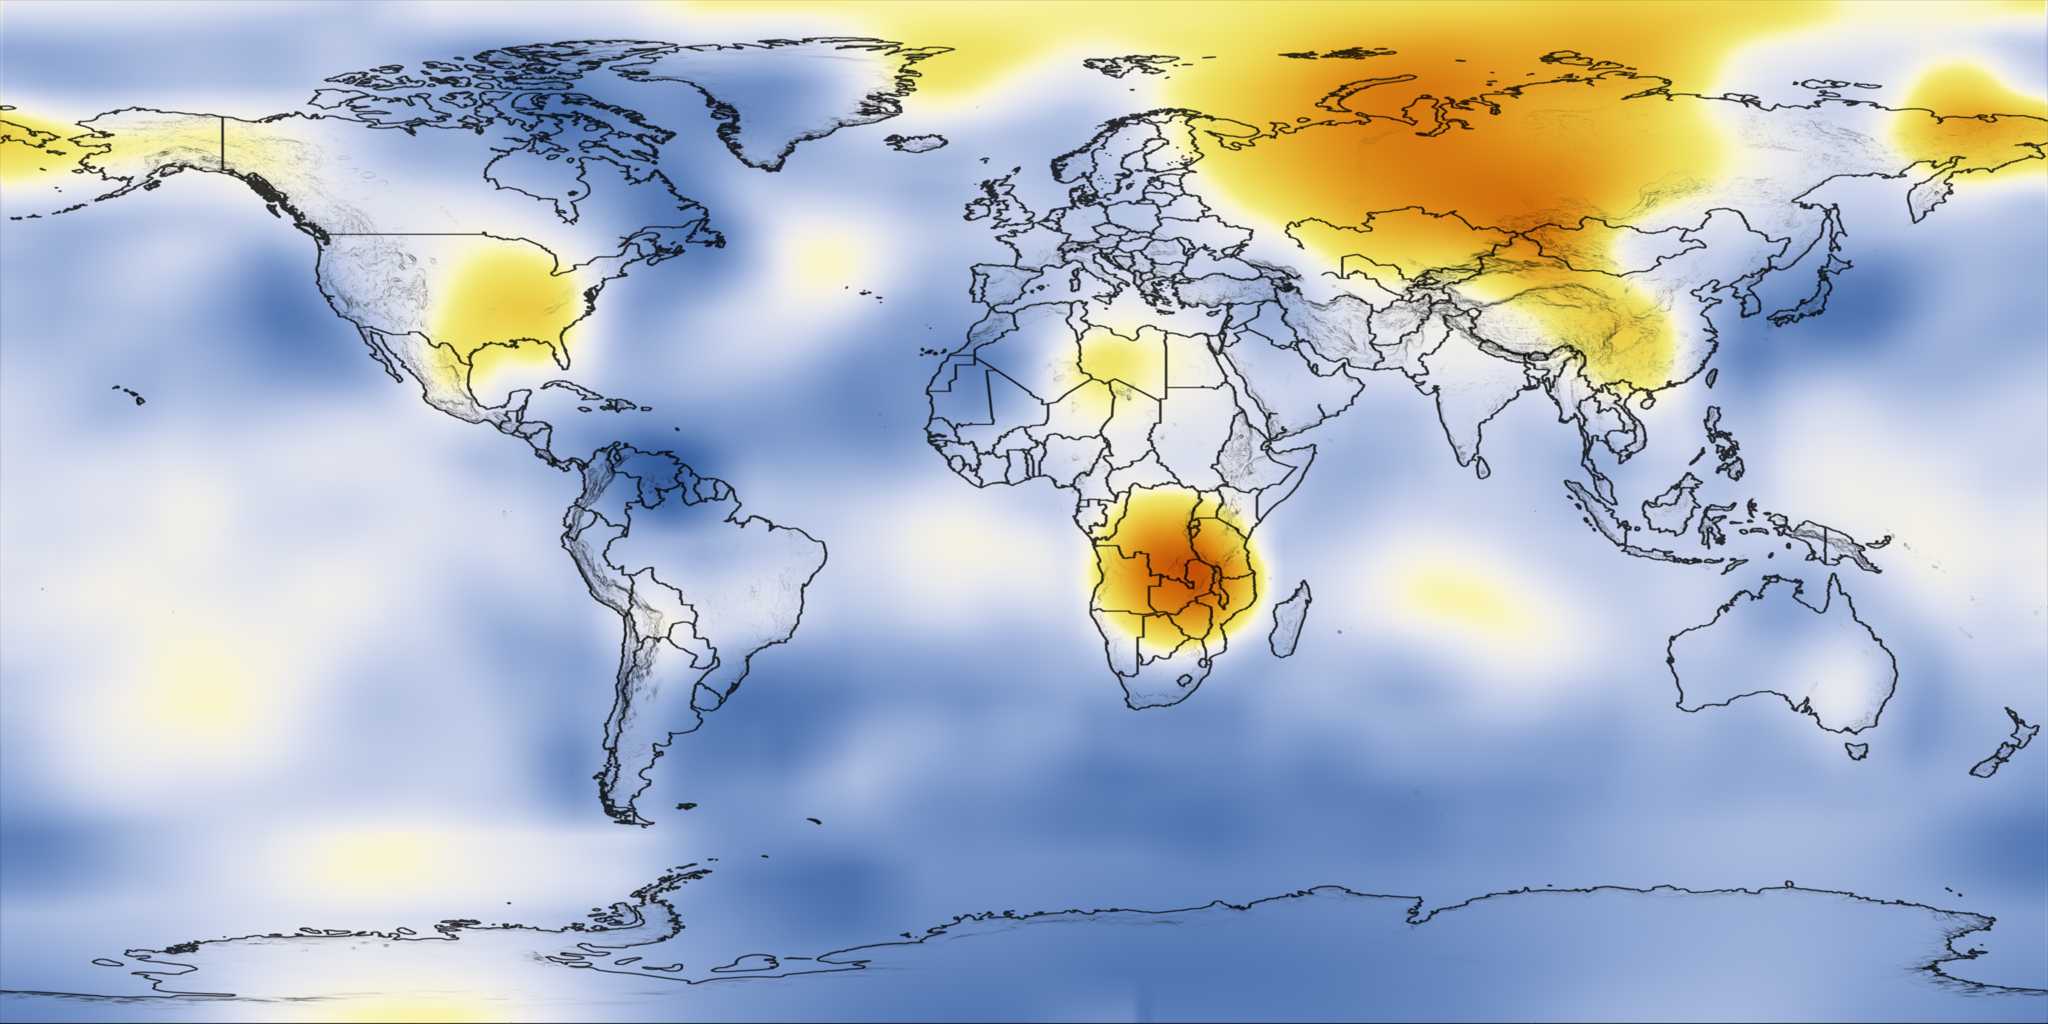
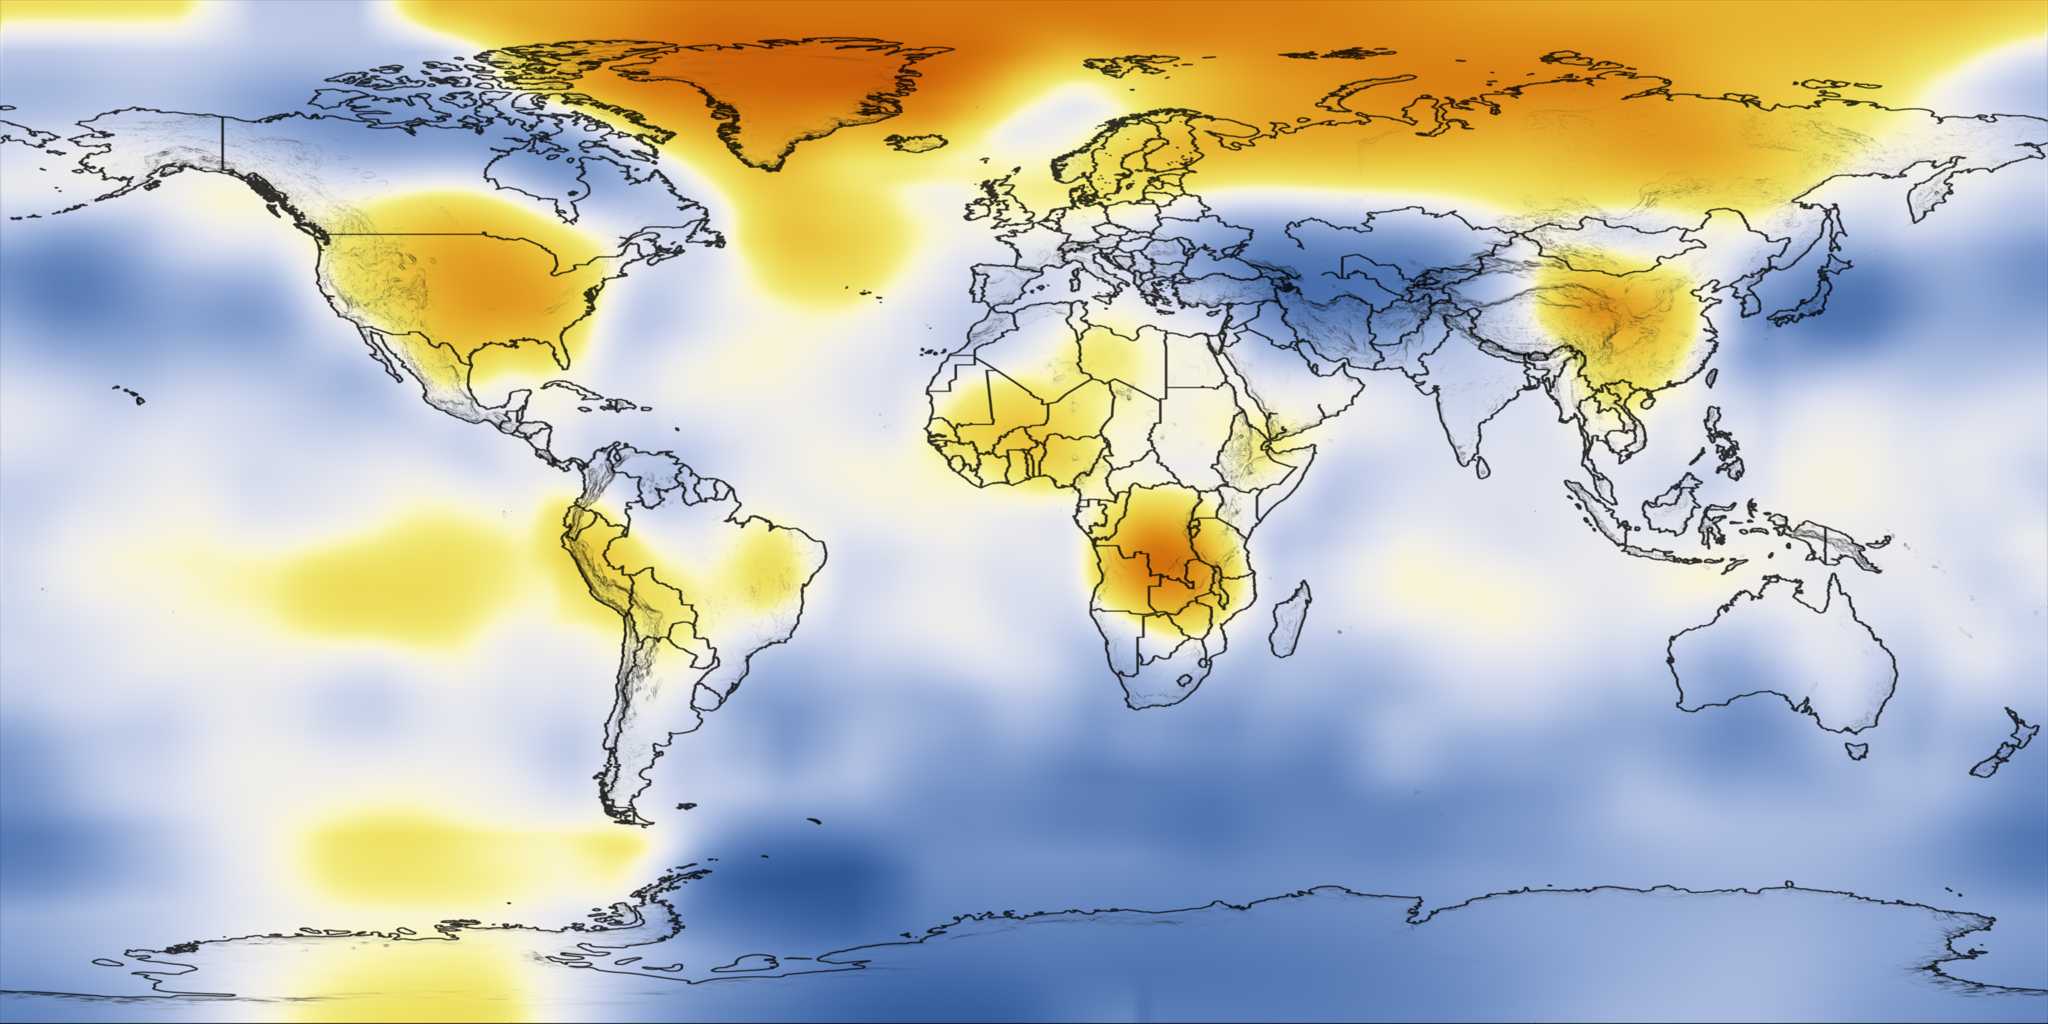
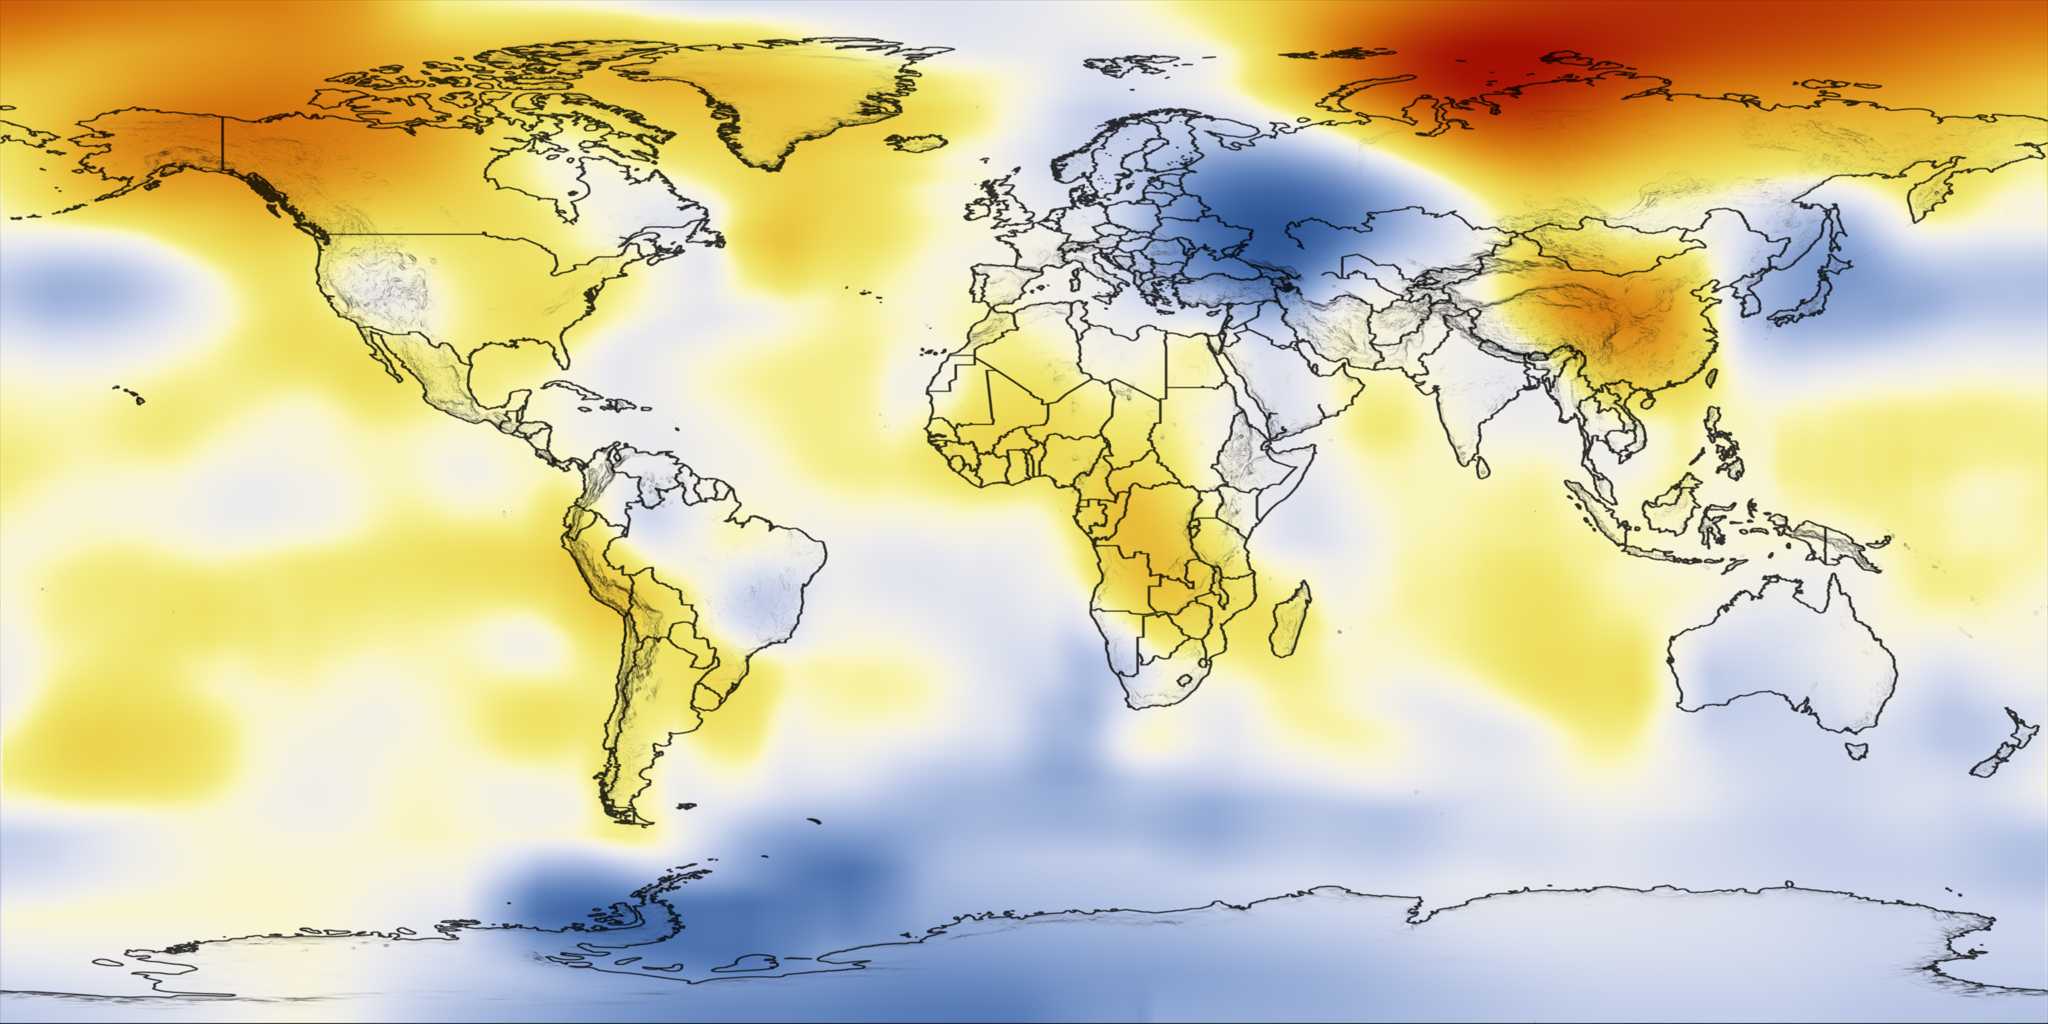
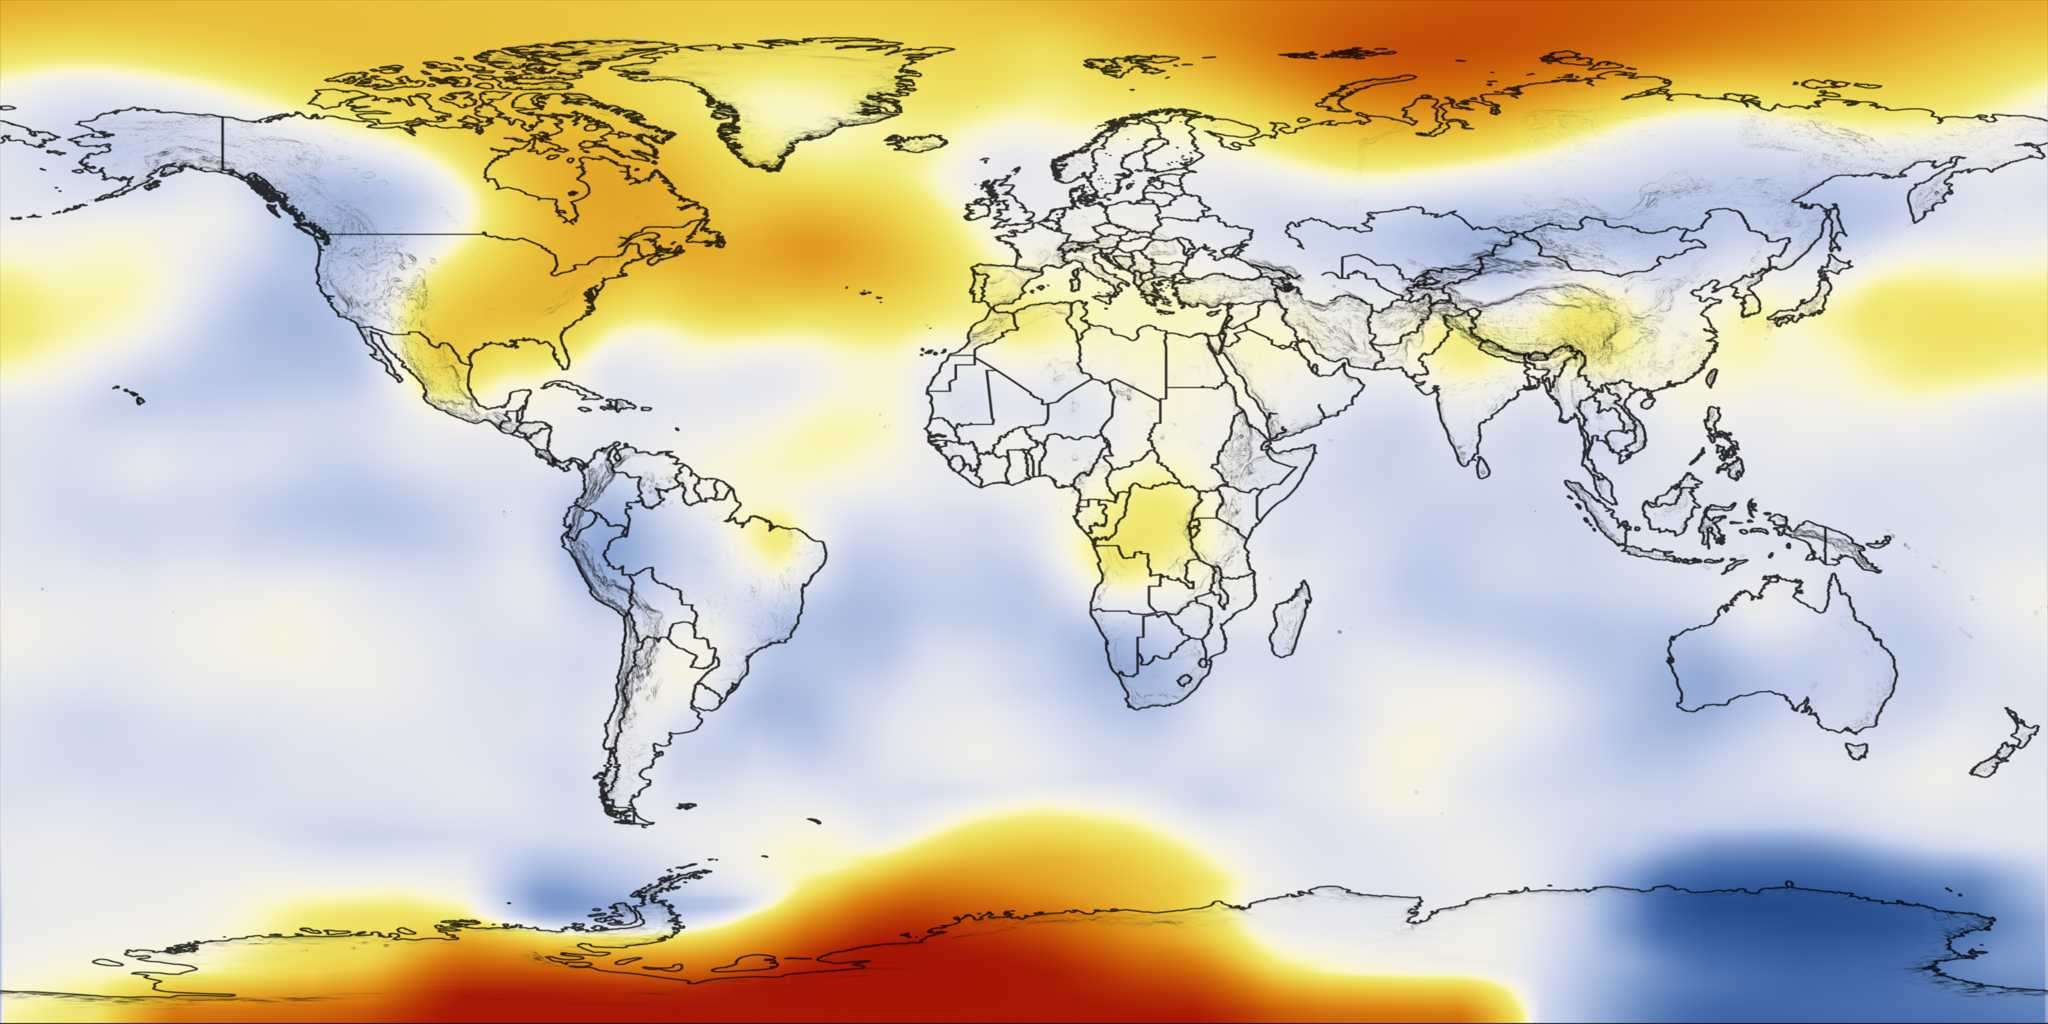
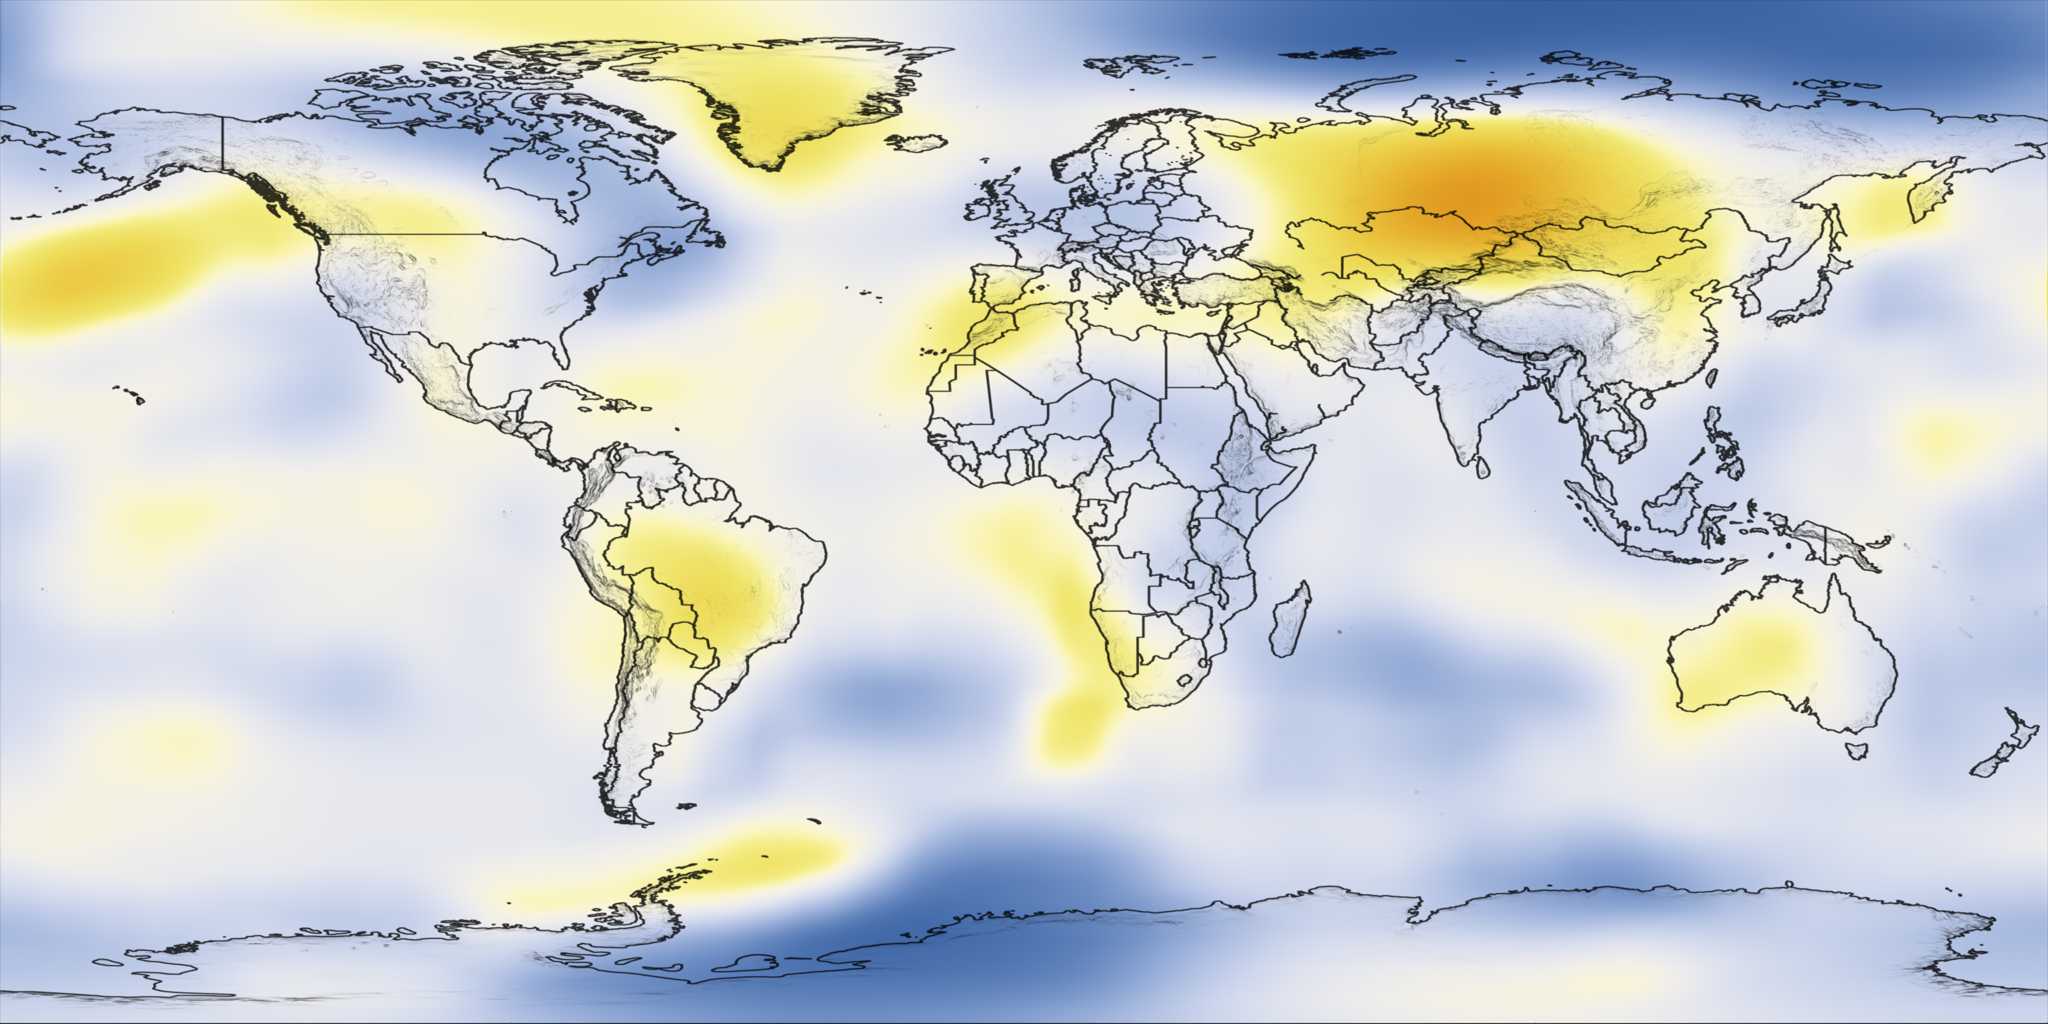
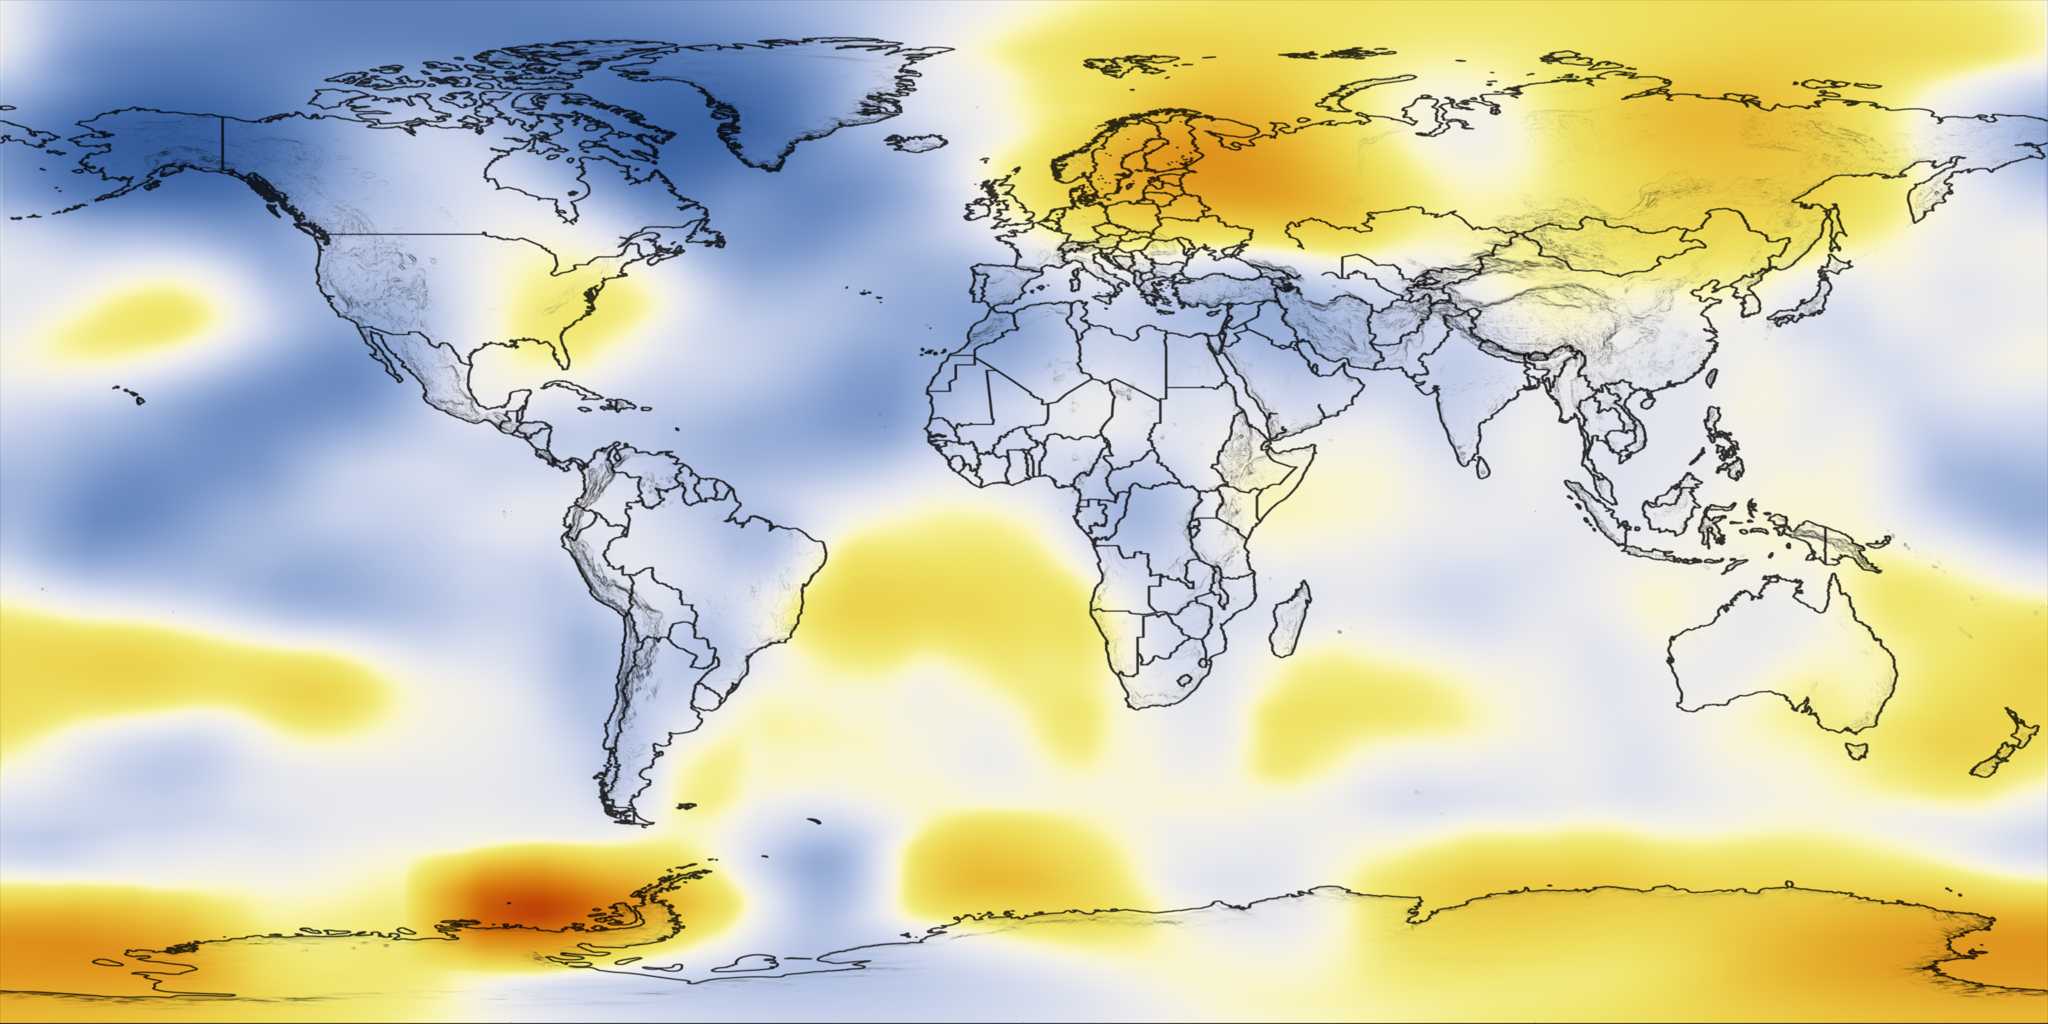
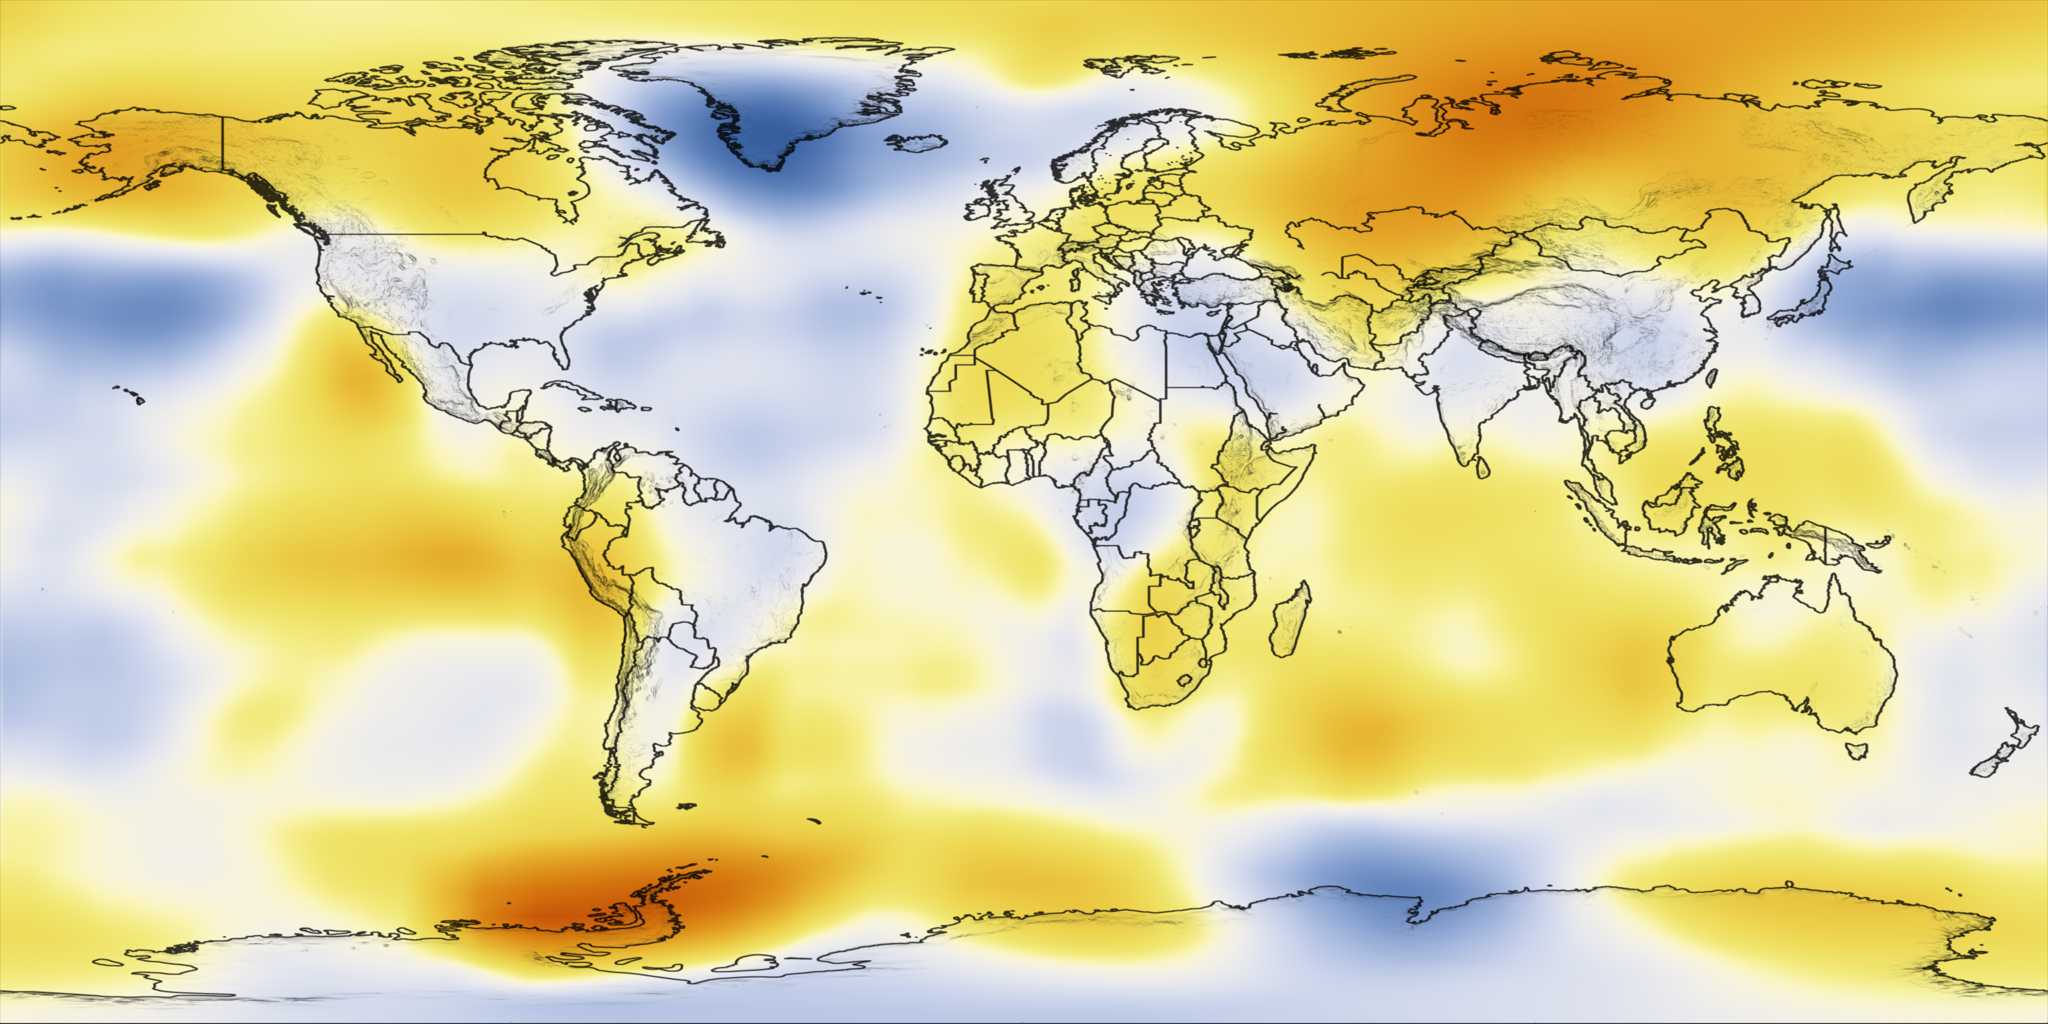
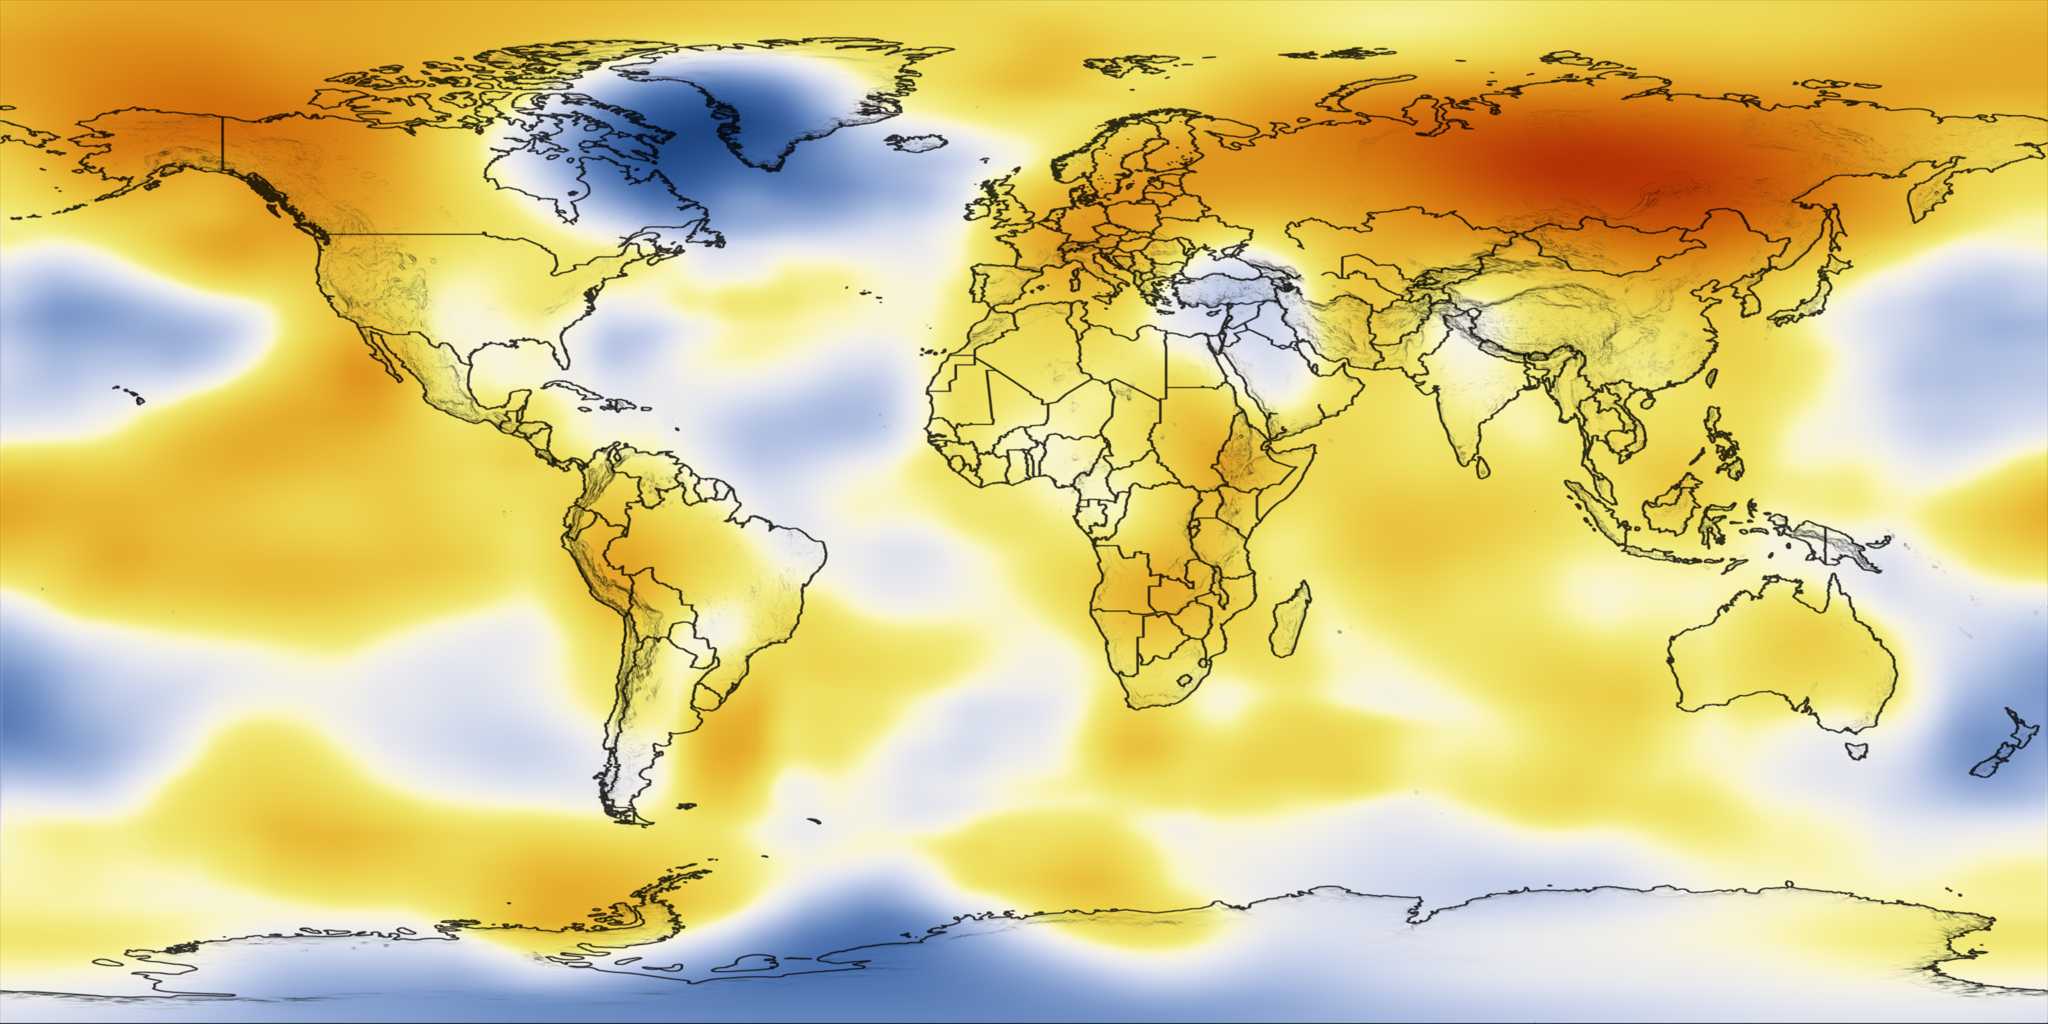
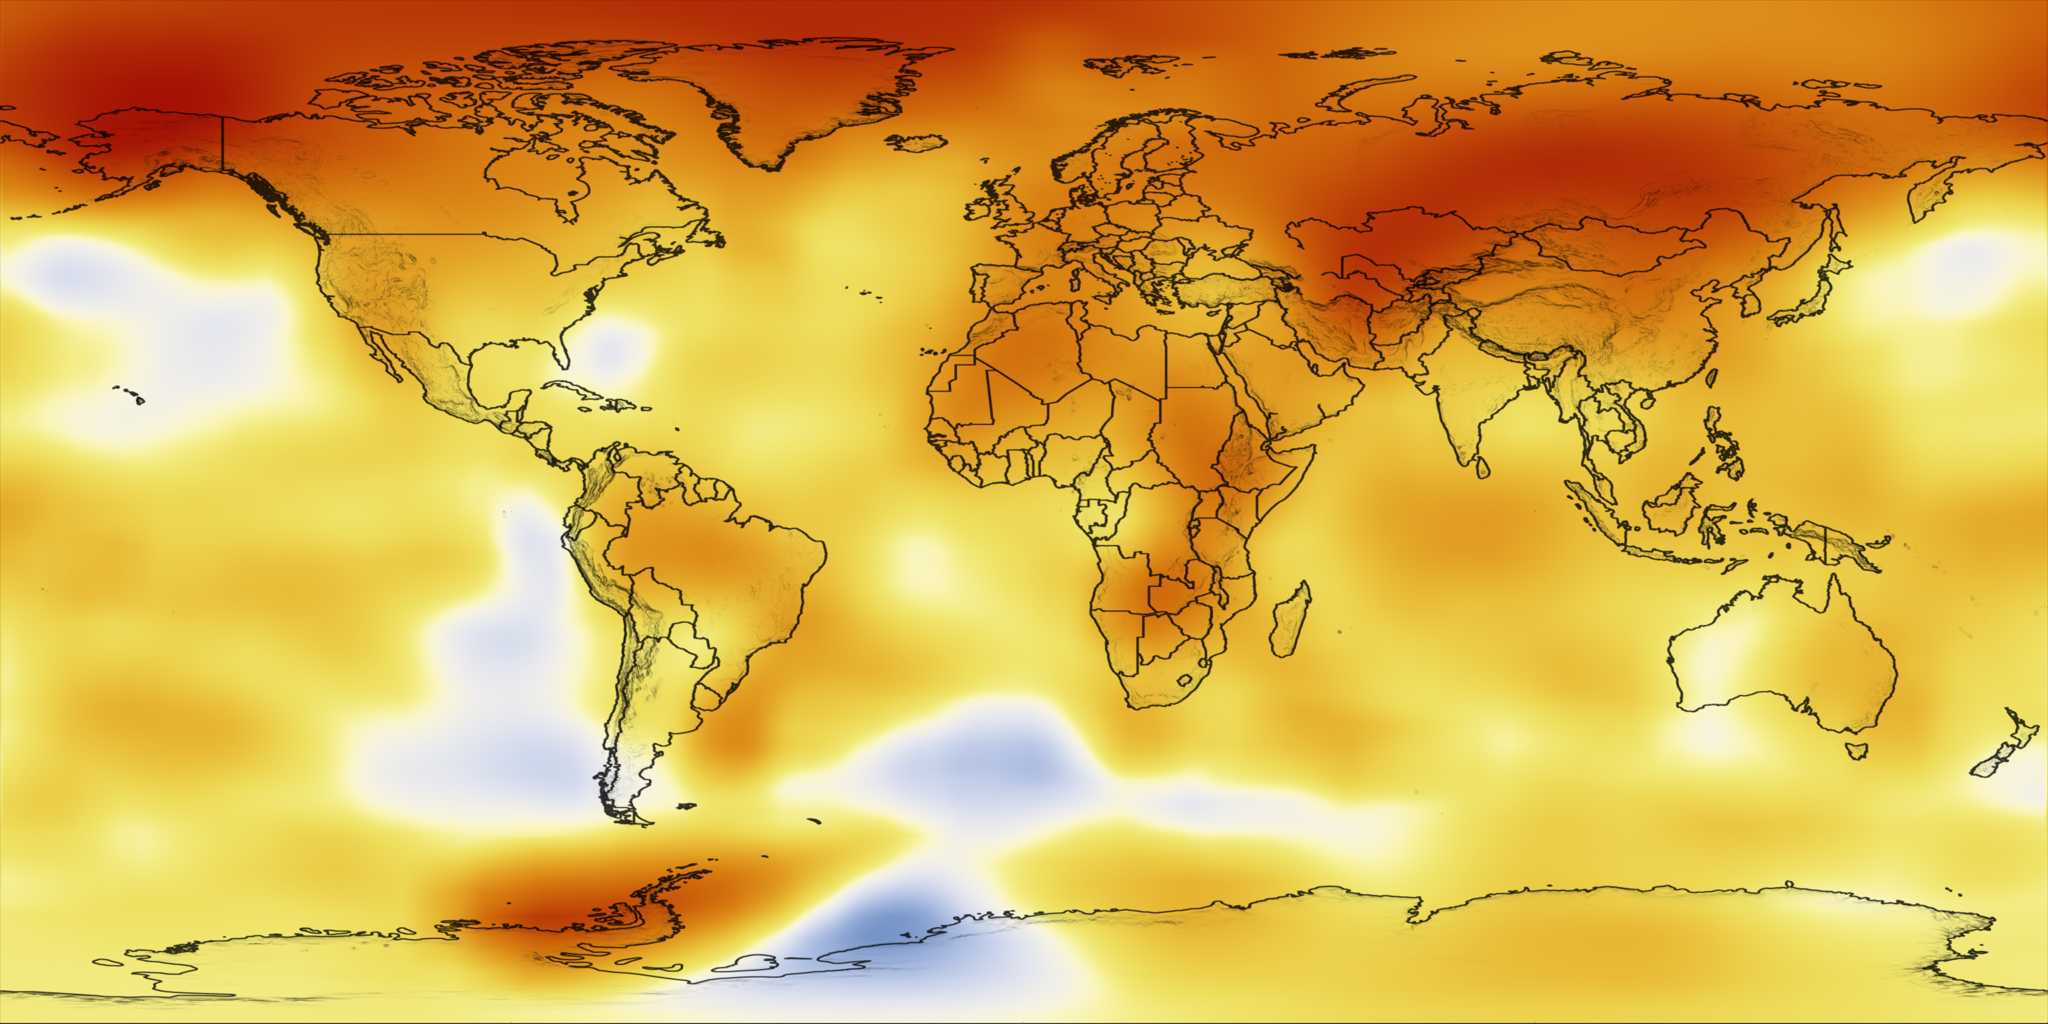
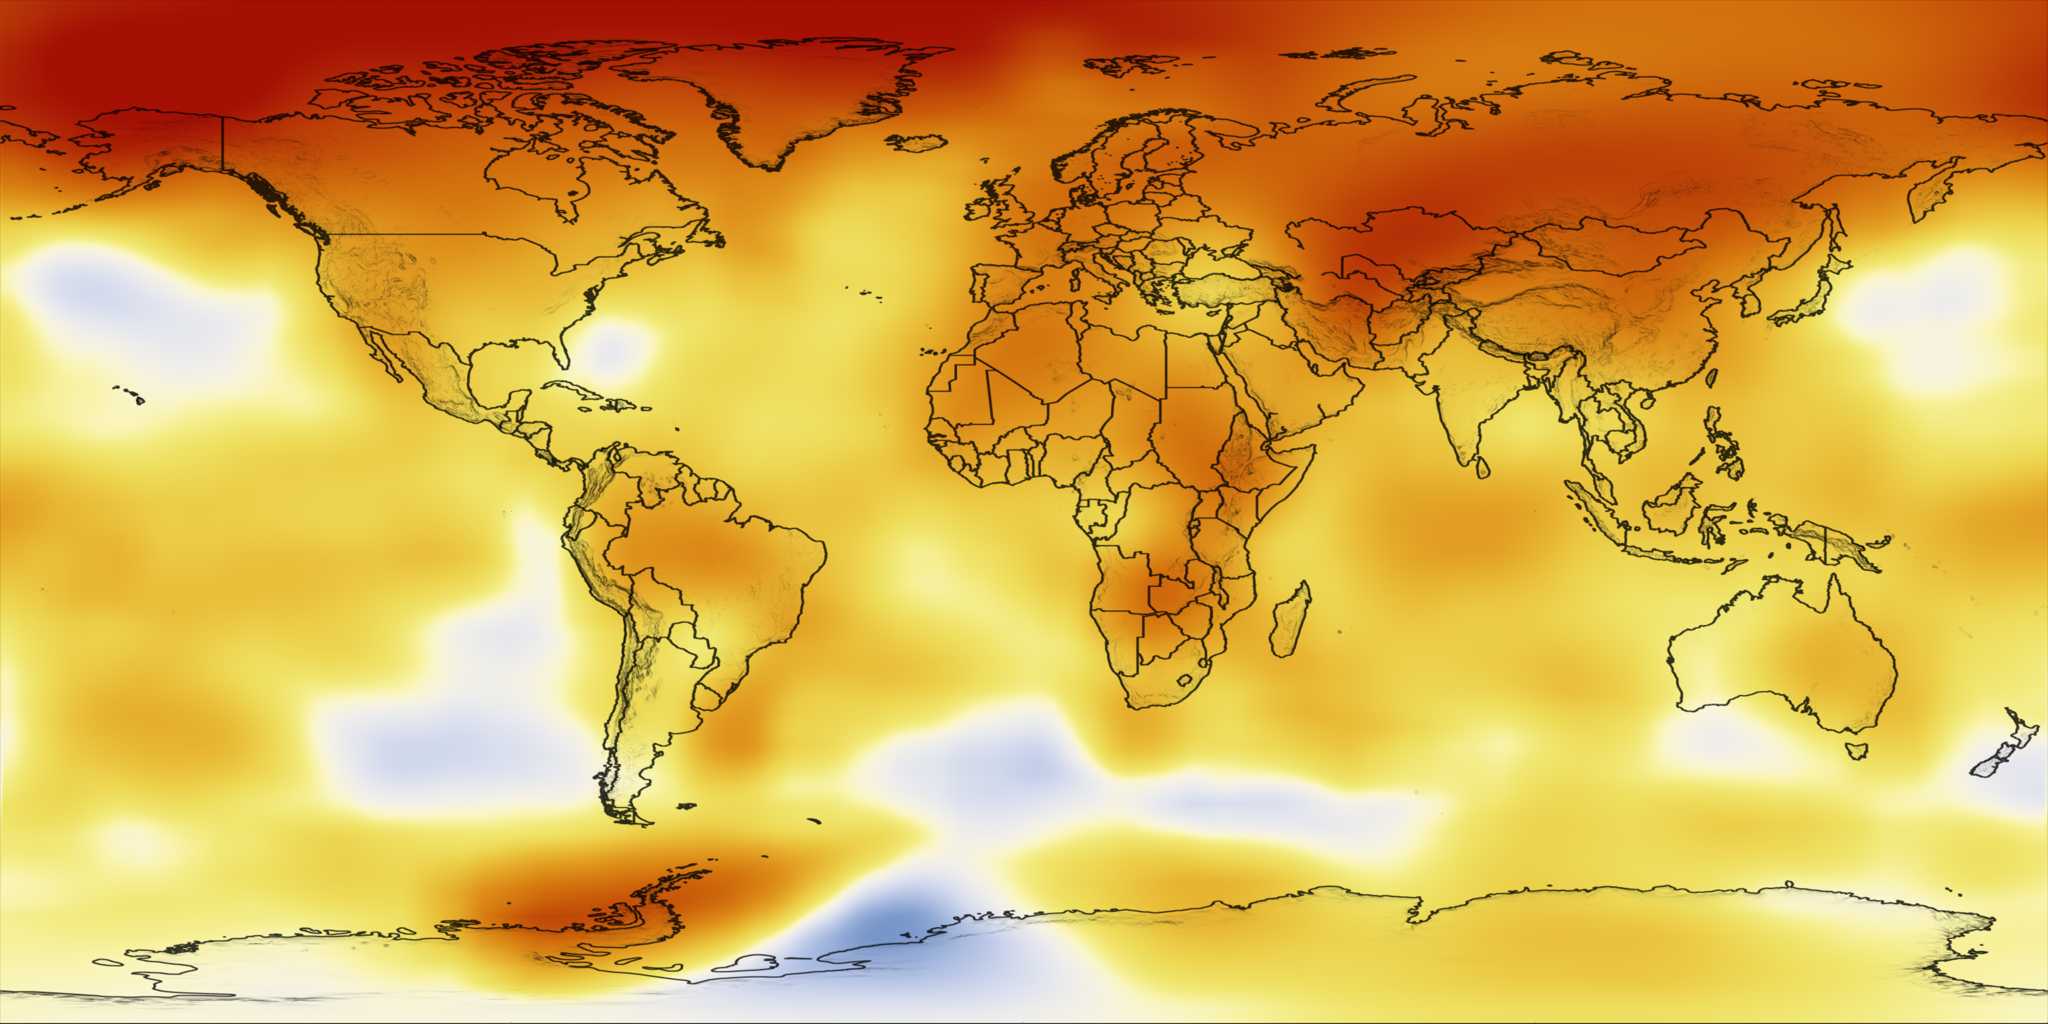
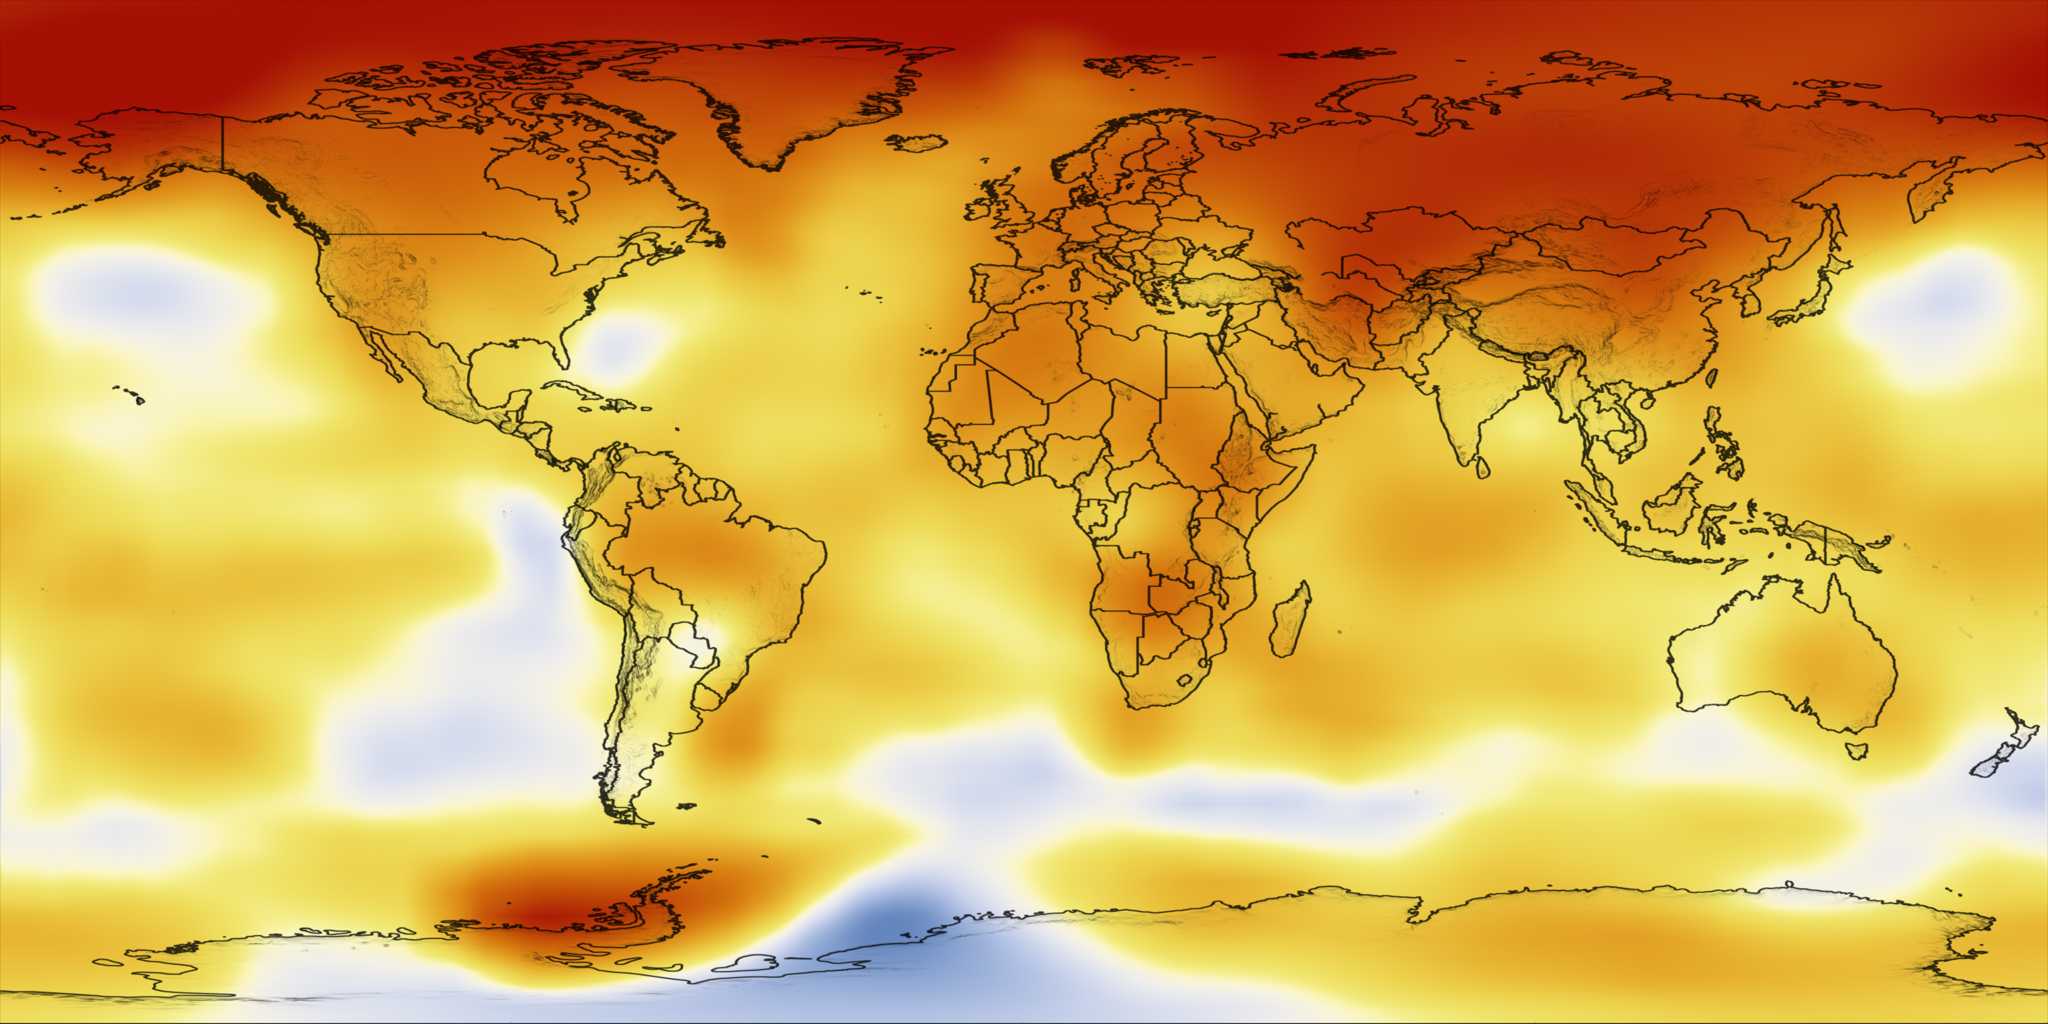
Five-Year Average Global Temperature Anomalies from 1881 to 2008 for Science On a Sphere
Visualization Credits
Lori Perkins (NASA/GSFC): Lead Animator
James Hansen Ph.D. (NASA/GSFC GISS): Scientist
Makiko Sato Ph.D. (NASA/GSFC GISS): Scientist
Reto A. Ruedy Ph.D. (NASA/GSFC GISS): Scientist
Ken Lo Ph.D. (NASA/GSFC GISS): Scientist
David Lea Ph.D. (University of California, Santa Barbara): Scientist
Martin Medina-Elizade (University of California, Santa Barbara): Scientist
Please give credit for this item to:
NASA/Goddard Space Flight Center Scientific Visualization Studio Data provided by Robert B. Schmunk (NASA/GSFC GISS)
NASA/Goddard Space Flight Center Scientific Visualization Studio Data provided by Robert B. Schmunk (NASA/GSFC GISS)
Science Paper:
http://www.nasa.gov/topics/earth/features/earth_temp.html
Short URL to share this page:
https://svs.gsfc.nasa.gov/3596
Data Used:
Note: While we identify the data sets used in these visualizations, we do not store any further details nor the data sets themselves on our site.
Dates of Data Used:
1880 - 2007
This item is part of these series:
Agriculture Animations - Climate Change
Global Temperature Anomalies
Keywords:
SVS >> Climate
SVS >> Global Warming
SVS >> HDTV
DLESE >> Physical oceanography
GCMD >> Earth Science >> Biosphere >> Ecological Dynamics >> Extinction
GCMD >> Earth Science >> Climate Indicators >> Teleconnections >> El Nino Southern Oscillation
GCMD >> Earth Science >> Oceans >> Coastal Processes >> Sea Level Rise
SVS >> Model Data
SVS >> iPod
SVS >> Science On a Sphere
SVS >> For Educators
SVS >> Global Temperature
SVS >> Surface Air Temperature
NASA Science >> Earth
GCMD keywords can be found on the Internet with the following citation: Olsen, L.M., G. Major, K. Shein, J. Scialdone, S. Ritz, T. Stevens, M. Morahan, A. Aleman, R. Vogel, S. Leicester, H. Weir, M. Meaux, S. Grebas, C.Solomon, M. Holland, T. Northcutt, R. A. Restrepo, R. Bilodeau, 2013. NASA/Global Change Master Directory (GCMD) Earth Science Keywords. Version 8.0.0.0.0
http://www.nasa.gov/topics/earth/features/earth_temp.html
Short URL to share this page:
https://svs.gsfc.nasa.gov/3596
Data Used:
GISS Surface Temperature Analysis (GISTEMP)/GISTEMP
Model - NASA/GISS - 1880 - 2007Dates of Data Used:
1880 - 2007
This item is part of these series:
Agriculture Animations - Climate Change
Global Temperature Anomalies
Keywords:
SVS >> Climate
SVS >> Global Warming
SVS >> HDTV
DLESE >> Physical oceanography
GCMD >> Earth Science >> Biosphere >> Ecological Dynamics >> Extinction
GCMD >> Earth Science >> Climate Indicators >> Teleconnections >> El Nino Southern Oscillation
GCMD >> Earth Science >> Oceans >> Coastal Processes >> Sea Level Rise
SVS >> Model Data
SVS >> iPod
SVS >> Science On a Sphere
SVS >> For Educators
SVS >> Global Temperature
SVS >> Surface Air Temperature
NASA Science >> Earth
GCMD keywords can be found on the Internet with the following citation: Olsen, L.M., G. Major, K. Shein, J. Scialdone, S. Ritz, T. Stevens, M. Morahan, A. Aleman, R. Vogel, S. Leicester, H. Weir, M. Meaux, S. Grebas, C.Solomon, M. Holland, T. Northcutt, R. A. Restrepo, R. Bilodeau, 2013. NASA/Global Change Master Directory (GCMD) Earth Science Keywords. Version 8.0.0.0.0


