Earth
ID: 3581
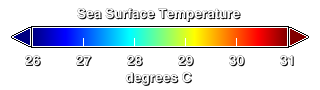
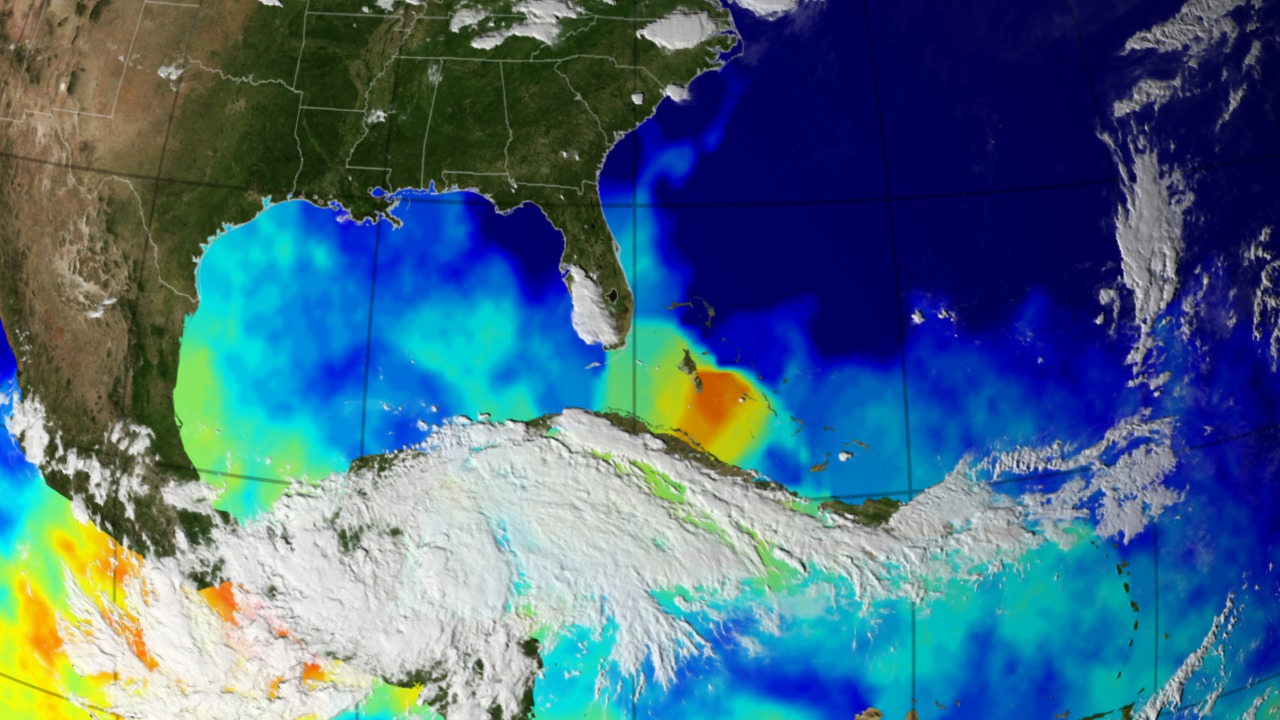
This animation depicts the 2008 hurricane season and the corresponding water temperature, for the dates 6/1/08 through 11/30/08. The colors on the ocean represent the sea surface temperatures, and satellite images of the storm clouds are laid over the temperatures to clearly show the positions of the storms. Hurricane winds are sustained by the heat energy of the warm surface waters of the ocean. As a hurricane passes over the warm surface it churns the water, drawing the deeper, cooler water to the surface. This mixing can appear in the animation as a blue pool trailing the hurricane. The sea surface temperature data was taken by the AMSR-E instrument on the Aqua satellite, while the cloud images were taken by the Imager on the GOES-12 satellite.
2008 Hurricane Season with Sea Surface Temperature
Visualization Credits
Trent L. Schindler (UMBC): Lead Animator
Please give credit for this item to:
NASA/Goddard Space Flight Center Scientific Visualization Studio
NASA/Goddard Space Flight Center Scientific Visualization Studio
Short URL to share this page:
https://svs.gsfc.nasa.gov/3581
Data Used:
Note: While we identify the data sets used in these visualizations, we do not store any further details nor the data sets themselves on our site.
Keywords:
SVS >> HDTV
SVS >> SST
GCMD >> Earth Science >> Atmosphere >> Atmospheric Phenomena >> Hurricanes
GCMD >> Earth Science >> Oceans >> Ocean Temperature >> Sea Surface Temperature
SVS >> GOES
SVS >> Copenhagen
SVS >> For Educators
SVS >> Hurricanes >> Jeanne
NASA Science >> Earth
GCMD keywords can be found on the Internet with the following citation: Olsen, L.M., G. Major, K. Shein, J. Scialdone, S. Ritz, T. Stevens, M. Morahan, A. Aleman, R. Vogel, S. Leicester, H. Weir, M. Meaux, S. Grebas, C.Solomon, M. Holland, T. Northcutt, R. A. Restrepo, R. Bilodeau, 2013. NASA/Global Change Master Directory (GCMD) Earth Science Keywords. Version 8.0.0.0.0
https://svs.gsfc.nasa.gov/3581
Data Used:
Aqua/AMSR-E
For more information, please click http://wwwghcc.msfc.nasa.gov/AMSR/
GOES-12/Imager
Keywords:
SVS >> HDTV
SVS >> SST
GCMD >> Earth Science >> Atmosphere >> Atmospheric Phenomena >> Hurricanes
GCMD >> Earth Science >> Oceans >> Ocean Temperature >> Sea Surface Temperature
SVS >> GOES
SVS >> Copenhagen
SVS >> For Educators
SVS >> Hurricanes >> Jeanne
NASA Science >> Earth
GCMD keywords can be found on the Internet with the following citation: Olsen, L.M., G. Major, K. Shein, J. Scialdone, S. Ritz, T. Stevens, M. Morahan, A. Aleman, R. Vogel, S. Leicester, H. Weir, M. Meaux, S. Grebas, C.Solomon, M. Holland, T. Northcutt, R. A. Restrepo, R. Bilodeau, 2013. NASA/Global Change Master Directory (GCMD) Earth Science Keywords. Version 8.0.0.0.0


