Planets and Moons
ID: 3520
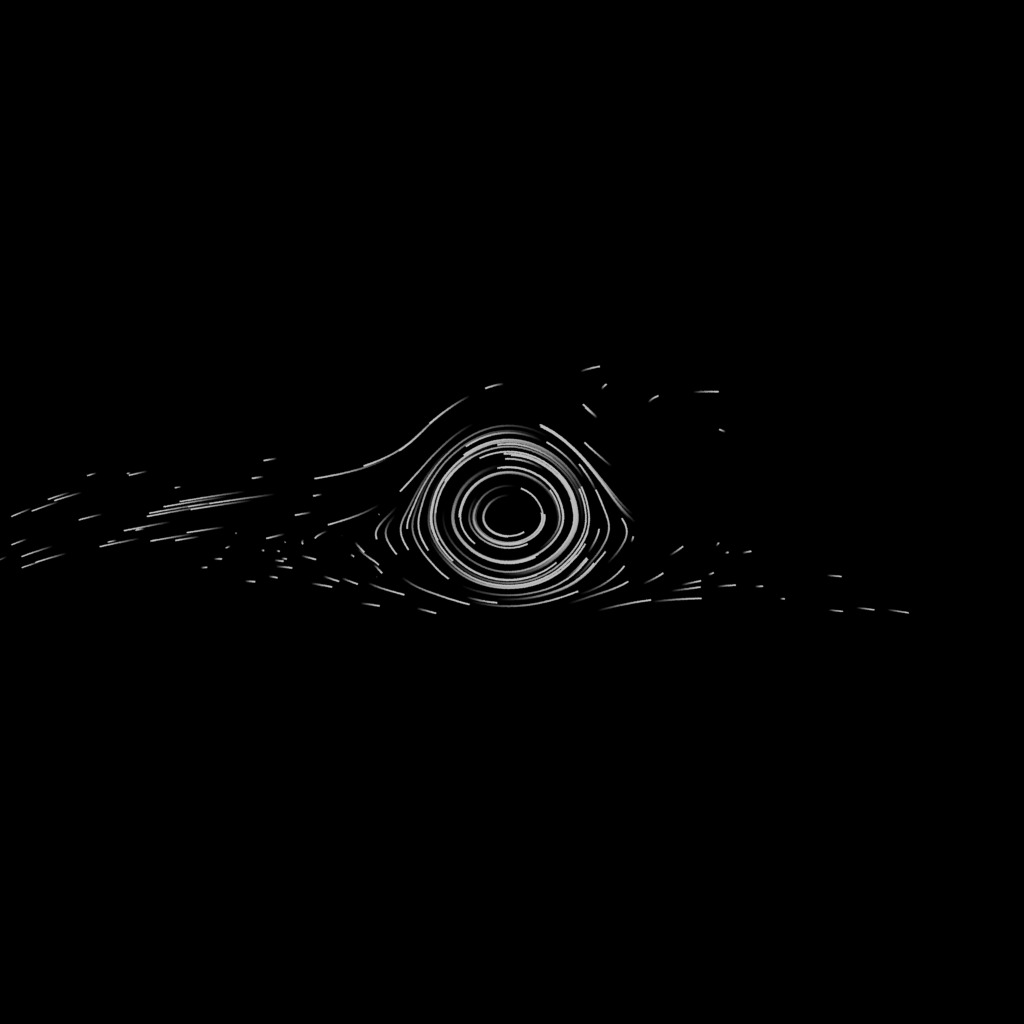
This visualization shows a simple simulated flow field representation of Jupiter's Great Red Spot. The flow field is static (i.e., the wind directions don't change over time).
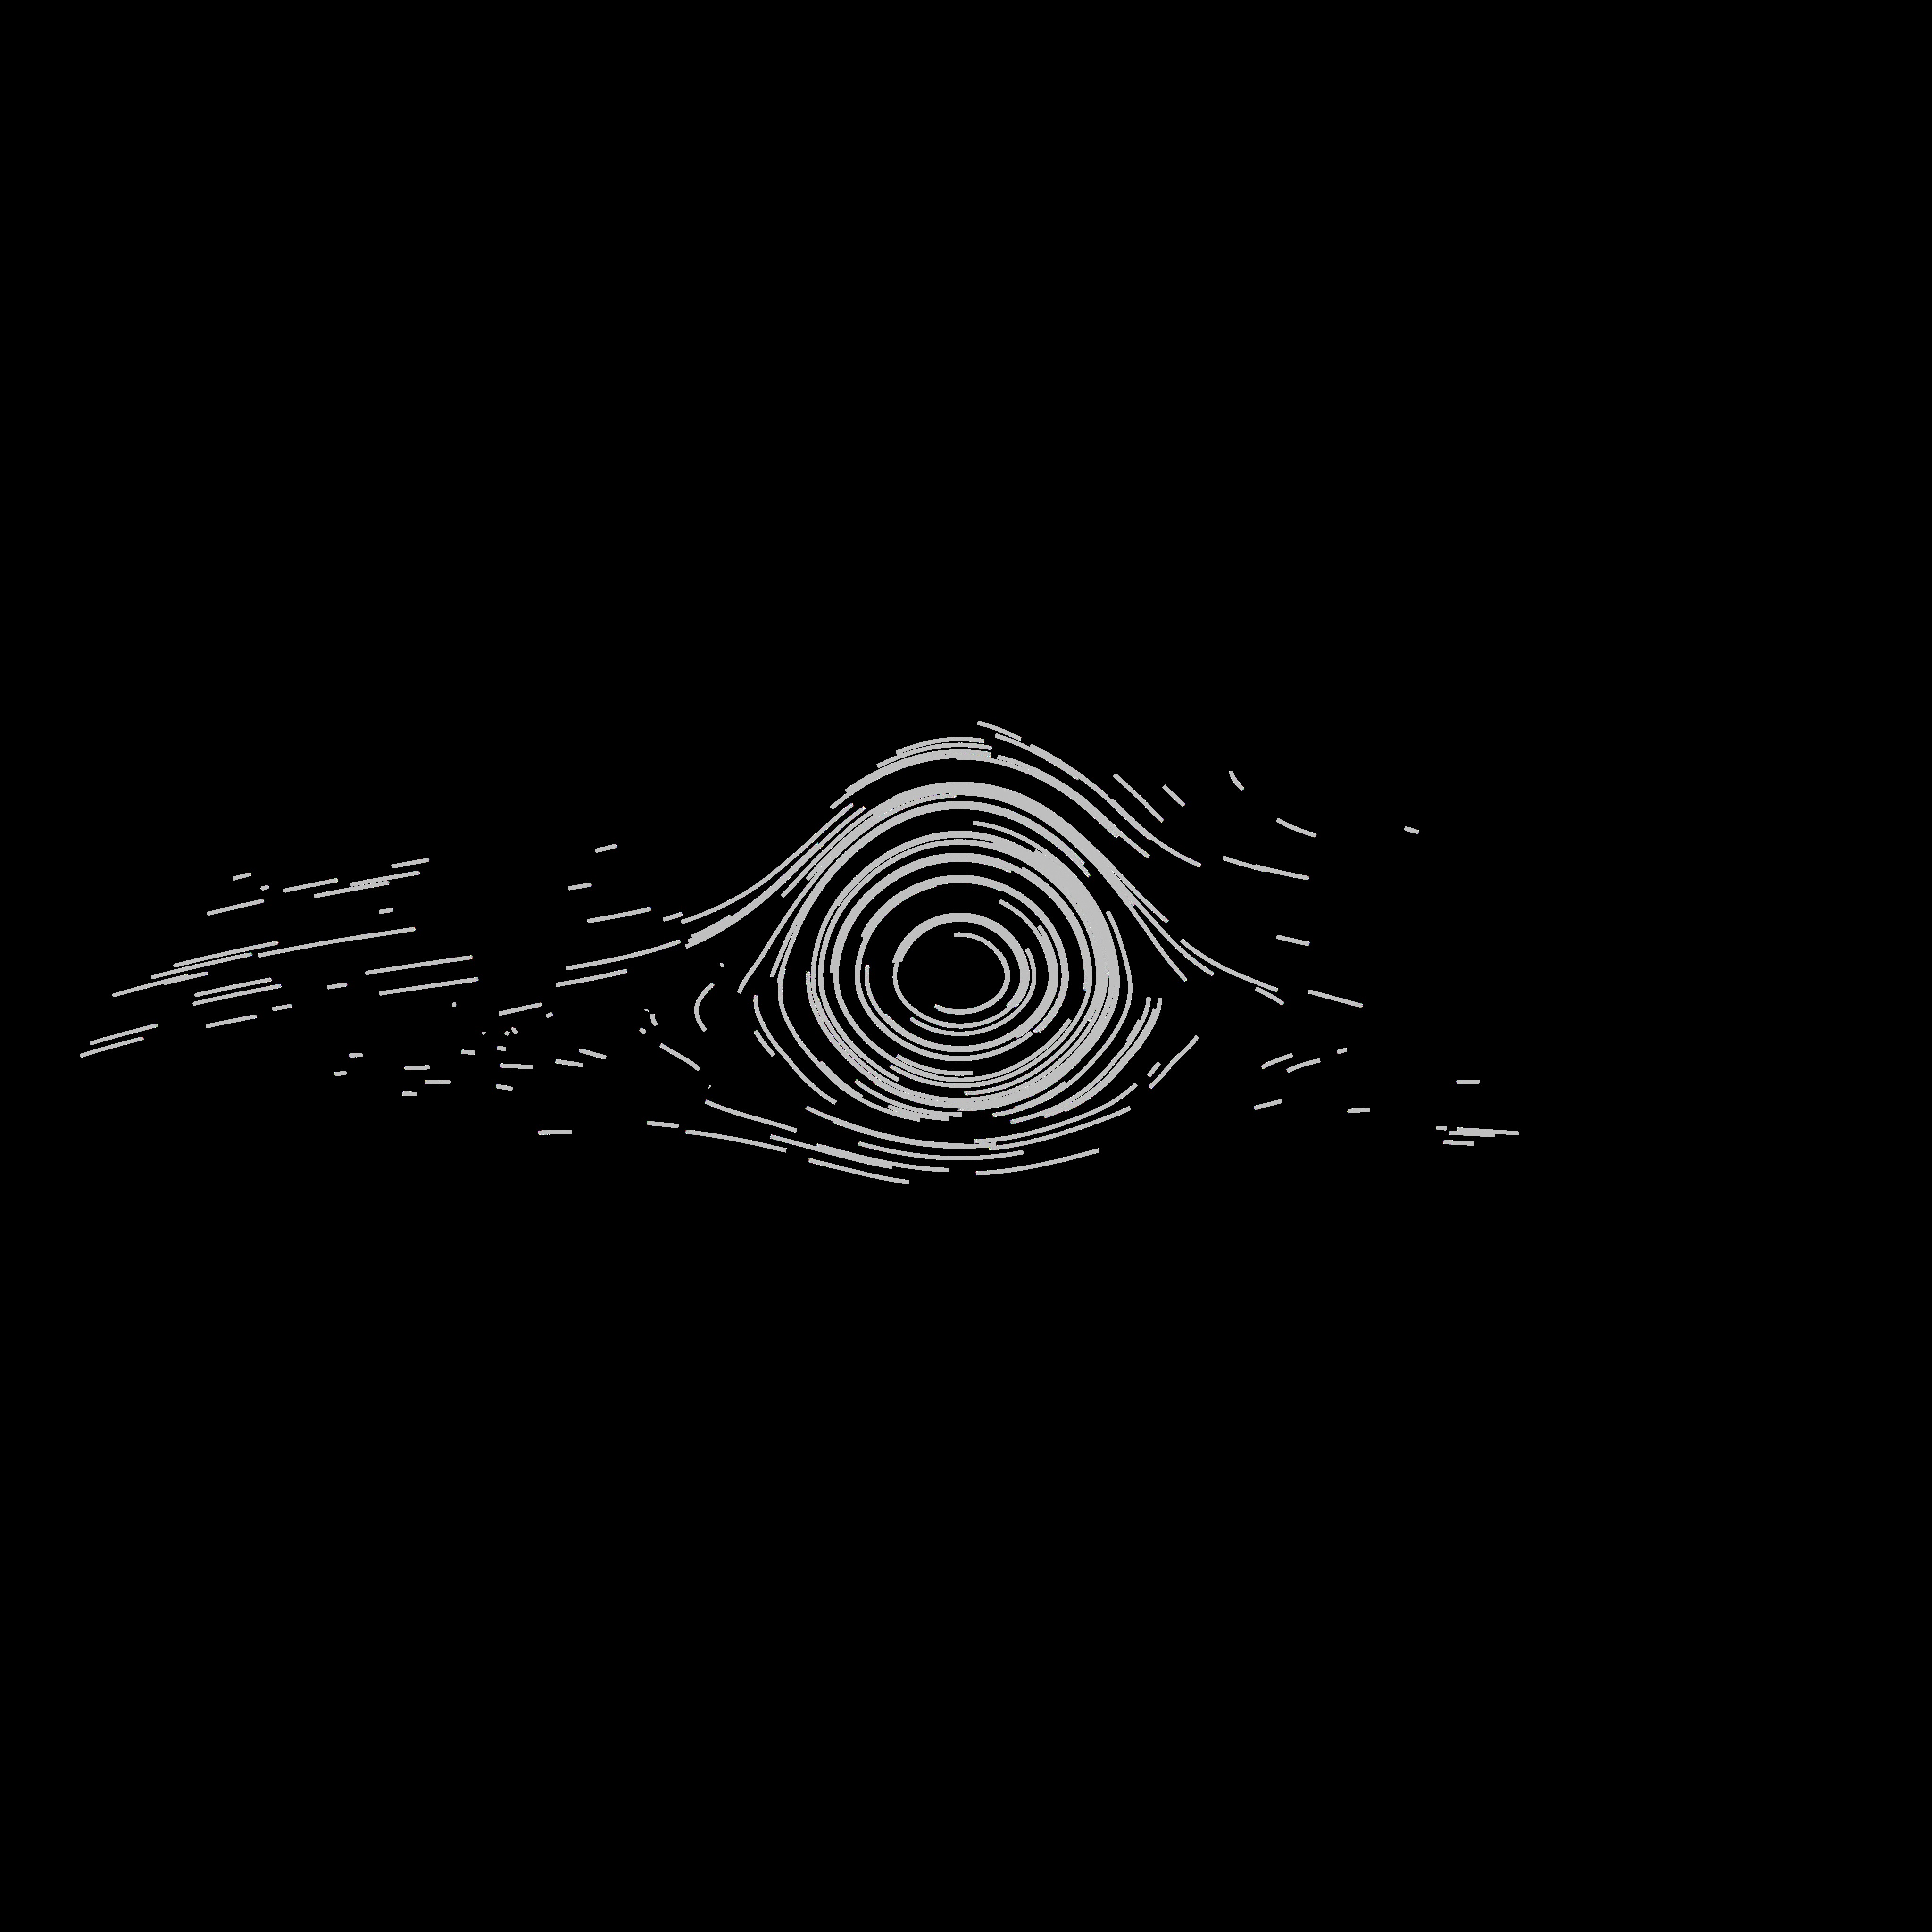
Flow Field Representation of Jupiter's Great Red Spot
This visualization was created in support of the Science On a Sphere film called "Largest" which is about Jupiter. These frames were rendered "flat" and are intended to be duplicated several times around the sphere.
Visualization Credits
Greg Shirah (NASA/GSFC): Lead Animator
Tom Bridgman (Global Science and Technology, Inc.): Lead Animator
Victoria Weeks (HTSI): Video Editor
Michael Starobin (HTSI): Producer
Amy A. Simon (NASA/GSFC): Scientist
Tom Bridgman (Global Science and Technology, Inc.): Lead Animator
Victoria Weeks (HTSI): Video Editor
Michael Starobin (HTSI): Producer
Amy A. Simon (NASA/GSFC): Scientist
Please give credit for this item to:
NASA/Goddard Space Flight Center Scientific Visualization Studio
NASA/Goddard Space Flight Center Scientific Visualization Studio
Short URL to share this page:
https://svs.gsfc.nasa.gov/3520
Data Used:
Note: While we identify the data sets used in these visualizations, we do not store any further details nor the data sets themselves on our site.
This item is part of these series:
Science On a Sphere
SOS Production - LARGEST
Keywords:
SVS >> Jupiter
SVS >> Storm
SVS >> Science On a Sphere
SVS >> Planets
SVS >> For Educators
SVS >> Jupiter >> Great Red Spot
SVS >> Jupiter >> Storms
SVS >> Jupiter >> Atmosphere
NASA Science >> Planets and Moons
https://svs.gsfc.nasa.gov/3520
Data Used:
Simulated Jupiter Wind Flow Field
Model - 2000This item is part of these series:
Science On a Sphere
SOS Production - LARGEST
Keywords:
SVS >> Jupiter
SVS >> Storm
SVS >> Science On a Sphere
SVS >> Planets
SVS >> For Educators
SVS >> Jupiter >> Great Red Spot
SVS >> Jupiter >> Storms
SVS >> Jupiter >> Atmosphere
NASA Science >> Planets and Moons


