Earth
ID: 3506
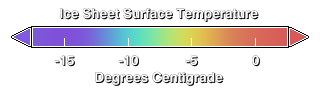
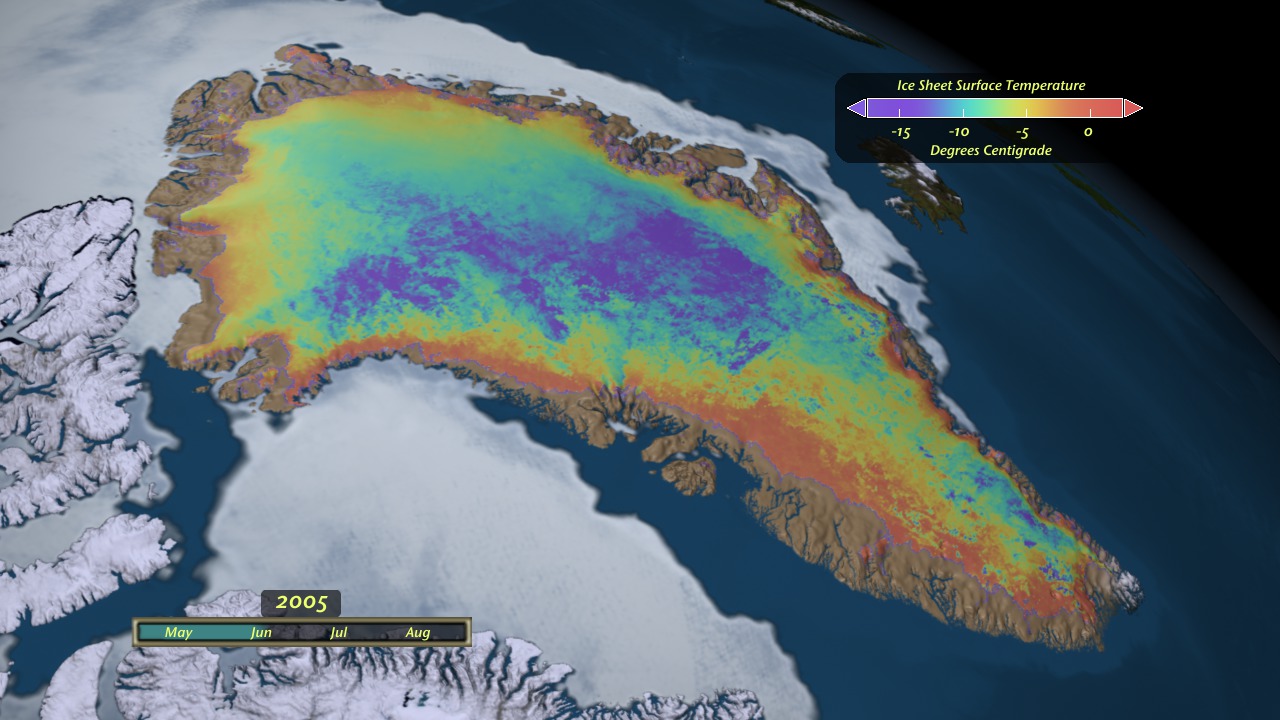
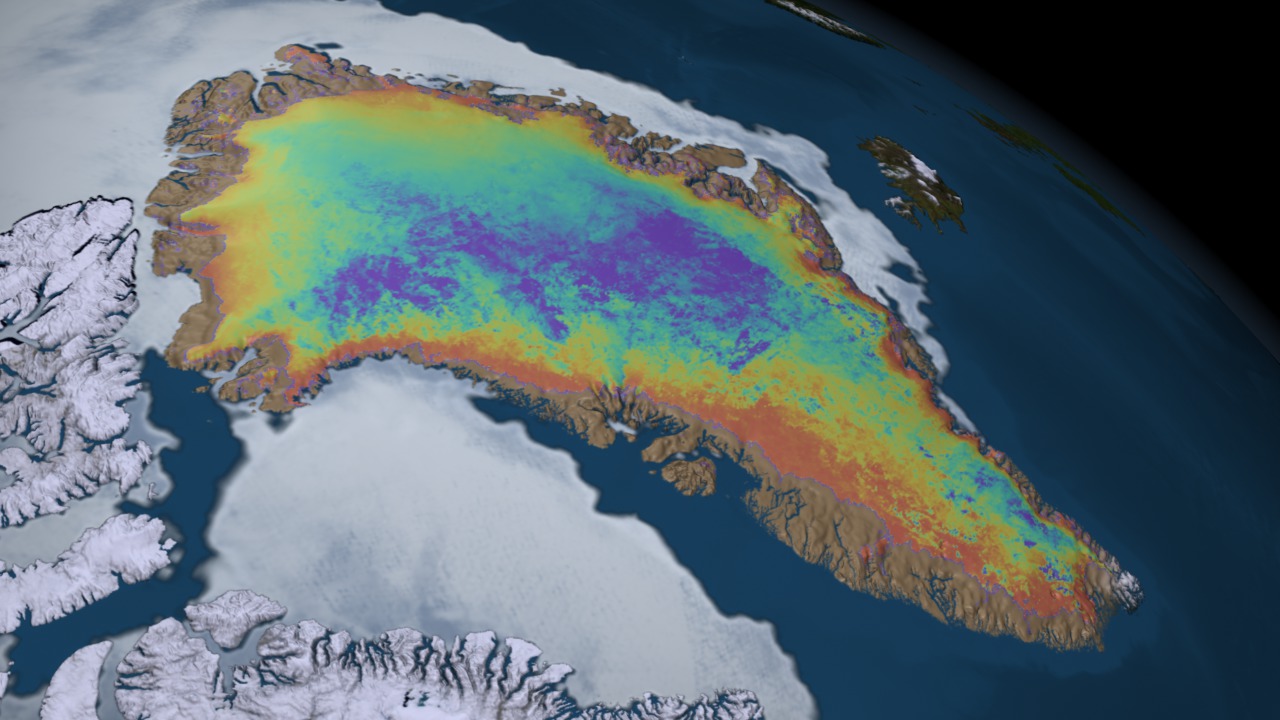
The surface temperature of the Greenland Ice Sheet is a sensitive indicator of surface melt extent, frequency, timing and duration. The daily clear-sky surface temperature of the Greenland Ice Sheet was measured using MODIS-derived land surface temperature (LST) data-product maps. For this animation, an 8-day moving average of clear-sky surface temperature was generated from May 1 through September 1, 2005. Coldest temperatures are shown here in violet and blue, while warmer temperatures nearing the melting point of zero degrees centigrade are shown in orange and red. The summer season is repeated two times in this animation.
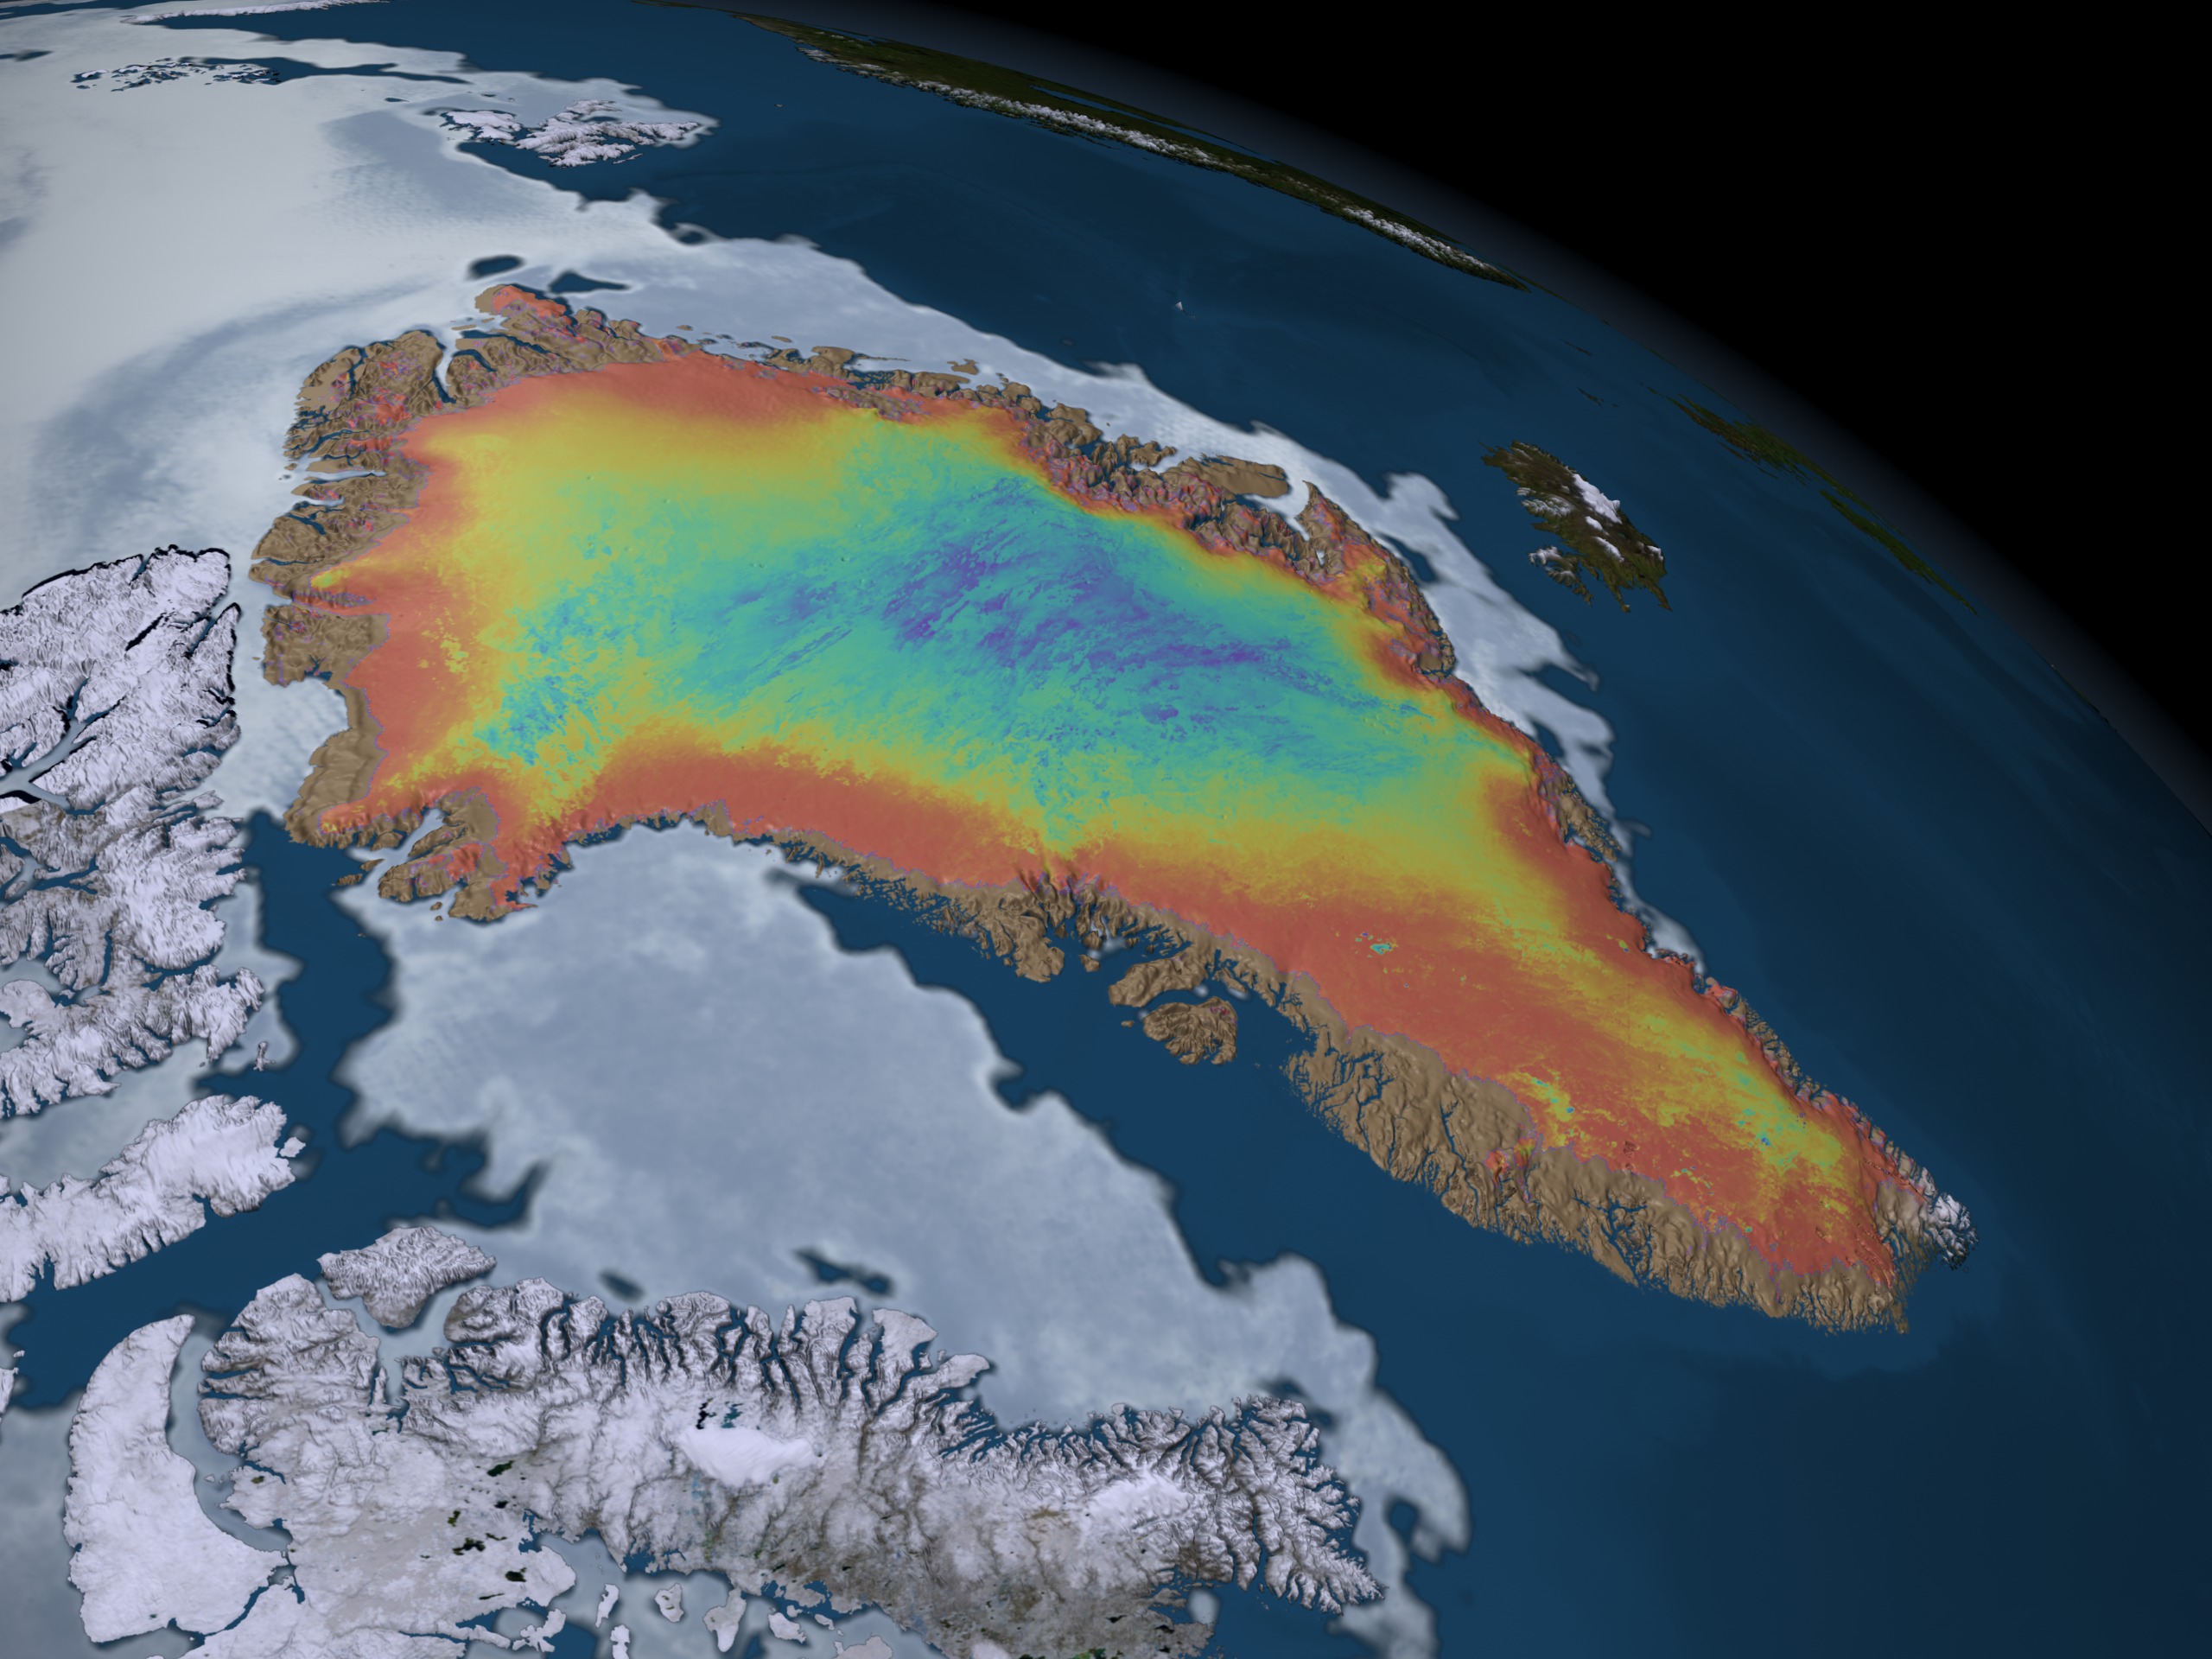
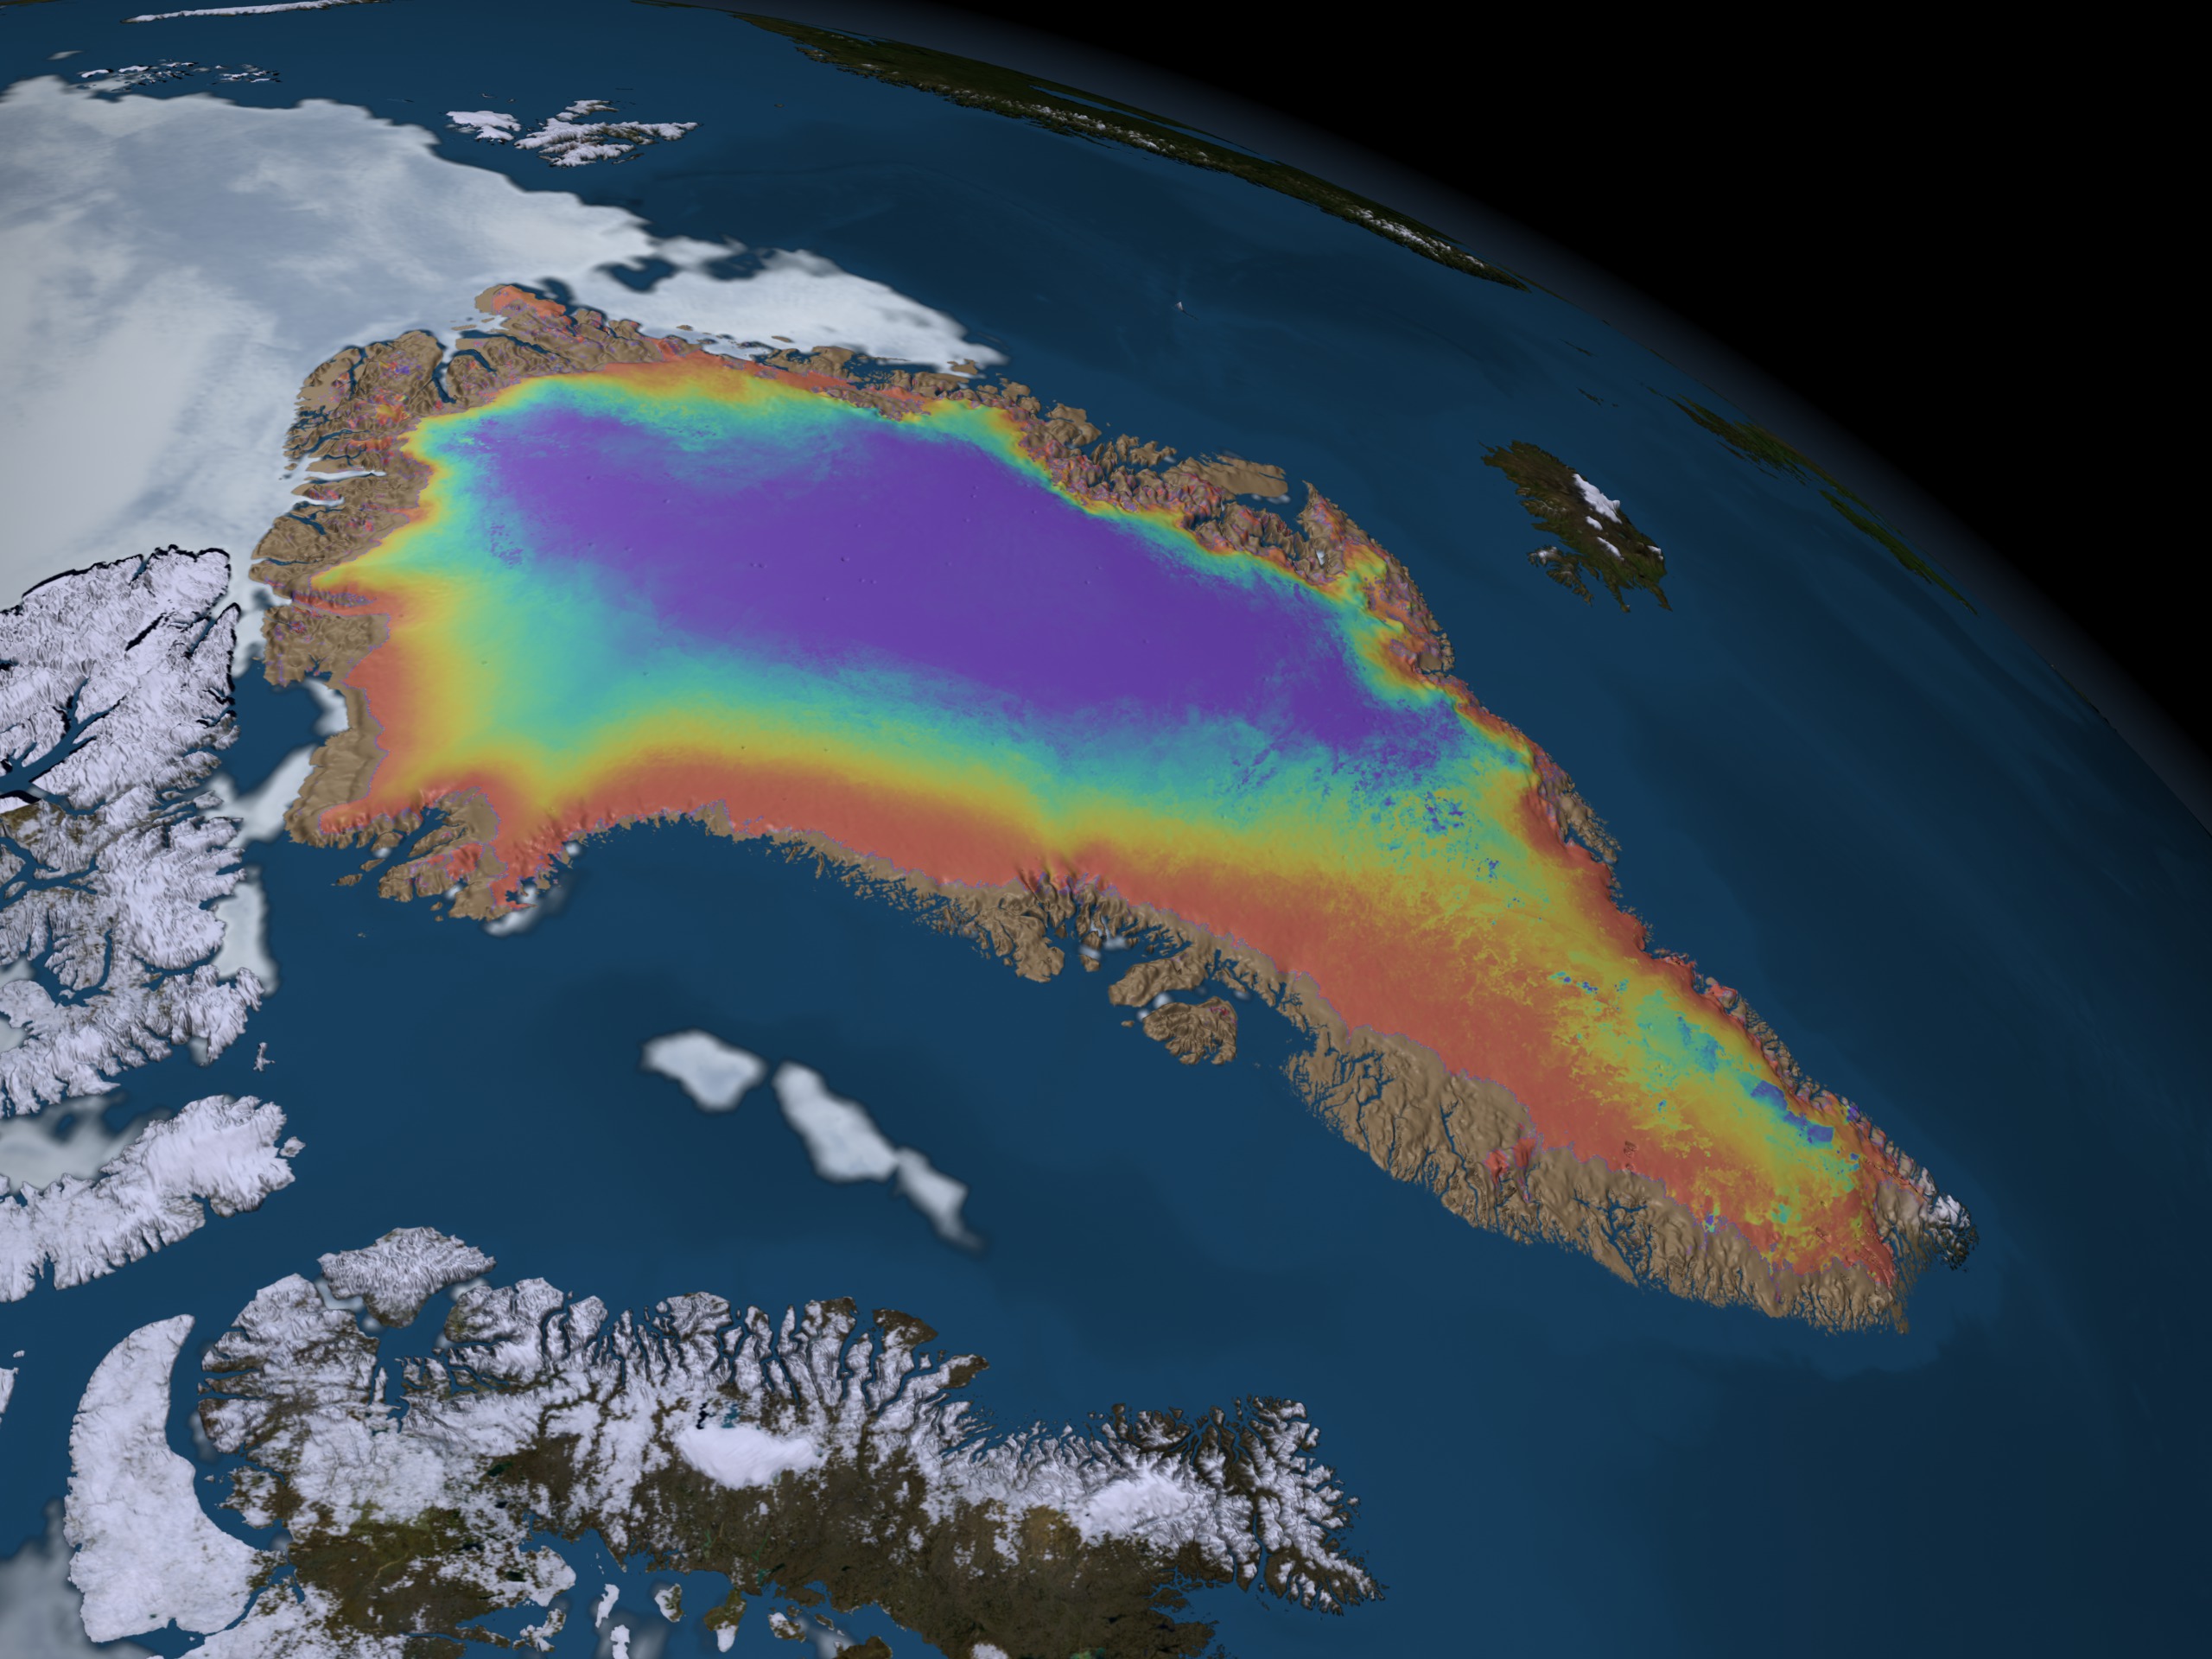
Surface Temperature of the Greenland Ice Sheet During the Summer of 2005
Visualization Credits
Cindy Starr (Global Science and Technology, Inc.): Lead Visualizer
Sarah DeWitt (NASA/GSFC): Producer
Dorothy Hall (NASA/GSFC): Scientist
Nicolo DiGirolamo (SSAI): Scientist
Sarah DeWitt (NASA/GSFC): Producer
Dorothy Hall (NASA/GSFC): Scientist
Nicolo DiGirolamo (SSAI): Scientist
Please give credit for this item to:
NASA/Goddard Space Flight Center Scientific Visualization Studio The Next Generation Blue Marble data is courtesy of Reto Stockli (NASA/GSFC).
NASA/Goddard Space Flight Center Scientific Visualization Studio The Next Generation Blue Marble data is courtesy of Reto Stockli (NASA/GSFC).
Short URL to share this page:
https://svs.gsfc.nasa.gov/3506
Mission:
Terra
Data Used:
Note: While we identify the data sets used in these visualizations, we do not store any further details nor the data sets themselves on our site.
Keywords:
DLESE >> Cryology
SVS >> HDTV
SVS >> Surface Temperature
GCMD >> Earth Science >> Cryosphere
GCMD >> Earth Science >> Cryosphere >> Snow/Ice
GCMD >> Earth Science >> Hydrosphere >> Snow/Ice
GCMD >> Earth Science >> Cryosphere >> Sea Ice >> Ice Temperature
GCMD >> Earth Science >> Cryosphere >> Snow/Ice >> Snow/Ice Temperature
GCMD >> Earth Science >> Hydrosphere >> Snow/Ice >> Snow/Ice Temperature
GCMD >> Earth Science >> Oceans >> Sea Ice >> Ice Temperature
SVS >> For Educators
NASA Science >> Earth
GCMD keywords can be found on the Internet with the following citation: Olsen, L.M., G. Major, K. Shein, J. Scialdone, S. Ritz, T. Stevens, M. Morahan, A. Aleman, R. Vogel, S. Leicester, H. Weir, M. Meaux, S. Grebas, C.Solomon, M. Holland, T. Northcutt, R. A. Restrepo, R. Bilodeau, 2013. NASA/Global Change Master Directory (GCMD) Earth Science Keywords. Version 8.0.0.0.0
https://svs.gsfc.nasa.gov/3506
Mission:
Terra
Data Used:
Terra and Aqua/MODIS/Land Surface Temperature
2005/05/01 - 2005/09/01Aqua/AMSR-E/Daily L3 12.5km Tb, Sea Ice Concentration, and Snow Depth also referred to as: Sea Ice Concentration
2005/05/01 - 2005/09/01Aqua/AMSR-E/Daily L3 6.25 km 89 GHz Brightness Temperature (Tb)
2005/05/01 - 2005/09/01Keywords:
DLESE >> Cryology
SVS >> HDTV
SVS >> Surface Temperature
GCMD >> Earth Science >> Cryosphere
GCMD >> Earth Science >> Cryosphere >> Snow/Ice
GCMD >> Earth Science >> Hydrosphere >> Snow/Ice
GCMD >> Earth Science >> Cryosphere >> Sea Ice >> Ice Temperature
GCMD >> Earth Science >> Cryosphere >> Snow/Ice >> Snow/Ice Temperature
GCMD >> Earth Science >> Hydrosphere >> Snow/Ice >> Snow/Ice Temperature
GCMD >> Earth Science >> Oceans >> Sea Ice >> Ice Temperature
SVS >> For Educators
NASA Science >> Earth
GCMD keywords can be found on the Internet with the following citation: Olsen, L.M., G. Major, K. Shein, J. Scialdone, S. Ritz, T. Stevens, M. Morahan, A. Aleman, R. Vogel, S. Leicester, H. Weir, M. Meaux, S. Grebas, C.Solomon, M. Holland, T. Northcutt, R. A. Restrepo, R. Bilodeau, 2013. NASA/Global Change Master Directory (GCMD) Earth Science Keywords. Version 8.0.0.0.0


