Earth
ID: 3351
The earliest technique for measuring Sea Surface Temperature (SST) was dipping a thermometer into a bucket of water. The first automated technique for determining SST was accomplished by measuring the temperature of water in the intake port of large ships. A large network of coastal buoys in U.S. waters is maintained by the National Data Buoy Center (NDBC). Since about 1990, there has also been an extensive array of moored buoys maintained across the equatorial Pacific Ocean designed to help monitor and predict the El Niño phenomenon. Since the 1980s satellites have been increasingly utilized to measure SST and have provided an enormous leap in our ability to view the spatial and temporal variation in SST. The satellite measured SST provides both a synoptic view of the ocean and a high frequency of repeat views, allowing the examination of basin-wide upper ocean dynamics not possible with ships or buoys. For example, a ship traveling at 10 knots (20 km/h) would require 10 years to cover the same area a satellite covers in two minutes.

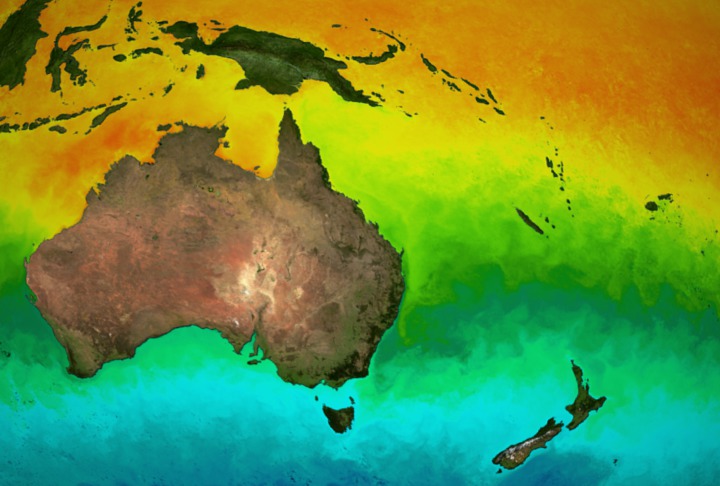
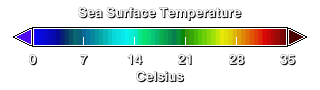
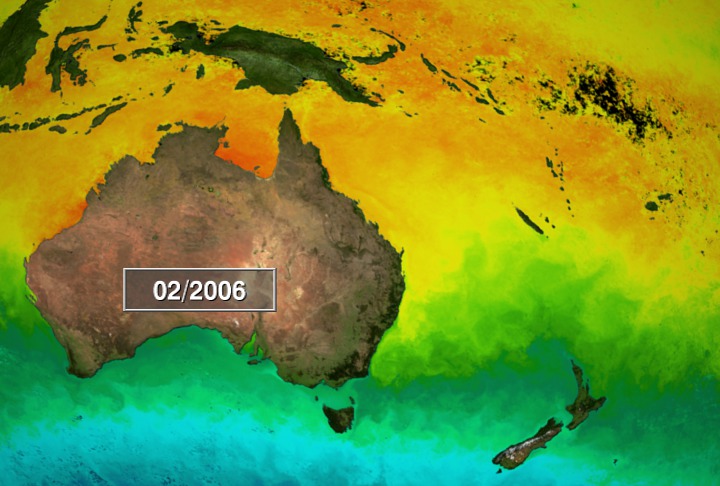
MODIS Sea Surface Temperature around the Australian Continent
This animation uses SST data taken at nighttime from the MODIS/Aqua and MODIS/Terra satellites. This data has many important applications that permit scientists to use ocean temperatures to observe ocean circulation and locate major ocean currents. Ocean current analysis can facilitate ocean transportation. Additionally, by using SST, scientists can monitor changes in ocean temperatures and relate these to weather and climate changes like coral bleaching around the Great Barrier Reef. Finally, the SST changes have many important biological implications for hospitable/inhospitable conditions for many organisms including species of plankton, seagrasses, shellfish, fish, coral, and mammals.
Visualization Credits
Please give credit for this item to:
NASA/Goddard Space Flight Center Scientific Visualization Studio
NASA/Goddard Space Flight Center Scientific Visualization Studio
Short URL to share this page:
https://svs.gsfc.nasa.gov/3351
Mission:
Terra
Data Used:
Note: While we identify the data sets used in these visualizations, we do not store any further details nor the data sets themselves on our site.
This item is part of this series:
Coral Bleaching
Keywords:
DLESE >> Physical oceanography
GCMD >> Earth Science >> Atmosphere >> Atmospheric Chemistry/Carbon and Hydrocarbon Compounds >> Chlorinated Hydrocarbons
GCMD >> Earth Science >> Human Dimensions >> Natural Hazards >> Meteorological Hazards
GCMD >> Earth Science >> Oceans >> Ocean Temperature >> Sea Surface Temperature
GCMD >> Earth Science >> Spectral/Engineering >> Visible Wavelengths >> Visible Imagery
NASA Science >> Earth
GCMD keywords can be found on the Internet with the following citation: Olsen, L.M., G. Major, K. Shein, J. Scialdone, S. Ritz, T. Stevens, M. Morahan, A. Aleman, R. Vogel, S. Leicester, H. Weir, M. Meaux, S. Grebas, C.Solomon, M. Holland, T. Northcutt, R. A. Restrepo, R. Bilodeau, 2013. NASA/Global Change Master Directory (GCMD) Earth Science Keywords. Version 8.0.0.0.0
https://svs.gsfc.nasa.gov/3351
Mission:
Terra
Data Used:
Terra/MODIS
Aqua/MODIS/Sea Surface Temperature
July 2002 - Feb 2006: 32 day compositesThis item is part of this series:
Coral Bleaching
Keywords:
DLESE >> Physical oceanography
GCMD >> Earth Science >> Atmosphere >> Atmospheric Chemistry/Carbon and Hydrocarbon Compounds >> Chlorinated Hydrocarbons
GCMD >> Earth Science >> Human Dimensions >> Natural Hazards >> Meteorological Hazards
GCMD >> Earth Science >> Oceans >> Ocean Temperature >> Sea Surface Temperature
GCMD >> Earth Science >> Spectral/Engineering >> Visible Wavelengths >> Visible Imagery
NASA Science >> Earth
GCMD keywords can be found on the Internet with the following citation: Olsen, L.M., G. Major, K. Shein, J. Scialdone, S. Ritz, T. Stevens, M. Morahan, A. Aleman, R. Vogel, S. Leicester, H. Weir, M. Meaux, S. Grebas, C.Solomon, M. Holland, T. Northcutt, R. A. Restrepo, R. Bilodeau, 2013. NASA/Global Change Master Directory (GCMD) Earth Science Keywords. Version 8.0.0.0.0


