Earth
ID: 3283
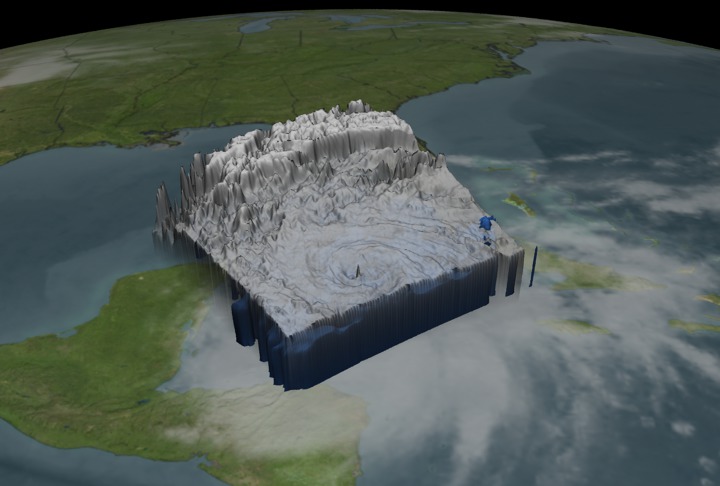
NASA's TRMM spacecraft observed this view of Hurricane Wilma on October 19, 2005 at 1740Z. At this time the storm was classified as the most dangerous category five. Wilma had record low minimum pressure readings of 893 mb and sustained winds of 140 knots (161 mph). The cloud cover is taken by TRMM's Visible and Infrared Scanner(VIRS) and the GOES spacecraft. The rain structure is taken by TRMM's Tropical Microwave Imager (TMI) and TRMM's Precitation Radar(PR) instruments. TRMM looks underneath of the storm's clouds to reveal the underlying rain structure. Blue represents areas with at least 0.25 inches of rain per hour. Green shows at least 0.5 inches of rain per hour. Yellow is at least 1.0 inches of rain and red is at least 2.0 inches of rain per hour.
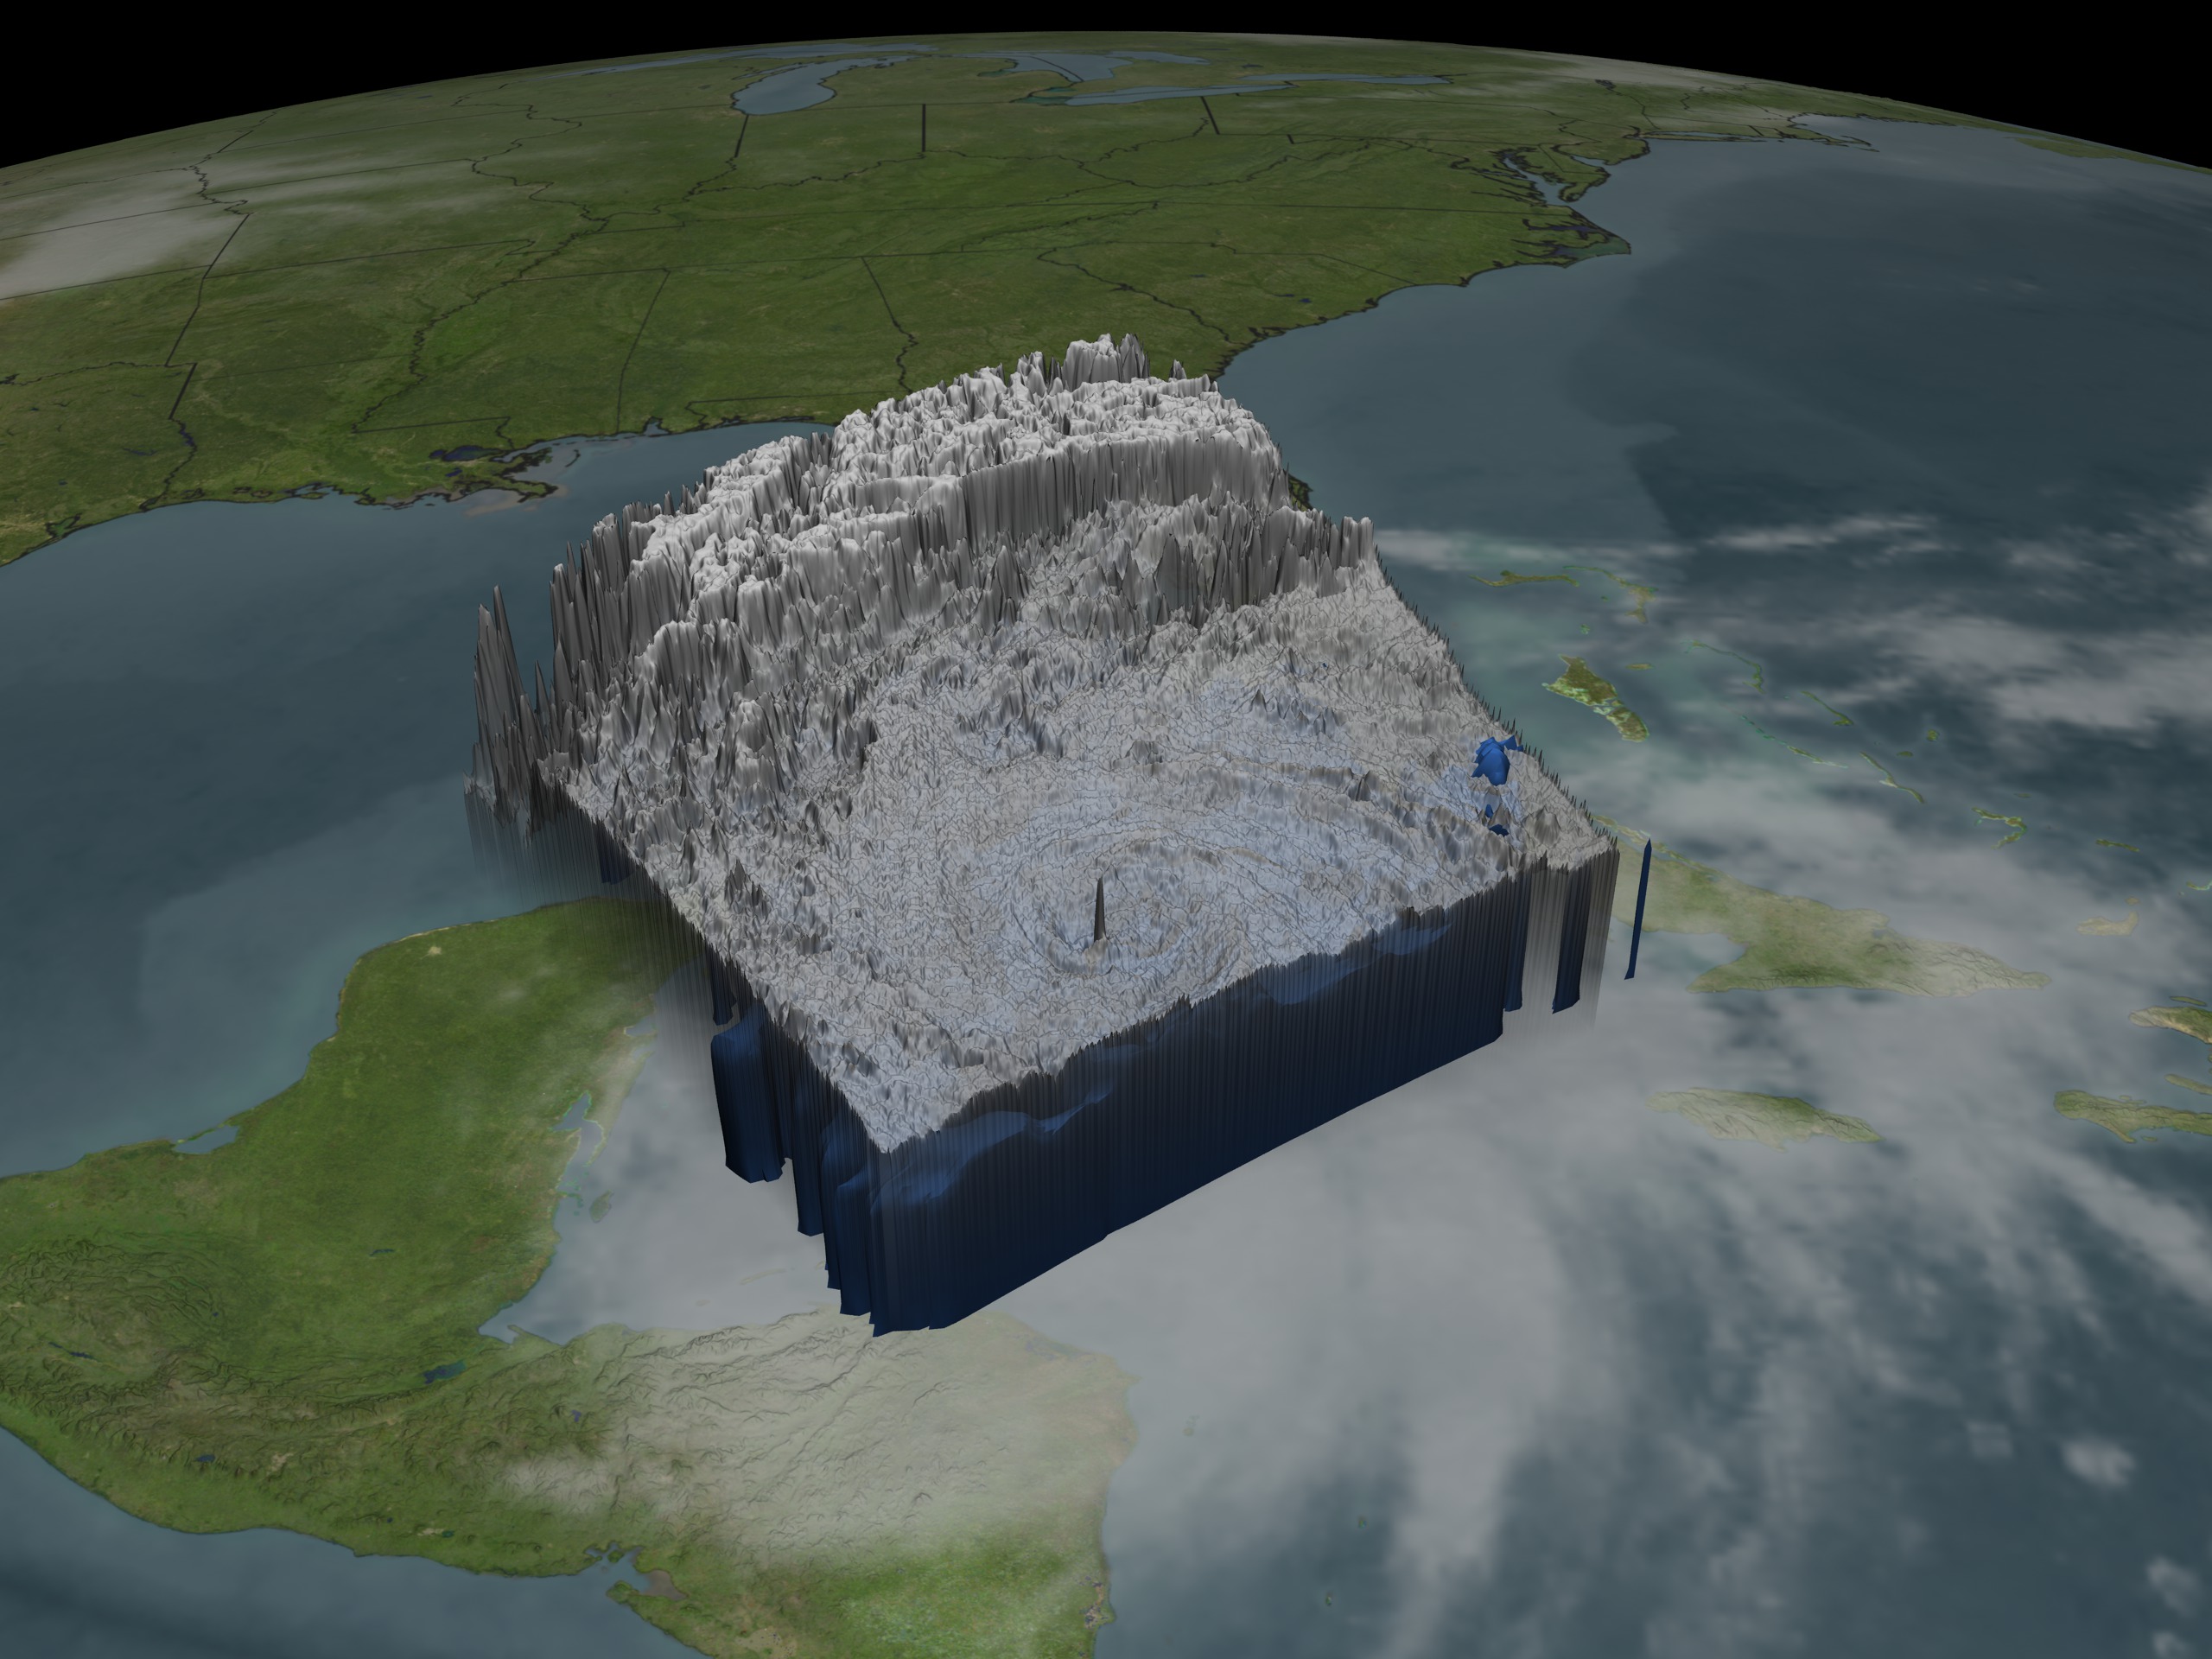
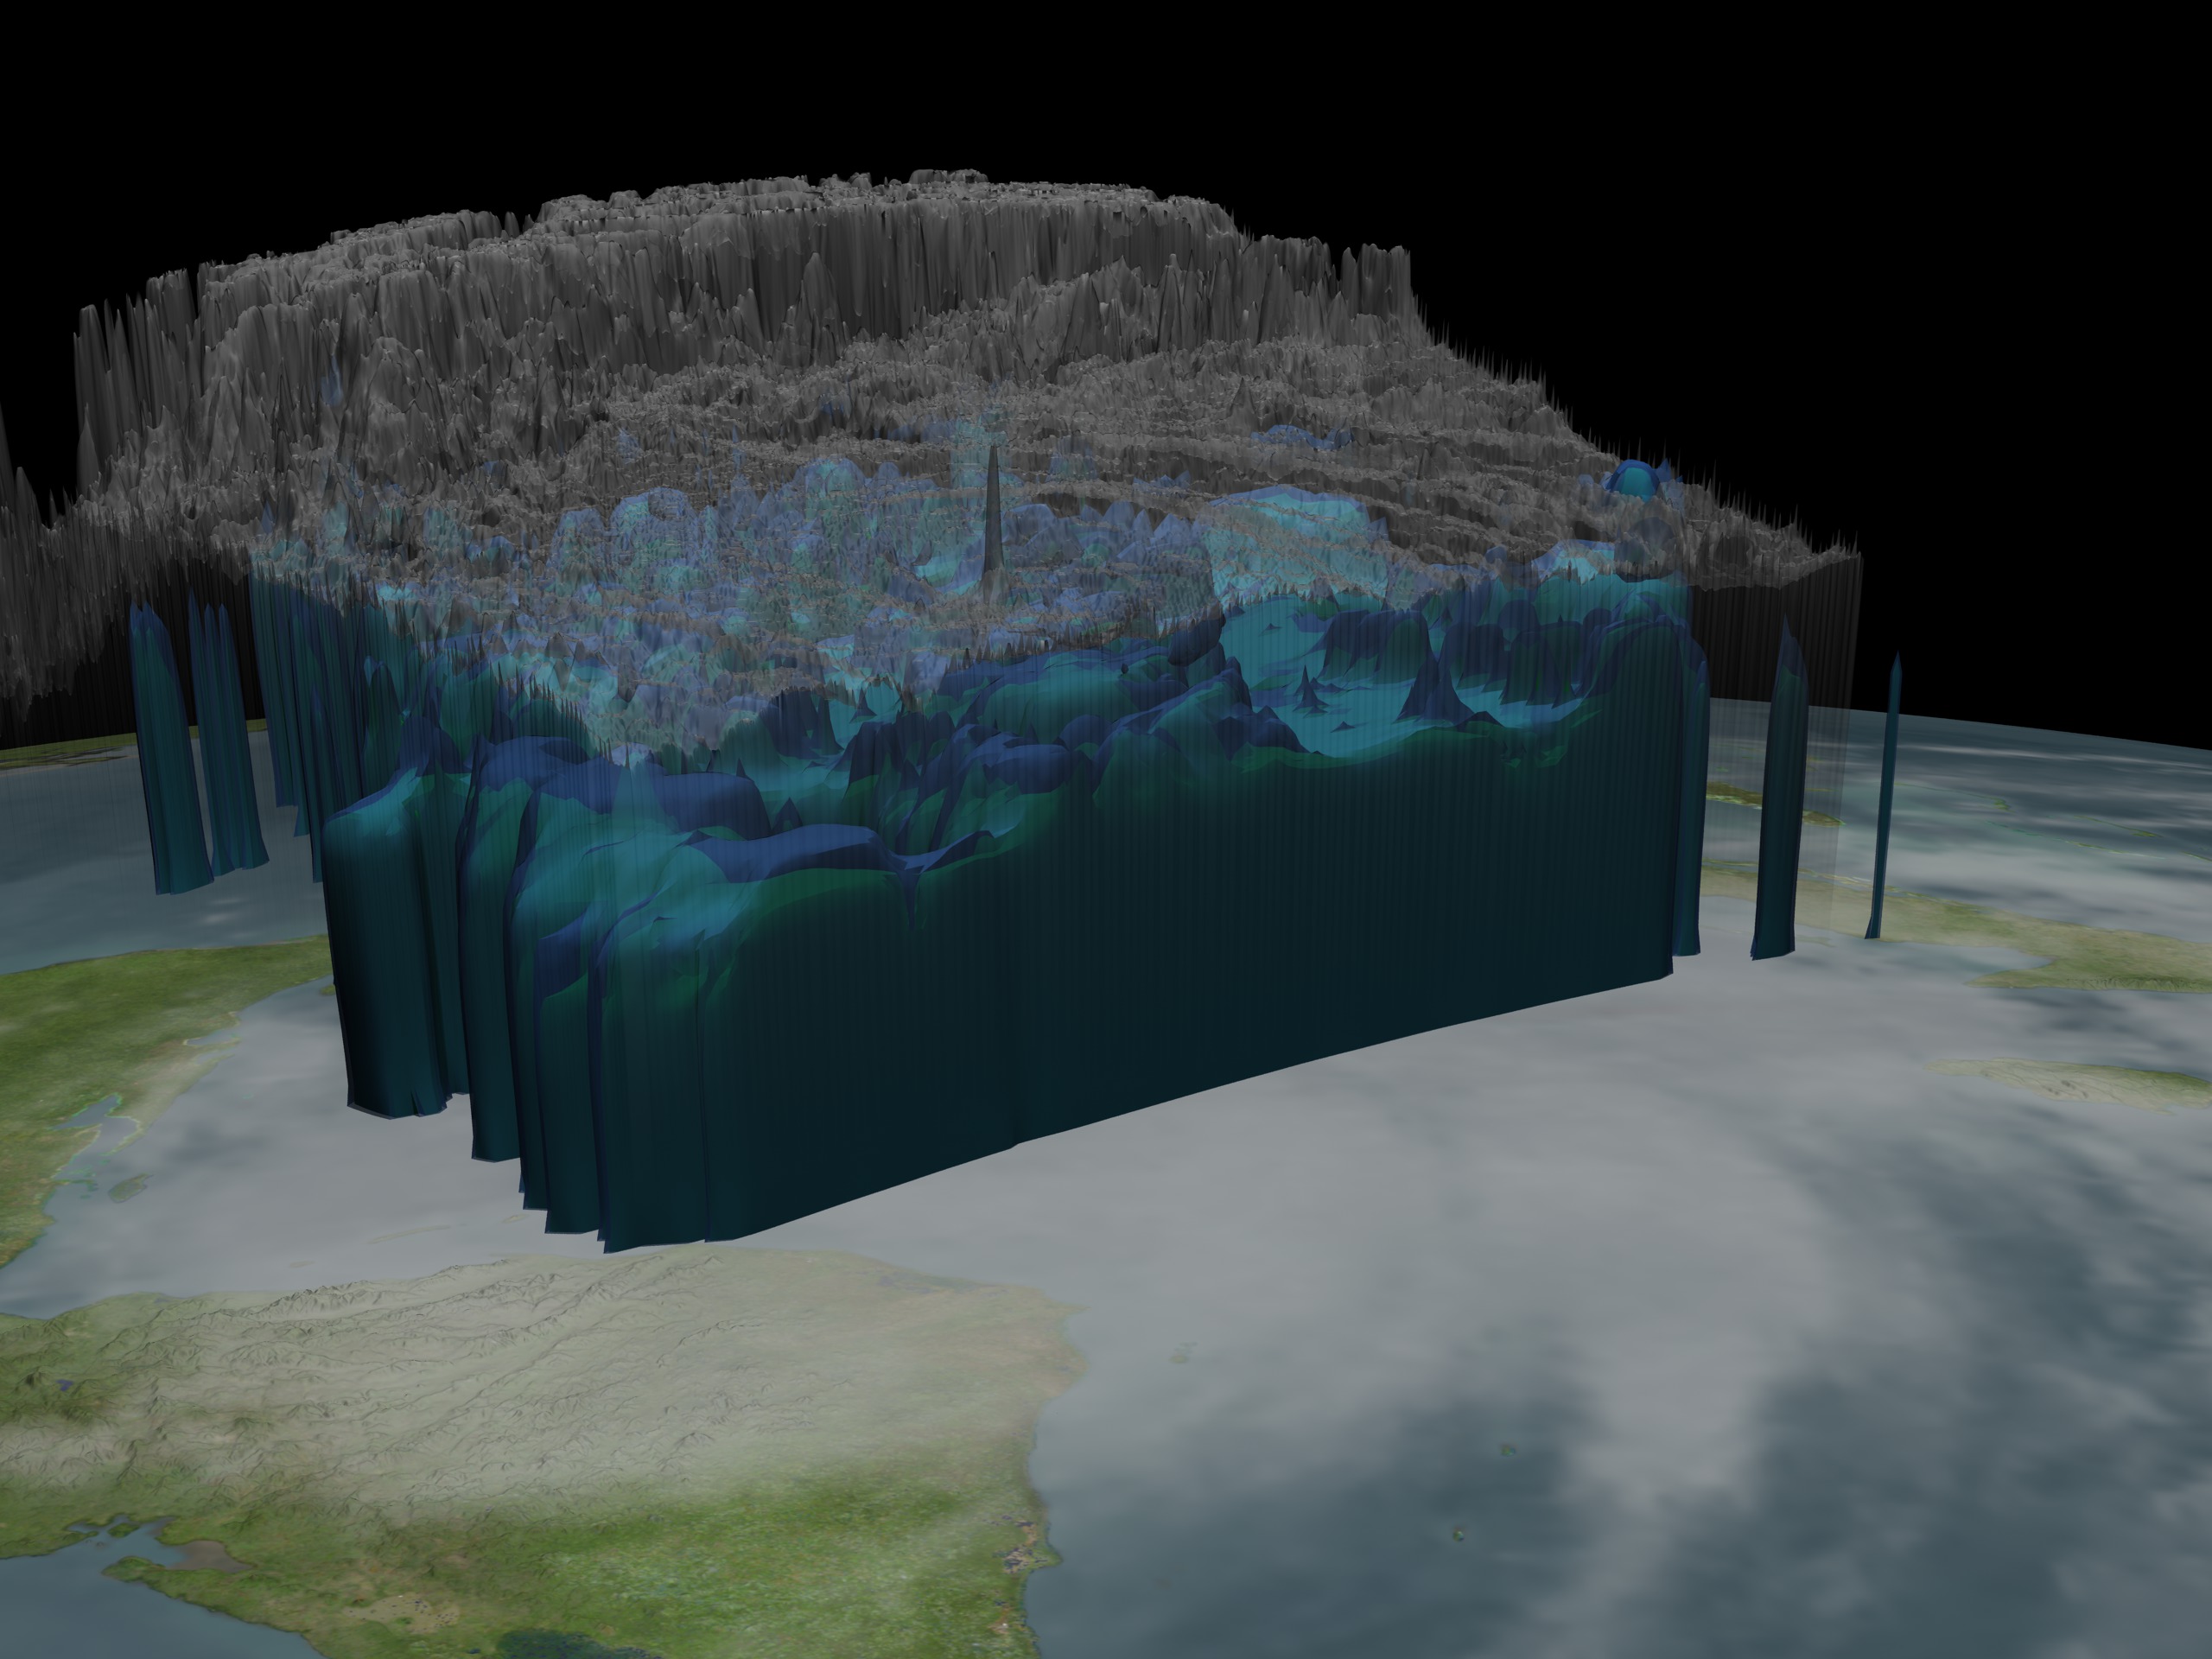
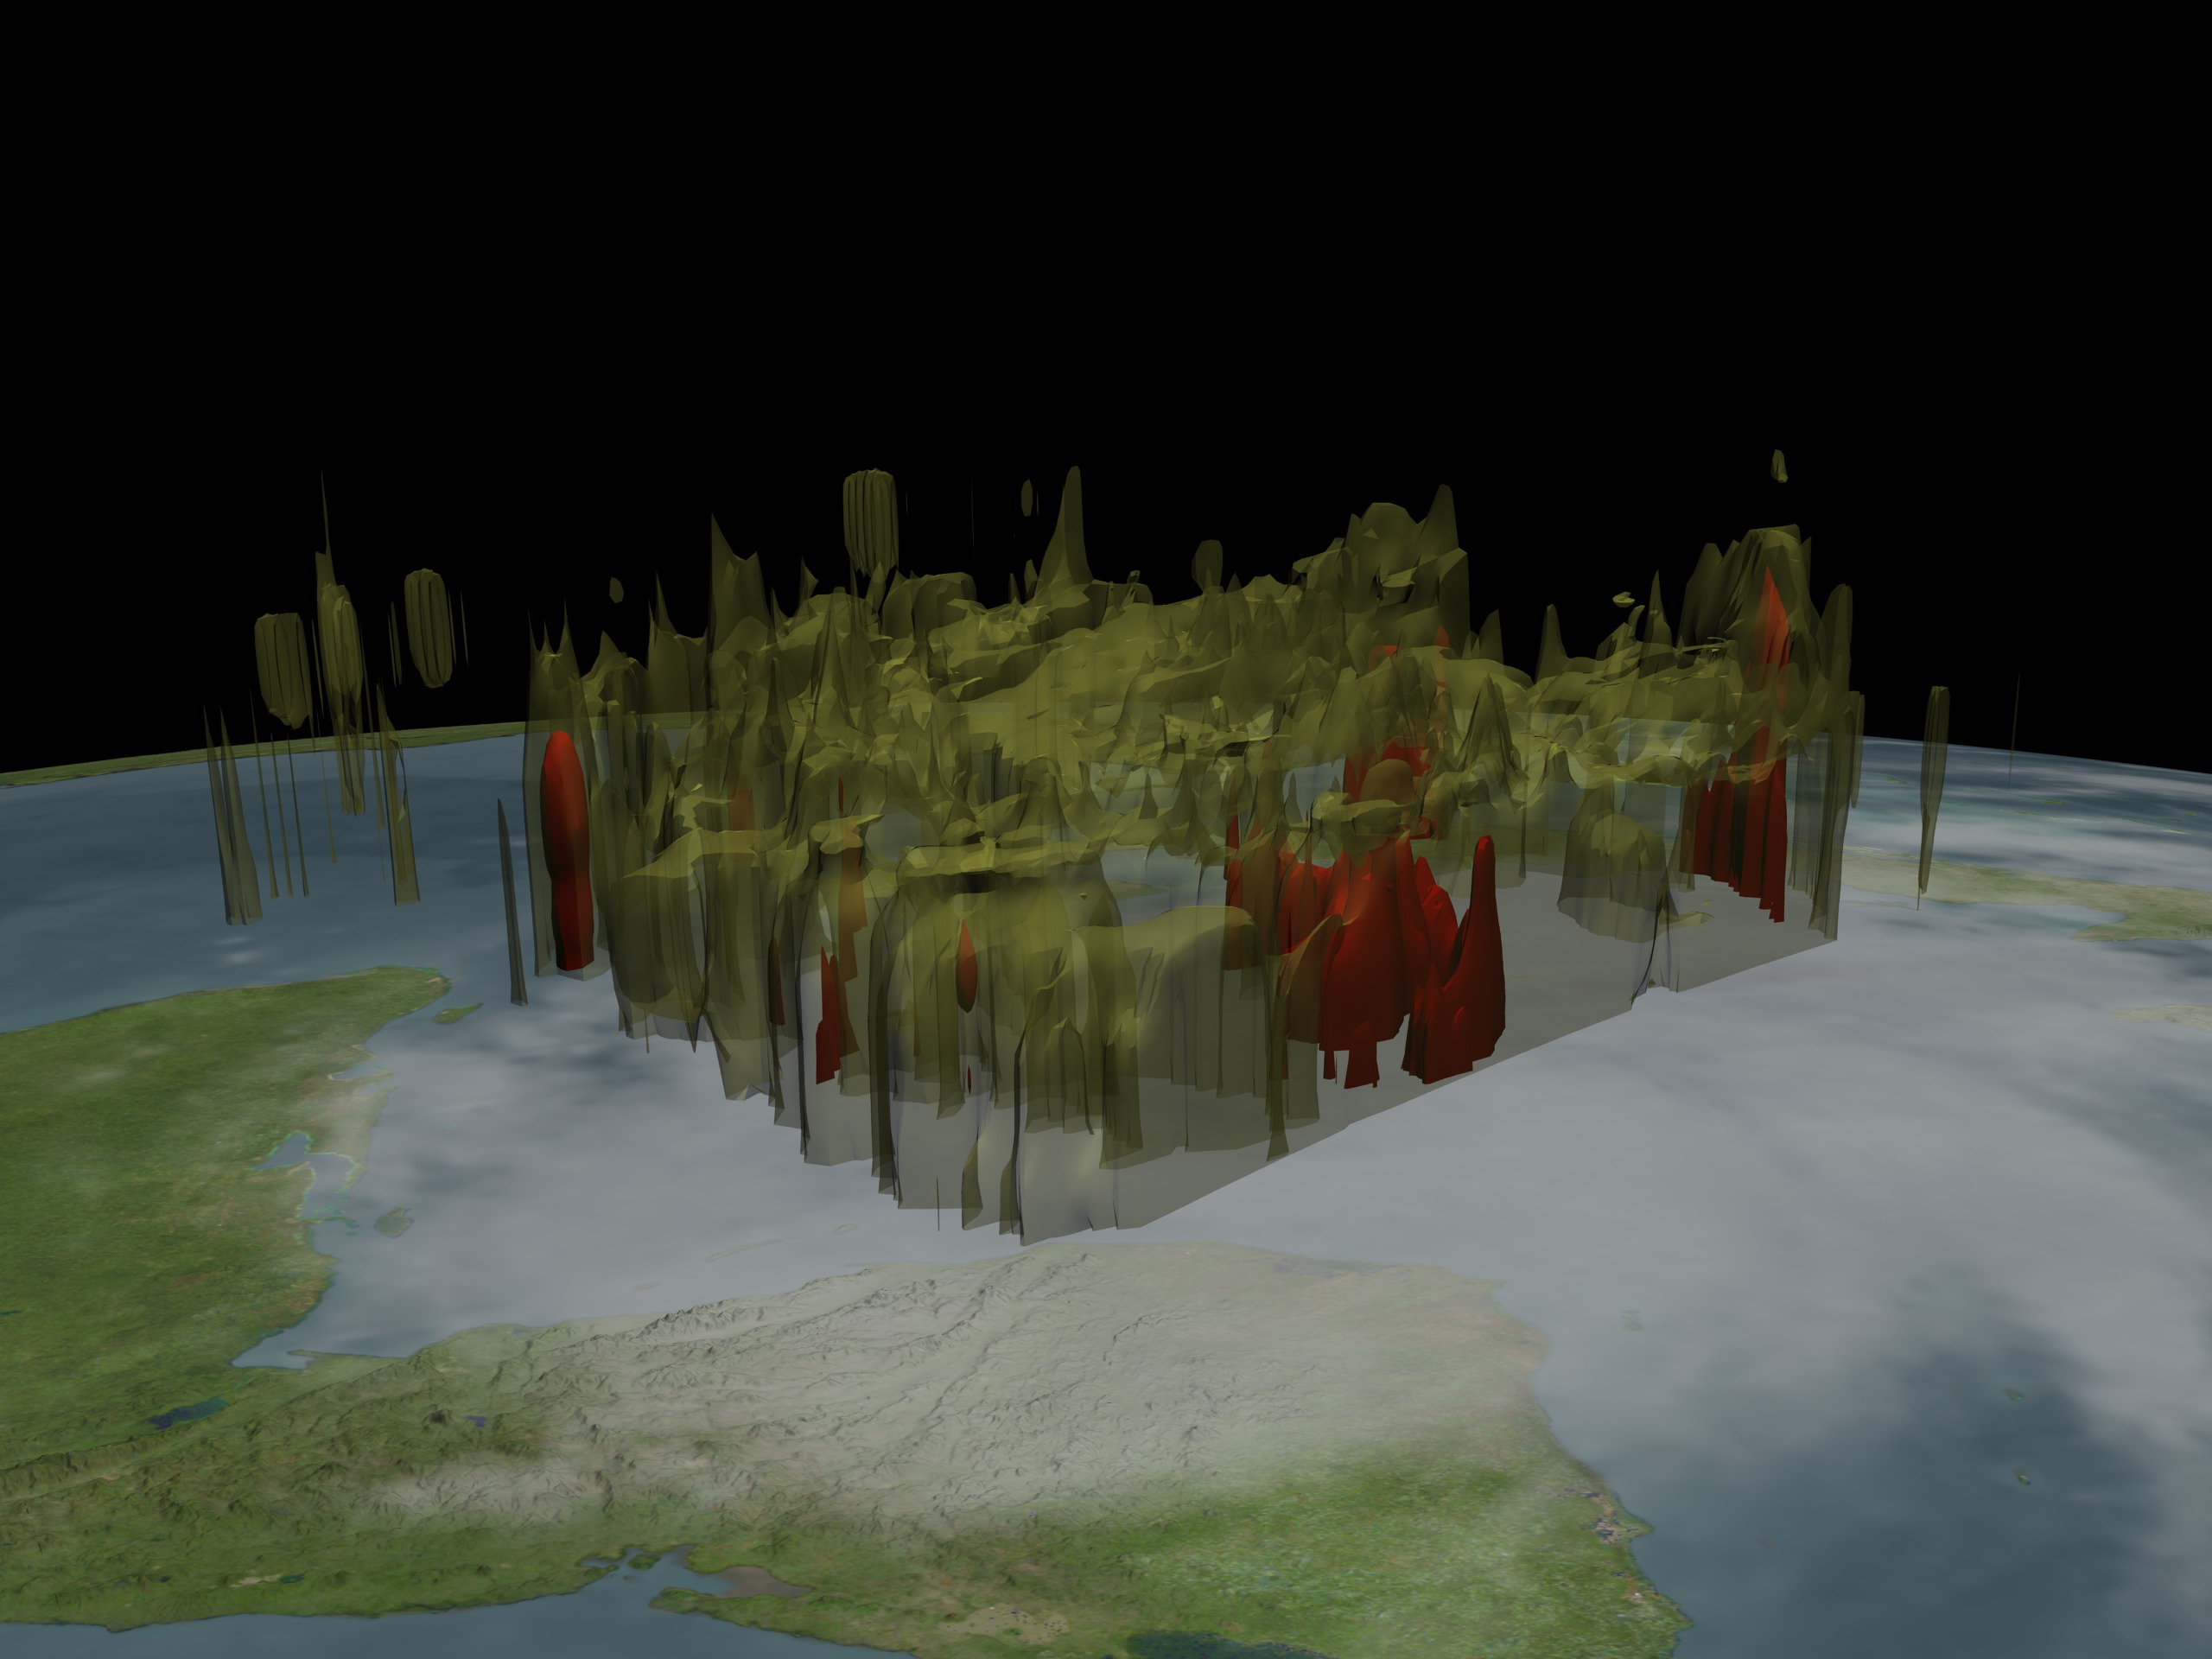
TRMM Observes Hurricane Wilma on October 19, 2005
Visualization Credits
Lori Perkins (NASA/GSFC): Lead Animator
Jeff Halverson (JCET UMBC): Scientist
J. Marshall Shepherd (NASA/GSFC): Scientist
Jeff Halverson (JCET UMBC): Scientist
J. Marshall Shepherd (NASA/GSFC): Scientist
Please give credit for this item to:
NASA/Goddard Space Flight Center Scientific Visualization Studio
NASA/Goddard Space Flight Center Scientific Visualization Studio
Short URL to share this page:
https://svs.gsfc.nasa.gov/3283
Mission:
Tropical Rainfall Measuring Mission - TRMM
Data Used:
Note: While we identify the data sets used in these visualizations, we do not store any further details nor the data sets themselves on our site.
This item is part of these series:
Hurricanes
TRMM 3D Hurricanes
Hurricane Wilma
Keywords:
DLESE >> Atmospheric science
DLESE >> Natural hazards
SVS >> GOES
NASA Science >> Earth
https://svs.gsfc.nasa.gov/3283
Mission:
Tropical Rainfall Measuring Mission - TRMM
Data Used:
TRMM/VIRS
2005/10/19TRMM/TMI
2005/10/19TRMM/PR
2005/10/19GOES
2005/10/19This item is part of these series:
Hurricanes
TRMM 3D Hurricanes
Hurricane Wilma
Keywords:
DLESE >> Atmospheric science
DLESE >> Natural hazards
SVS >> GOES
NASA Science >> Earth


