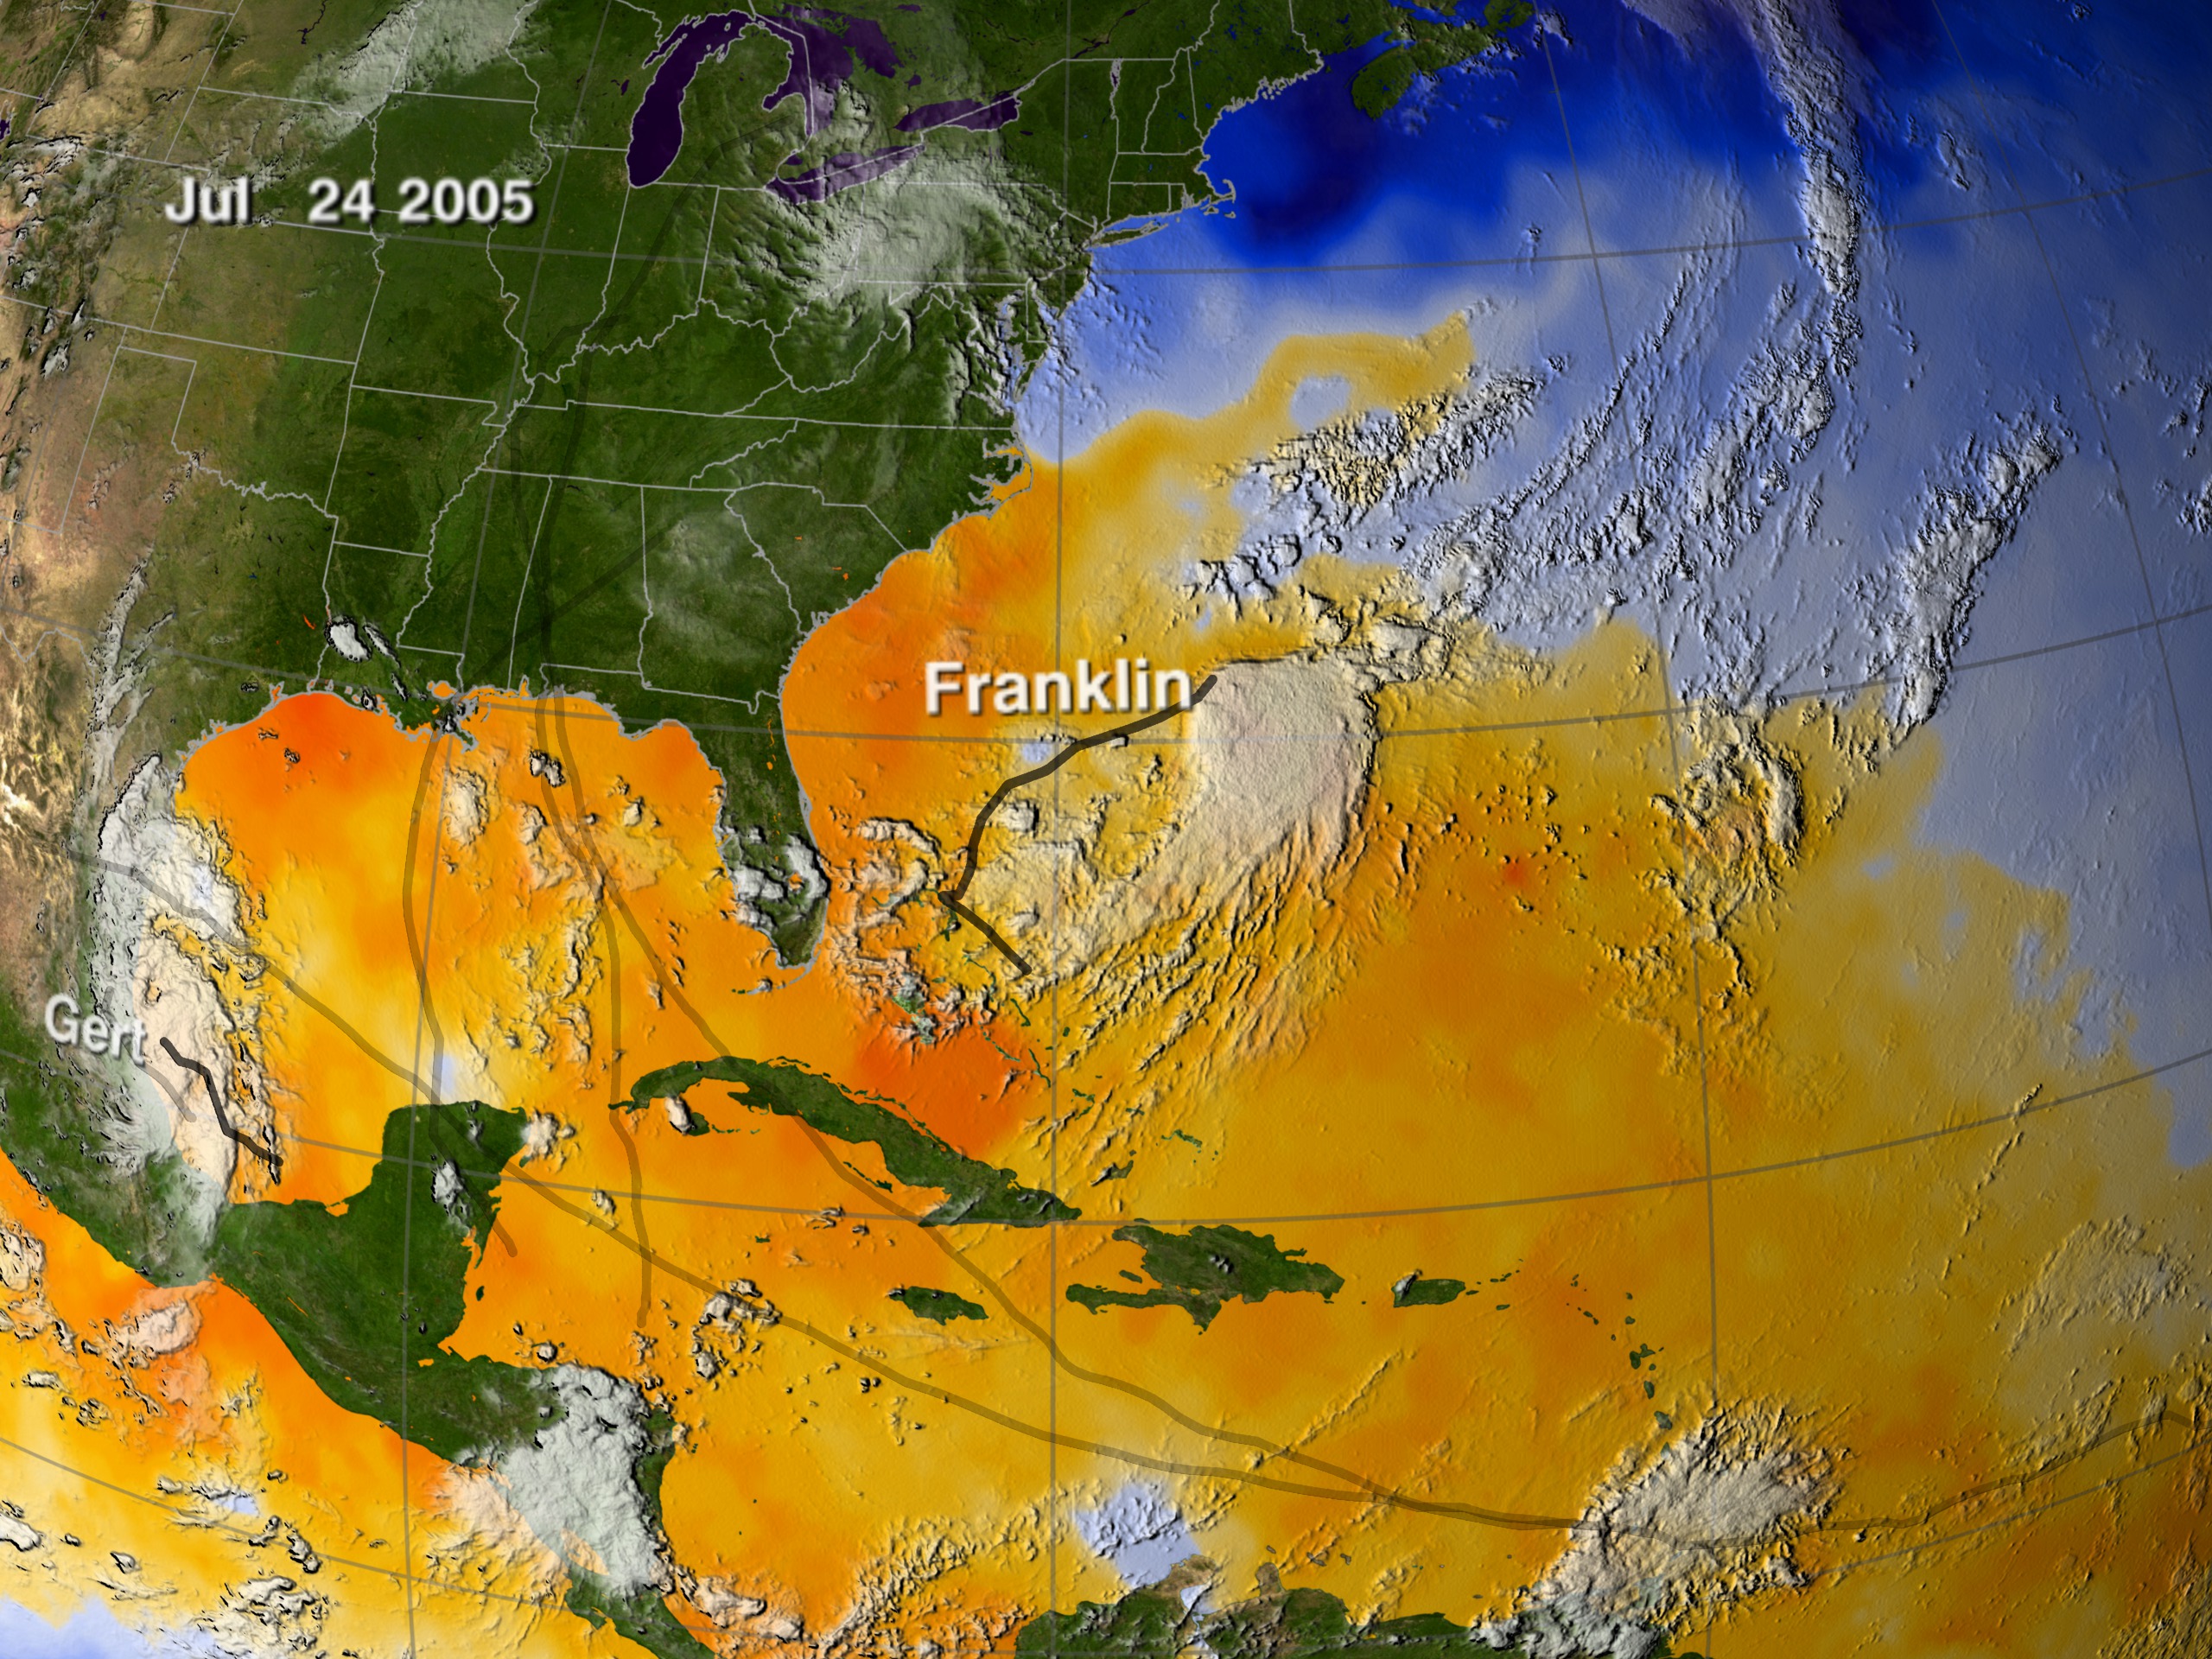
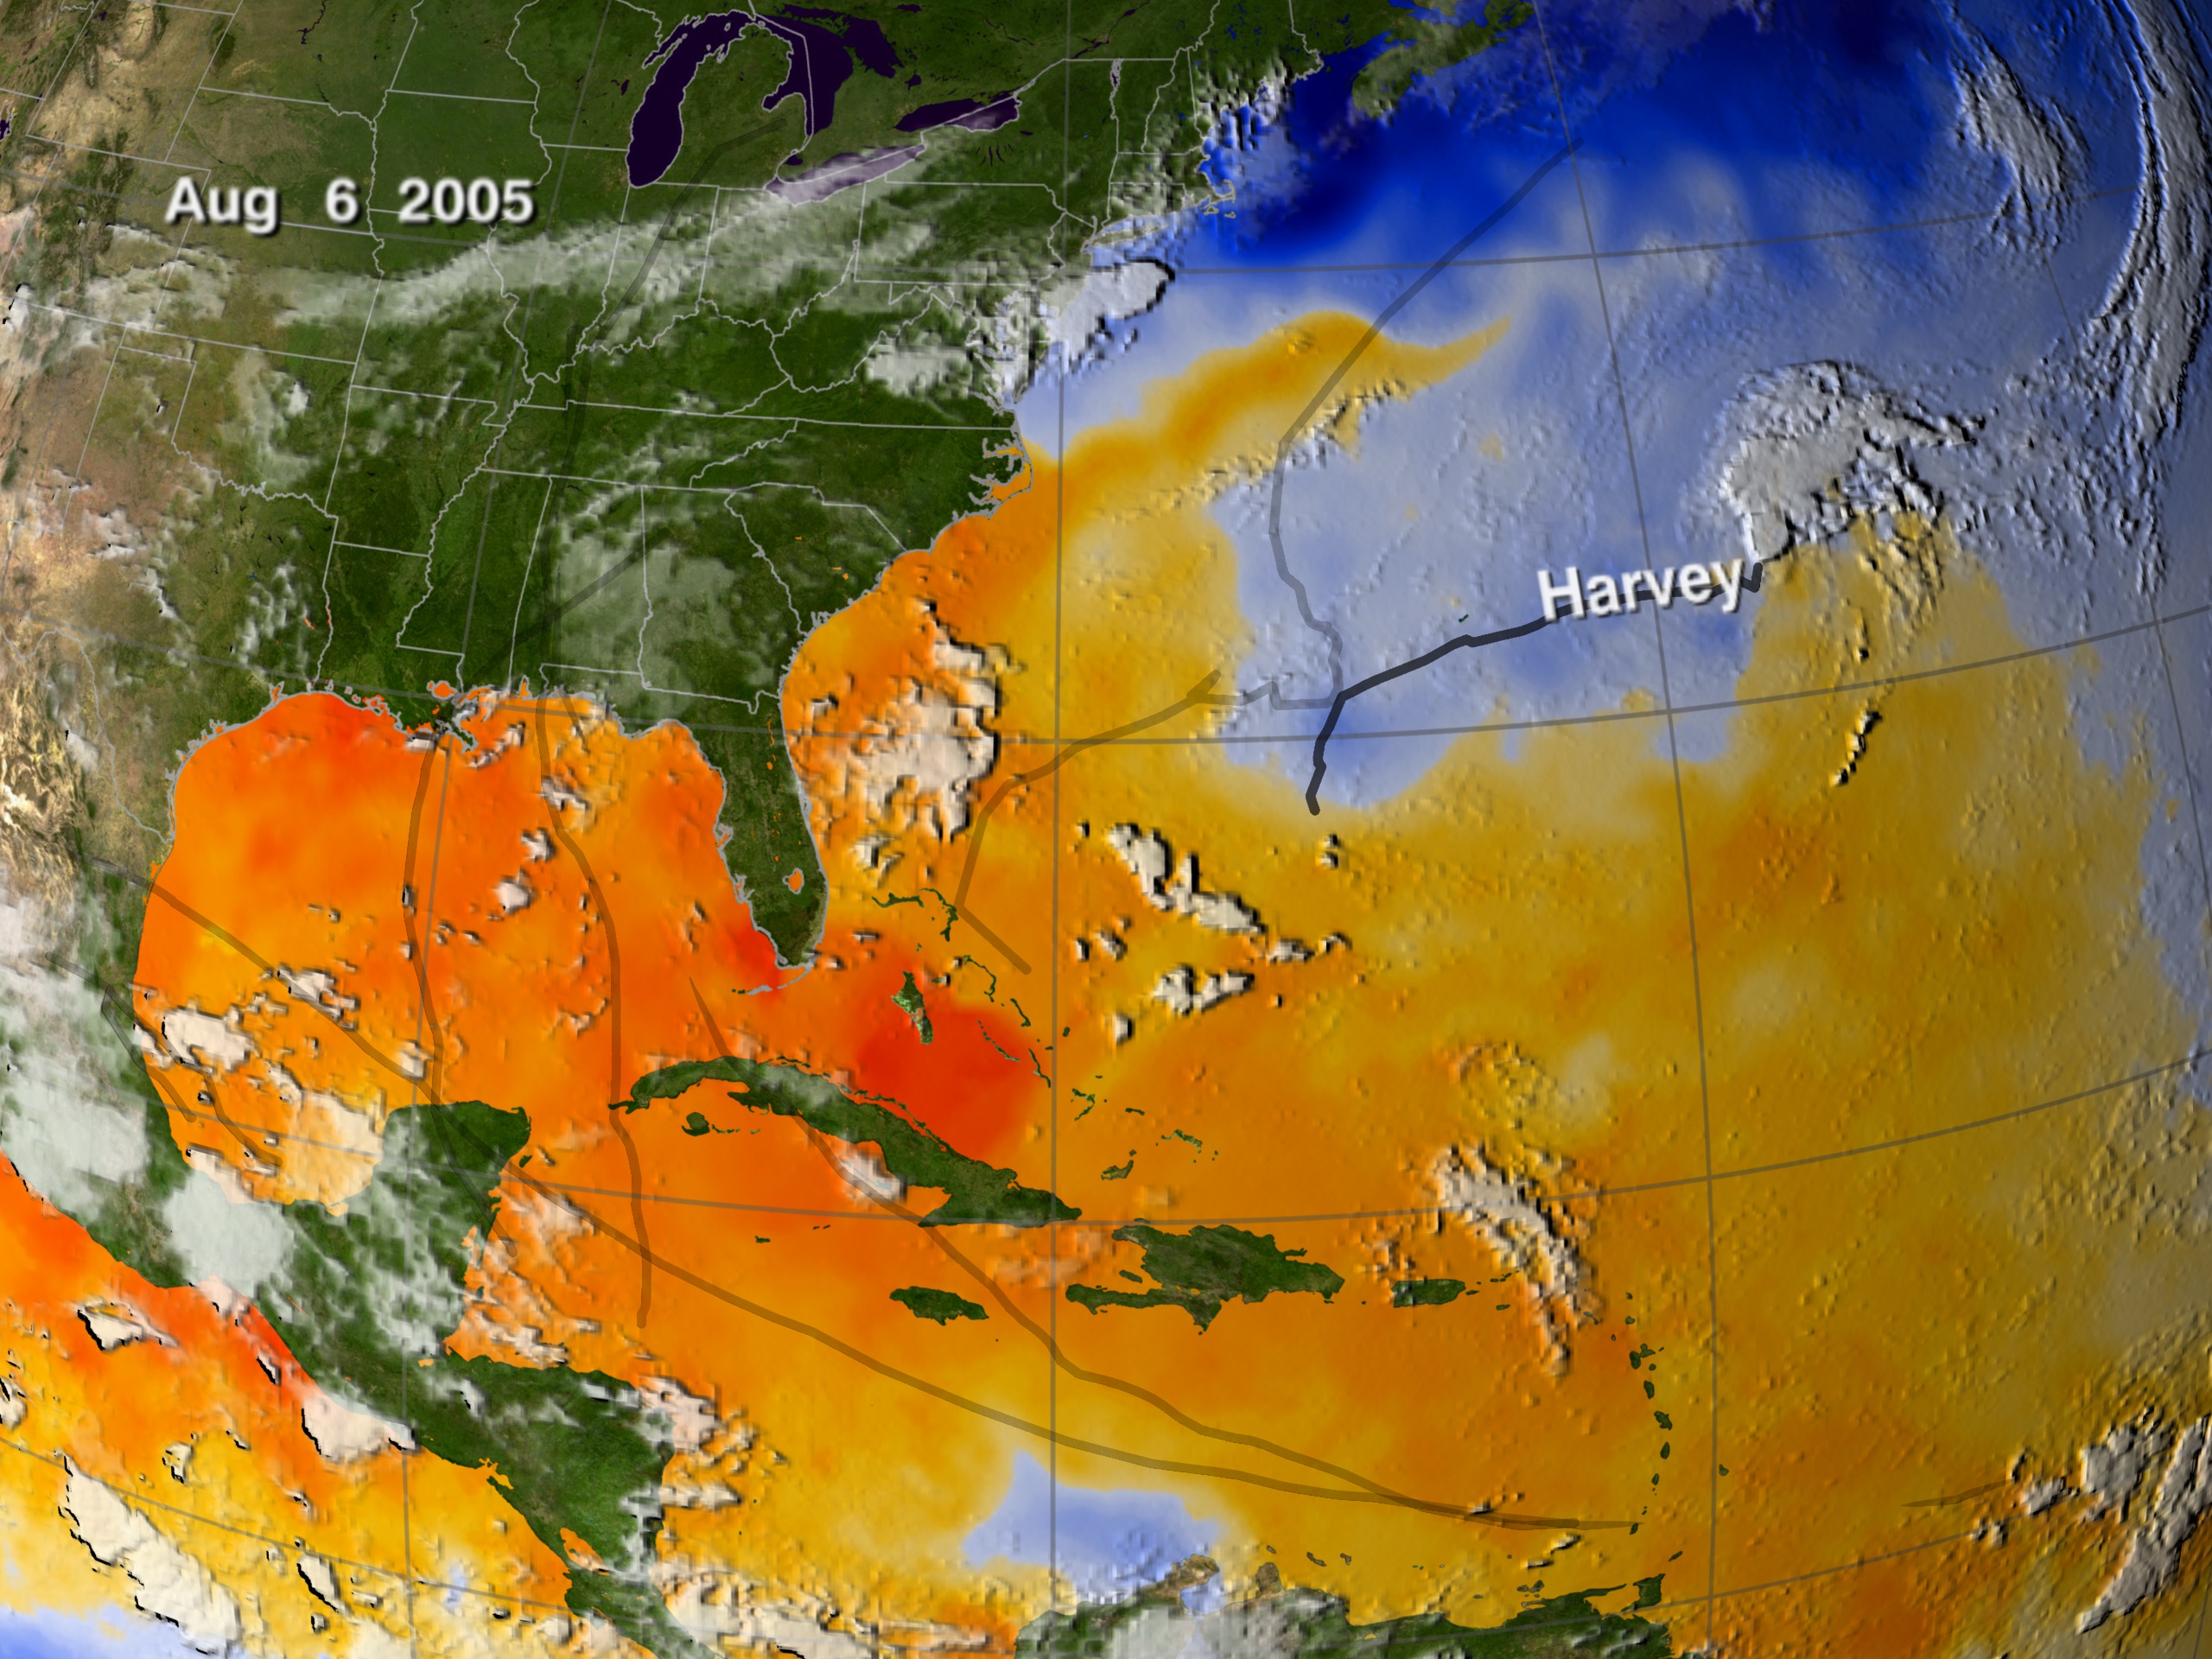
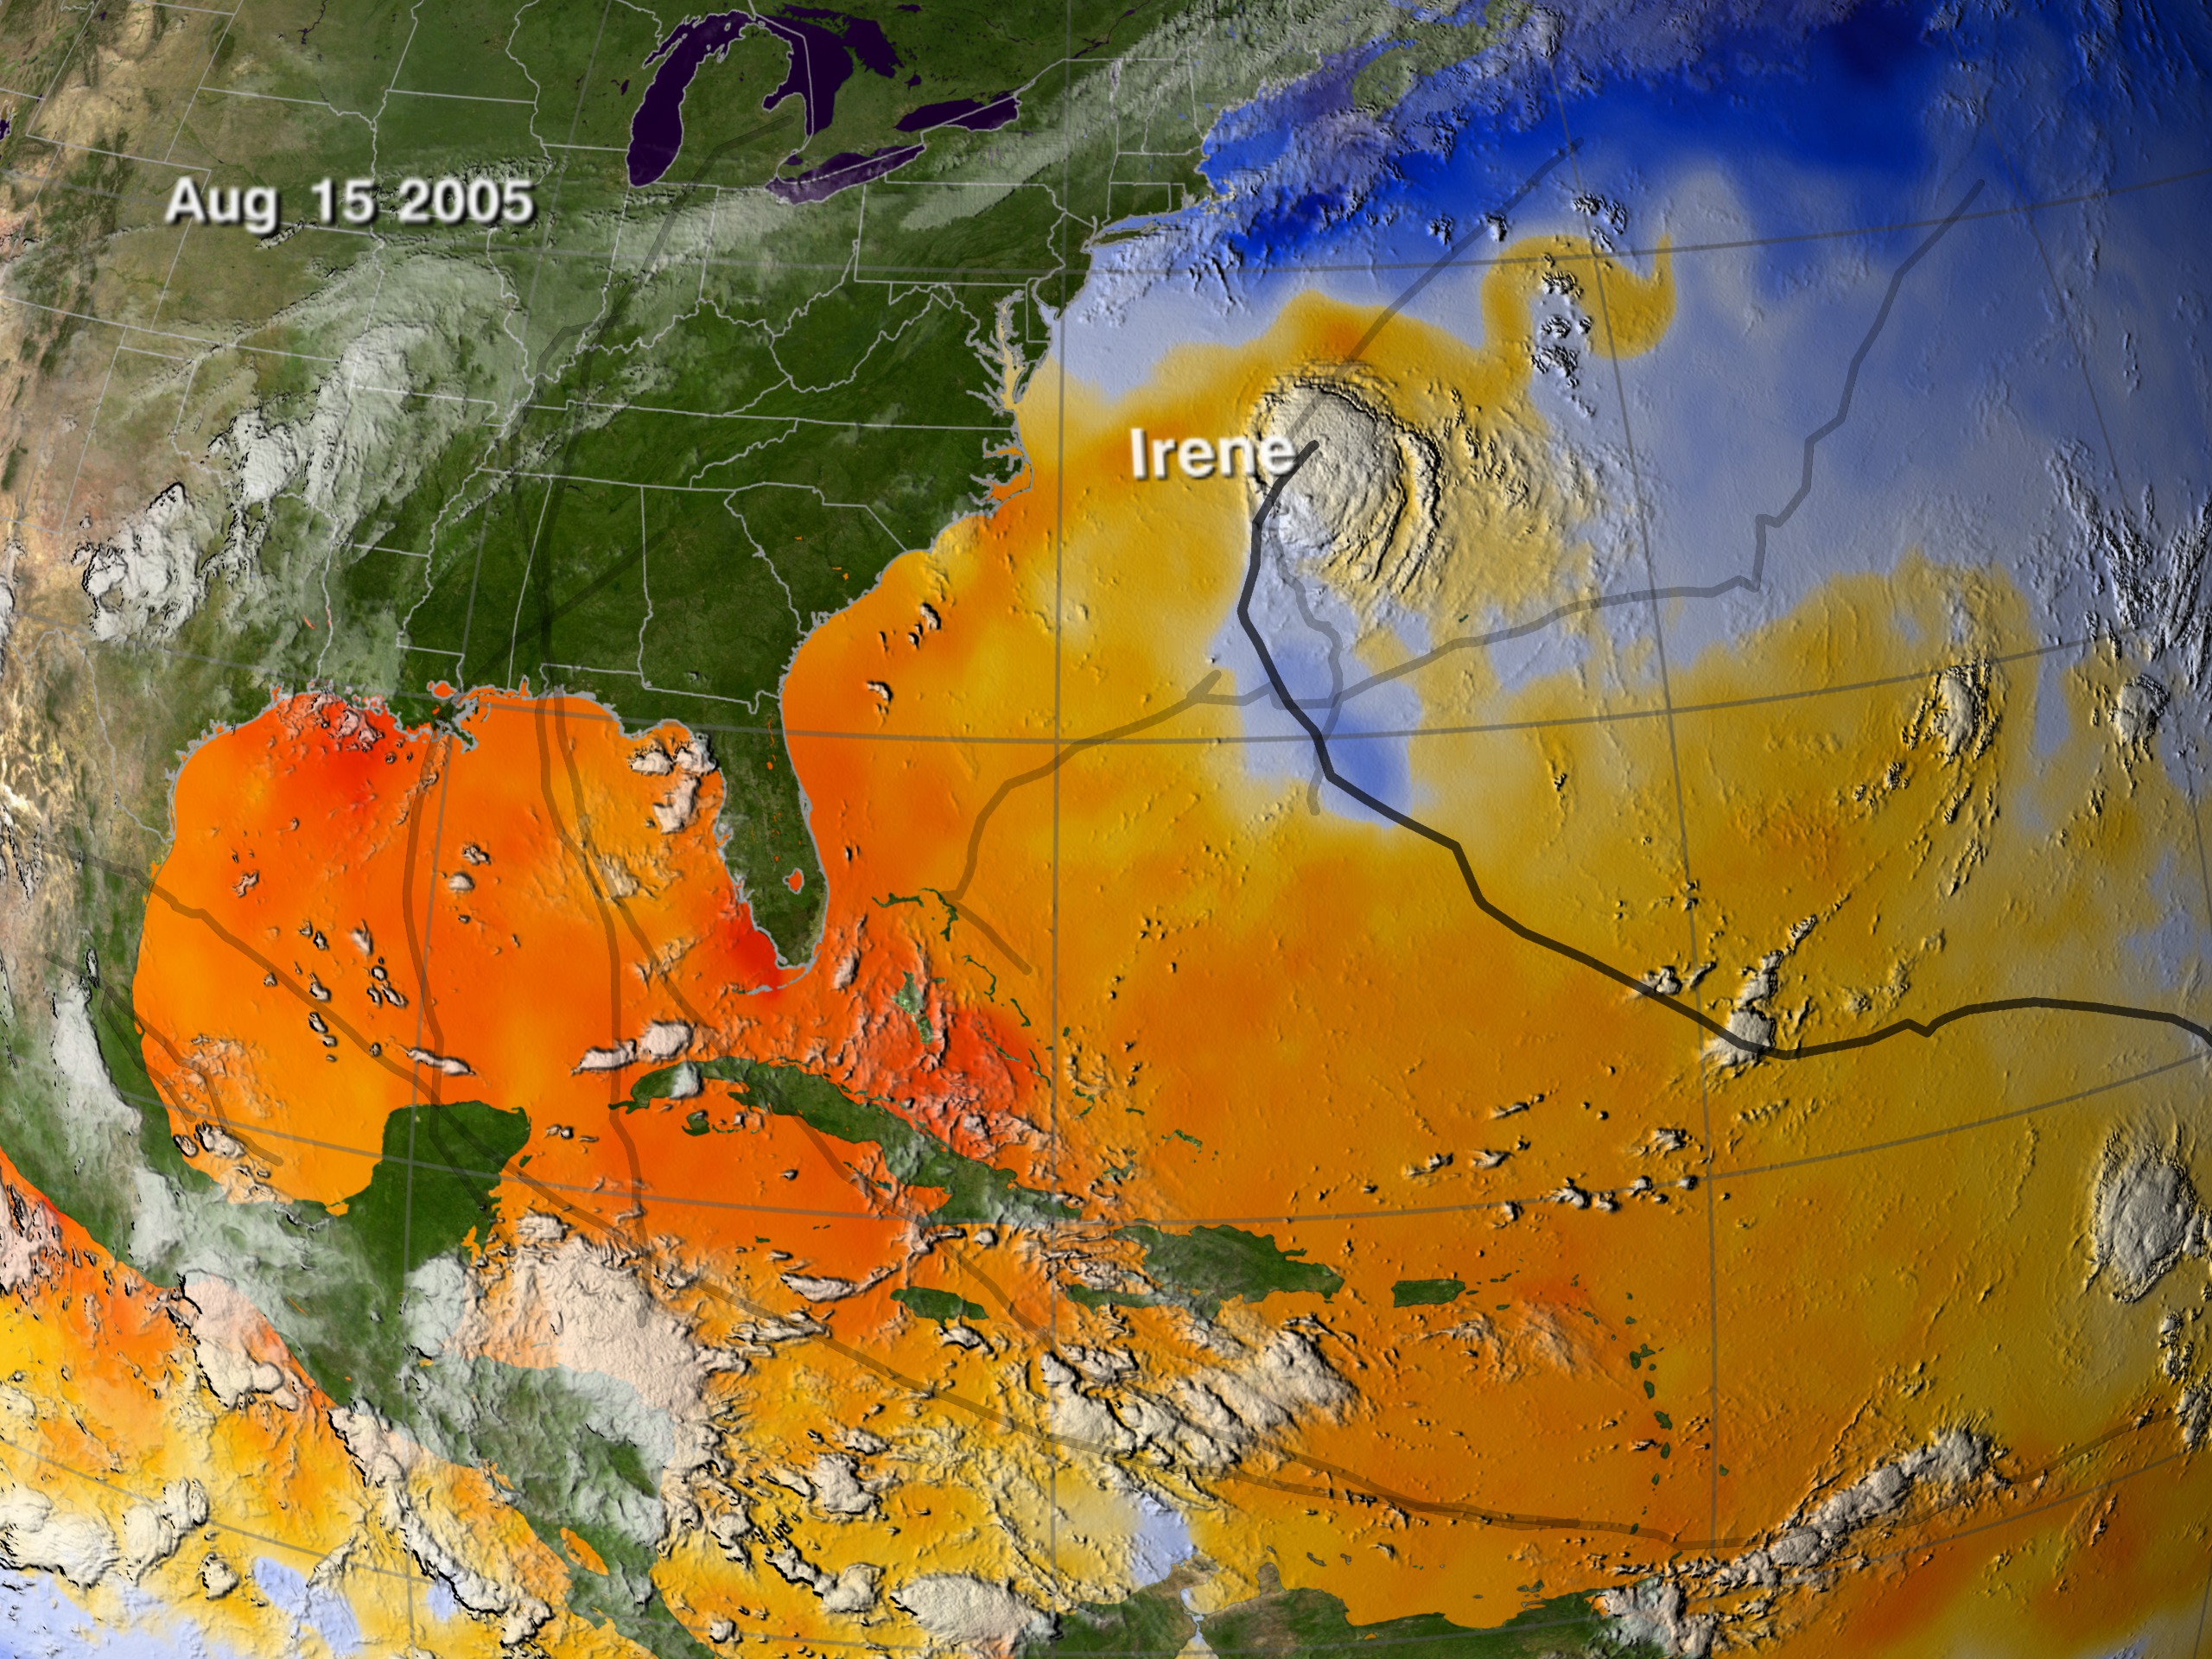
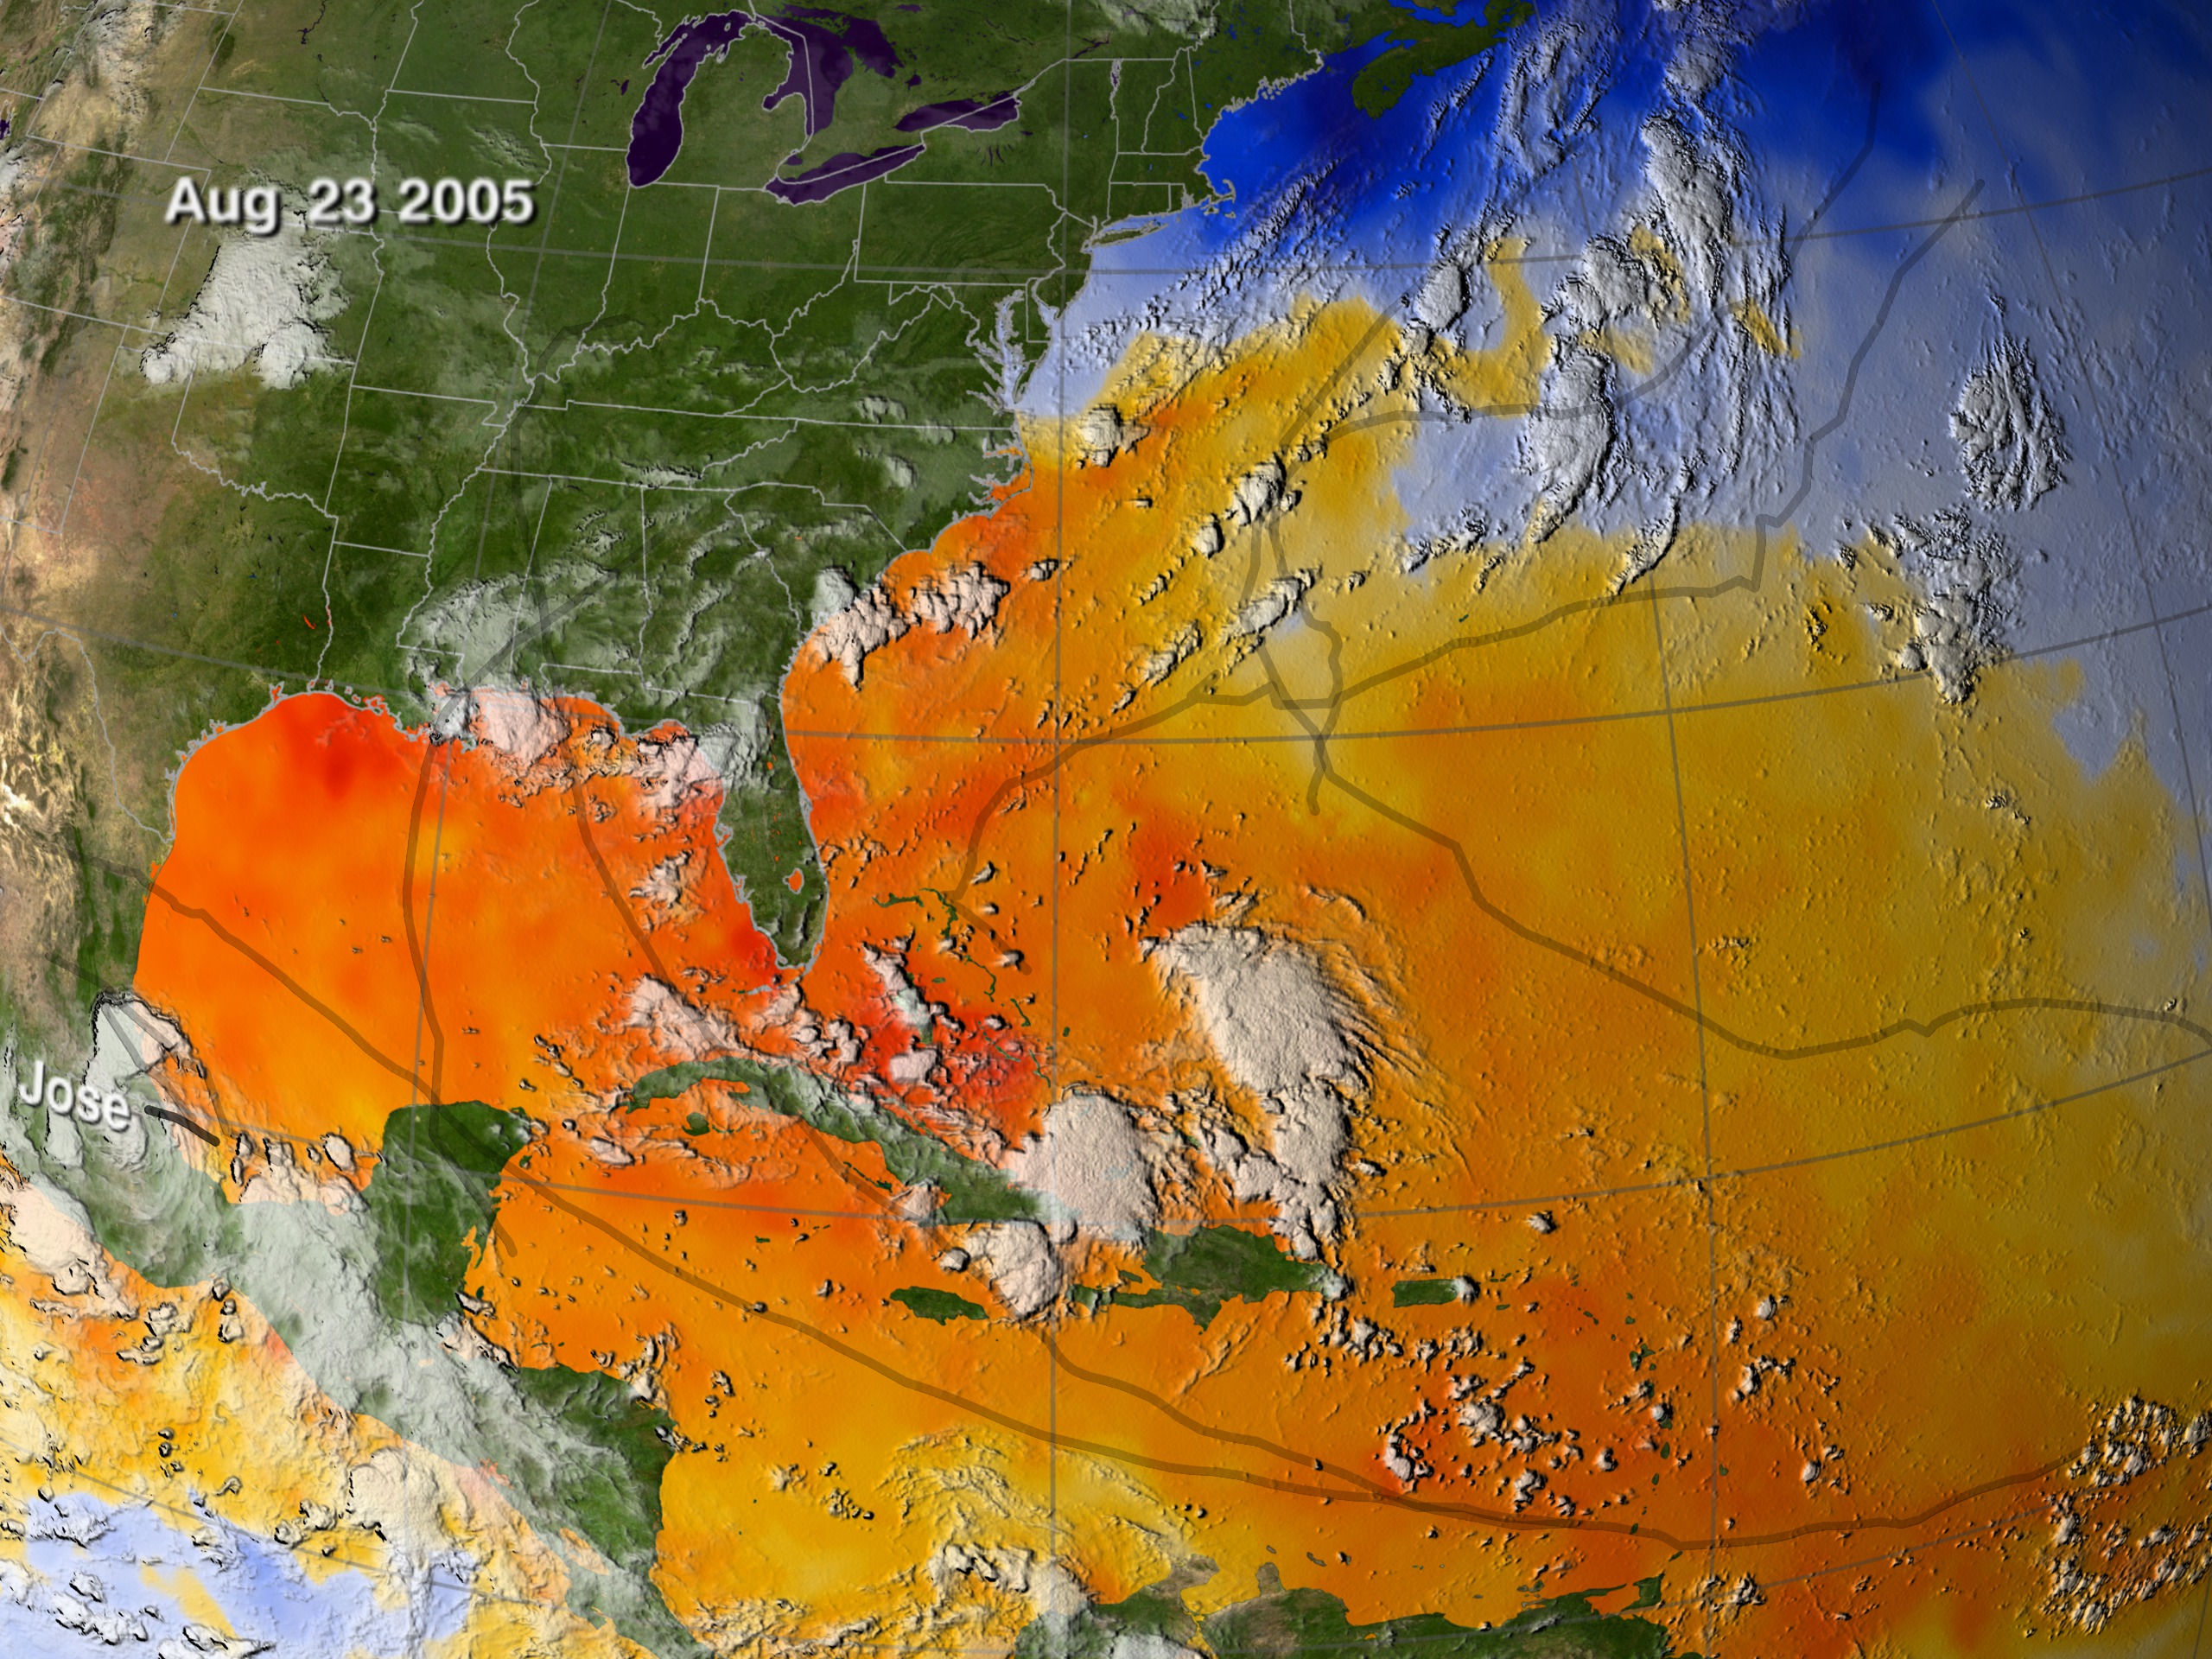
Named Storms from the 2005 Atlantic Hurricane Season (Wide Shot)
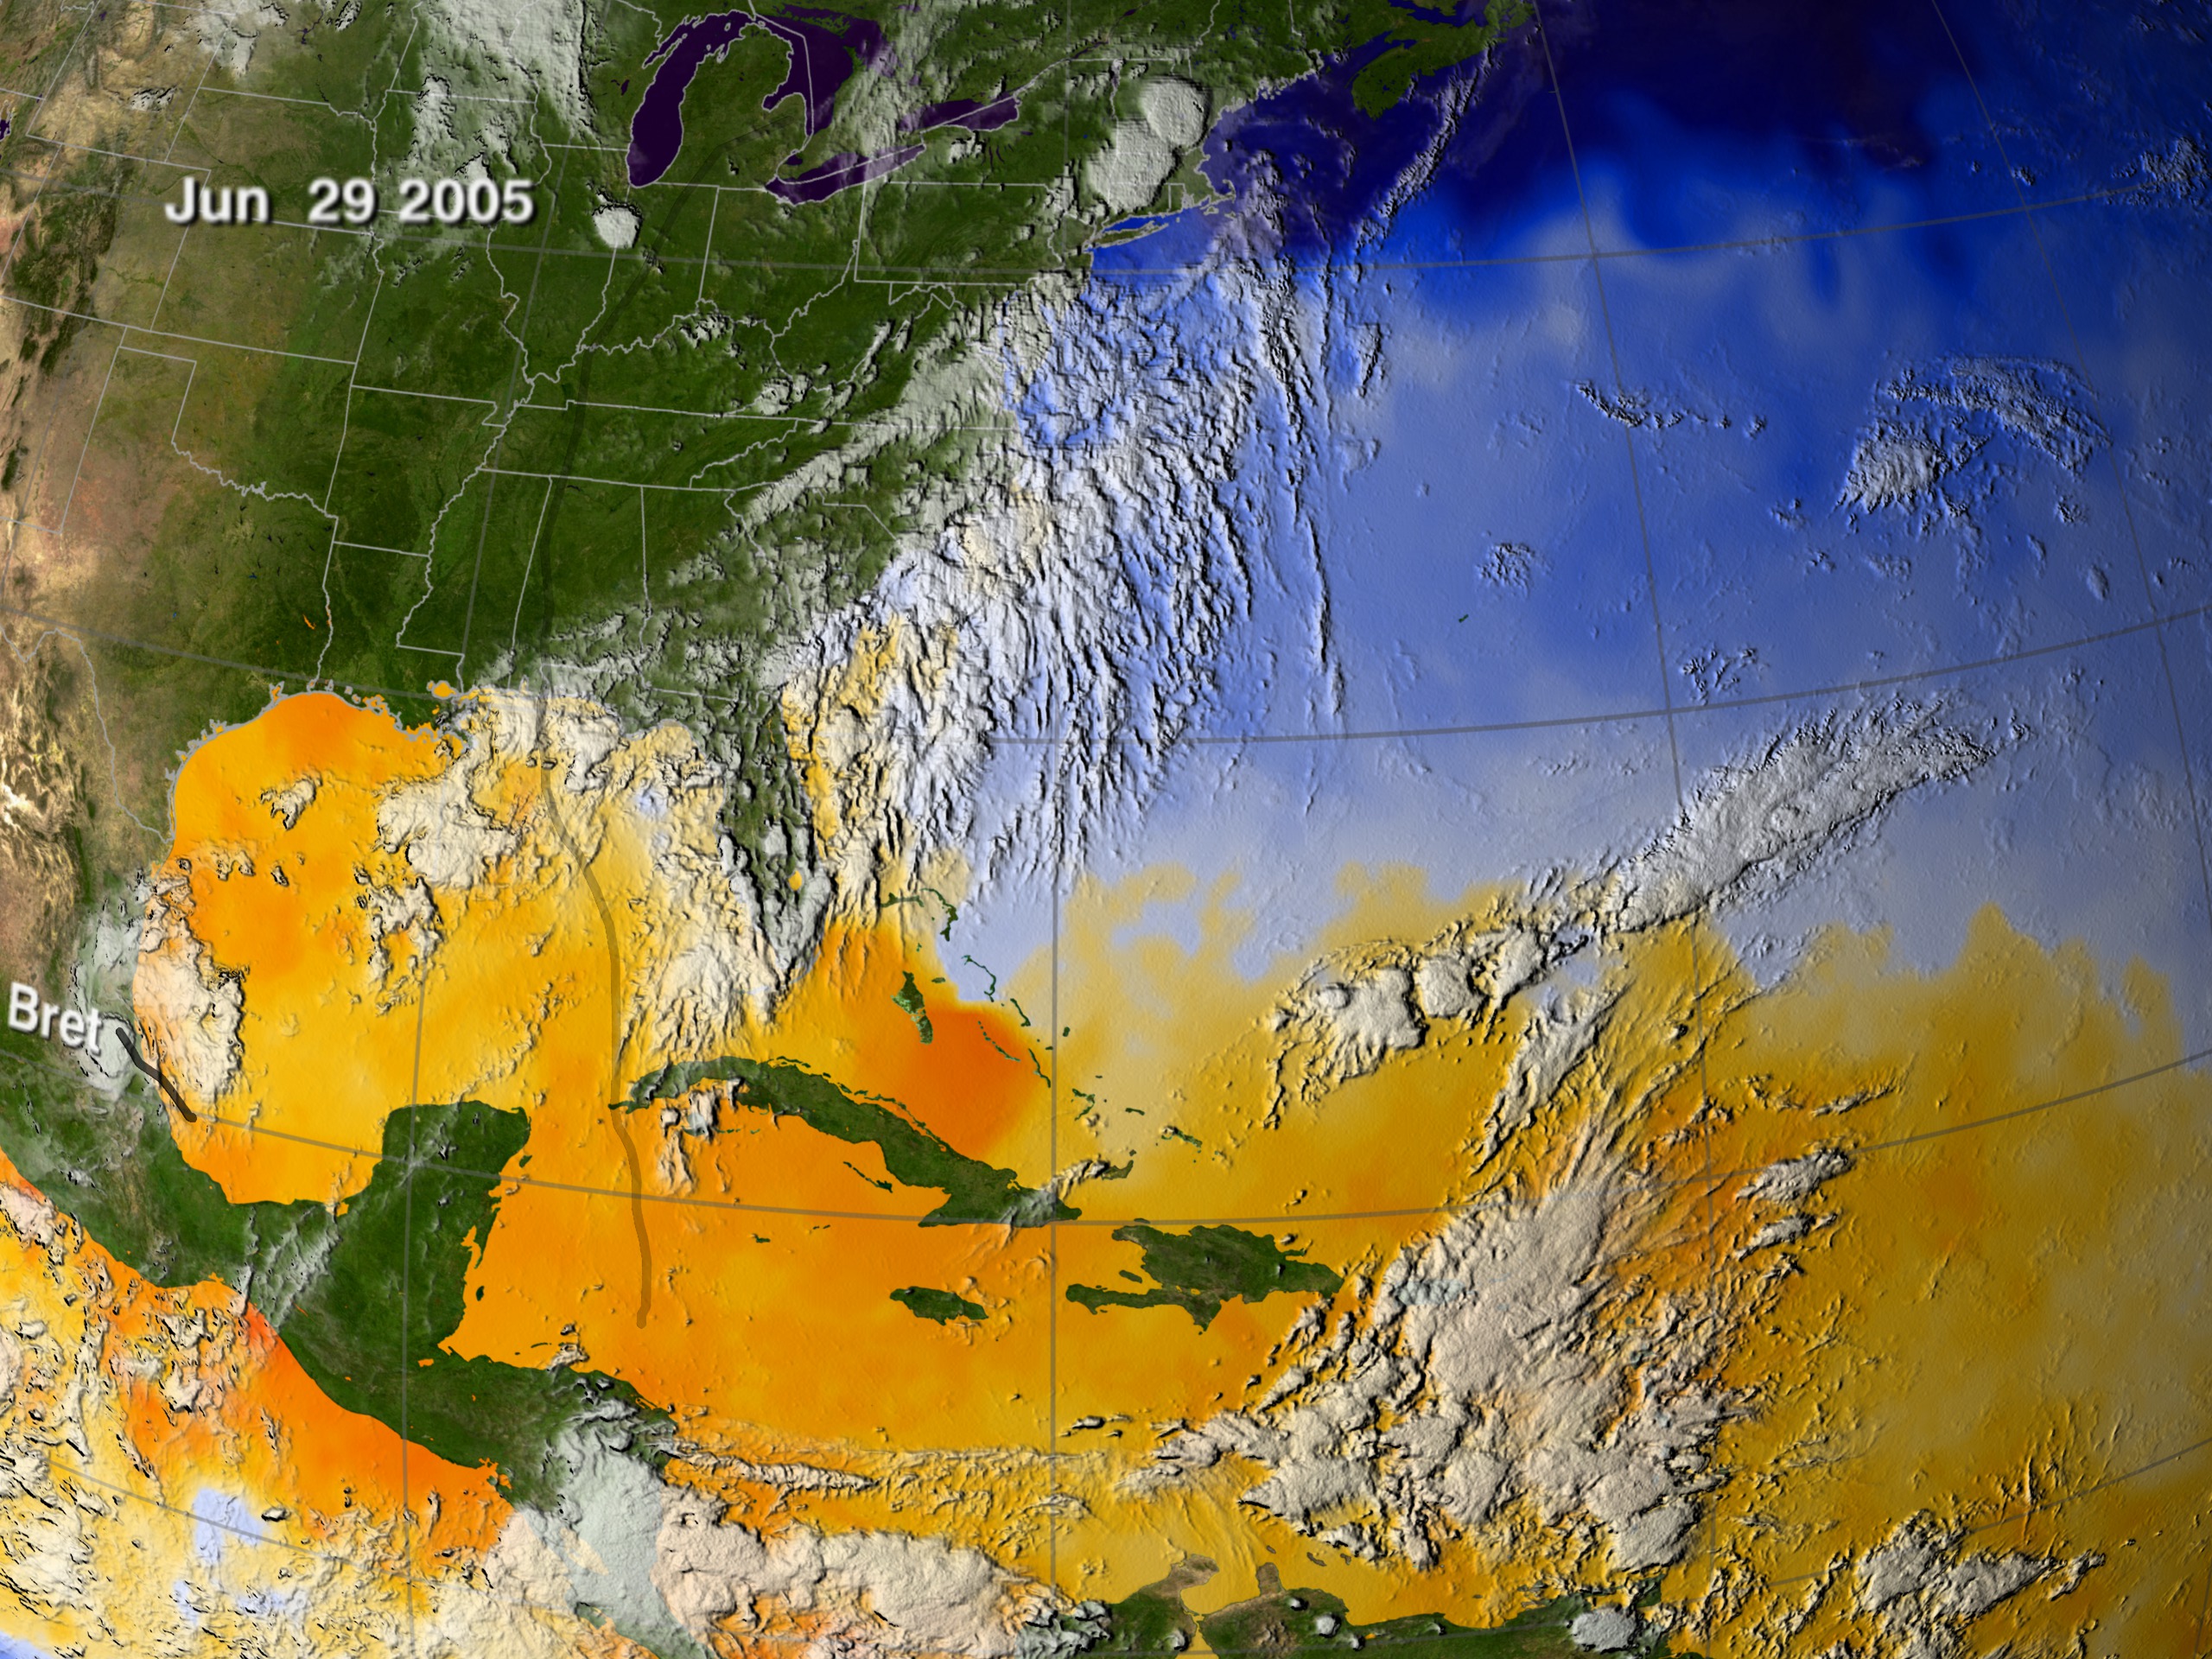
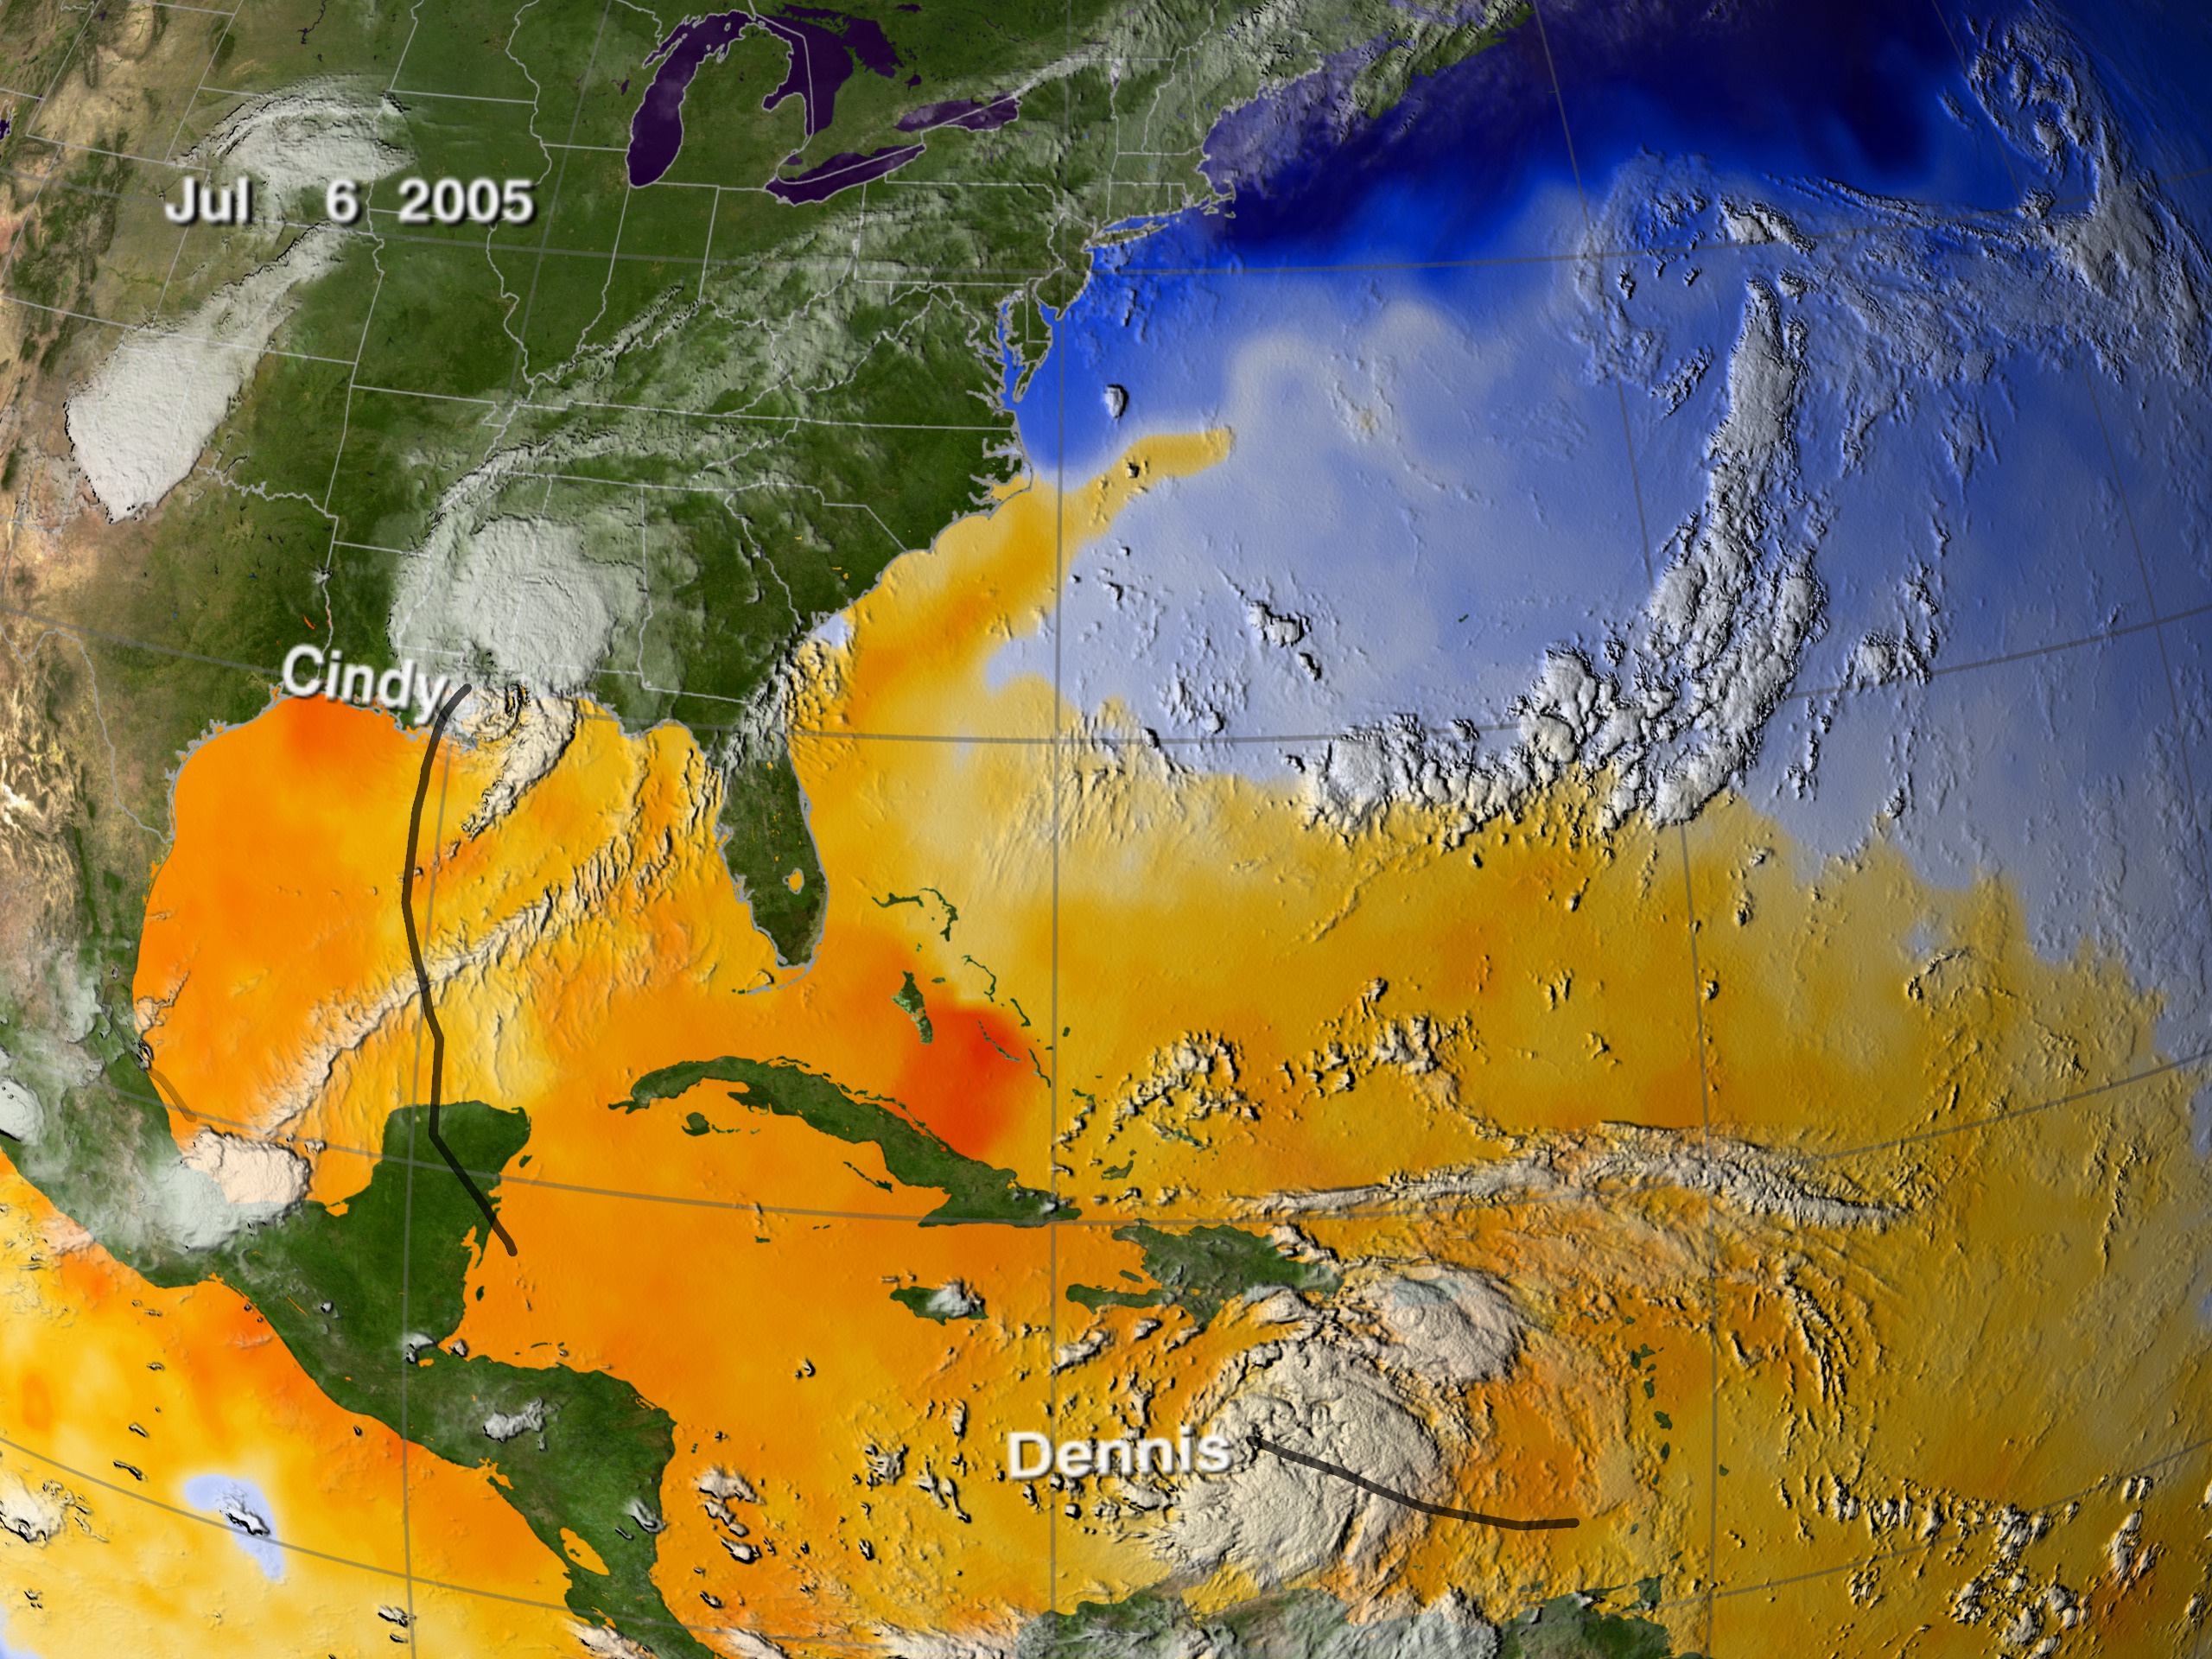
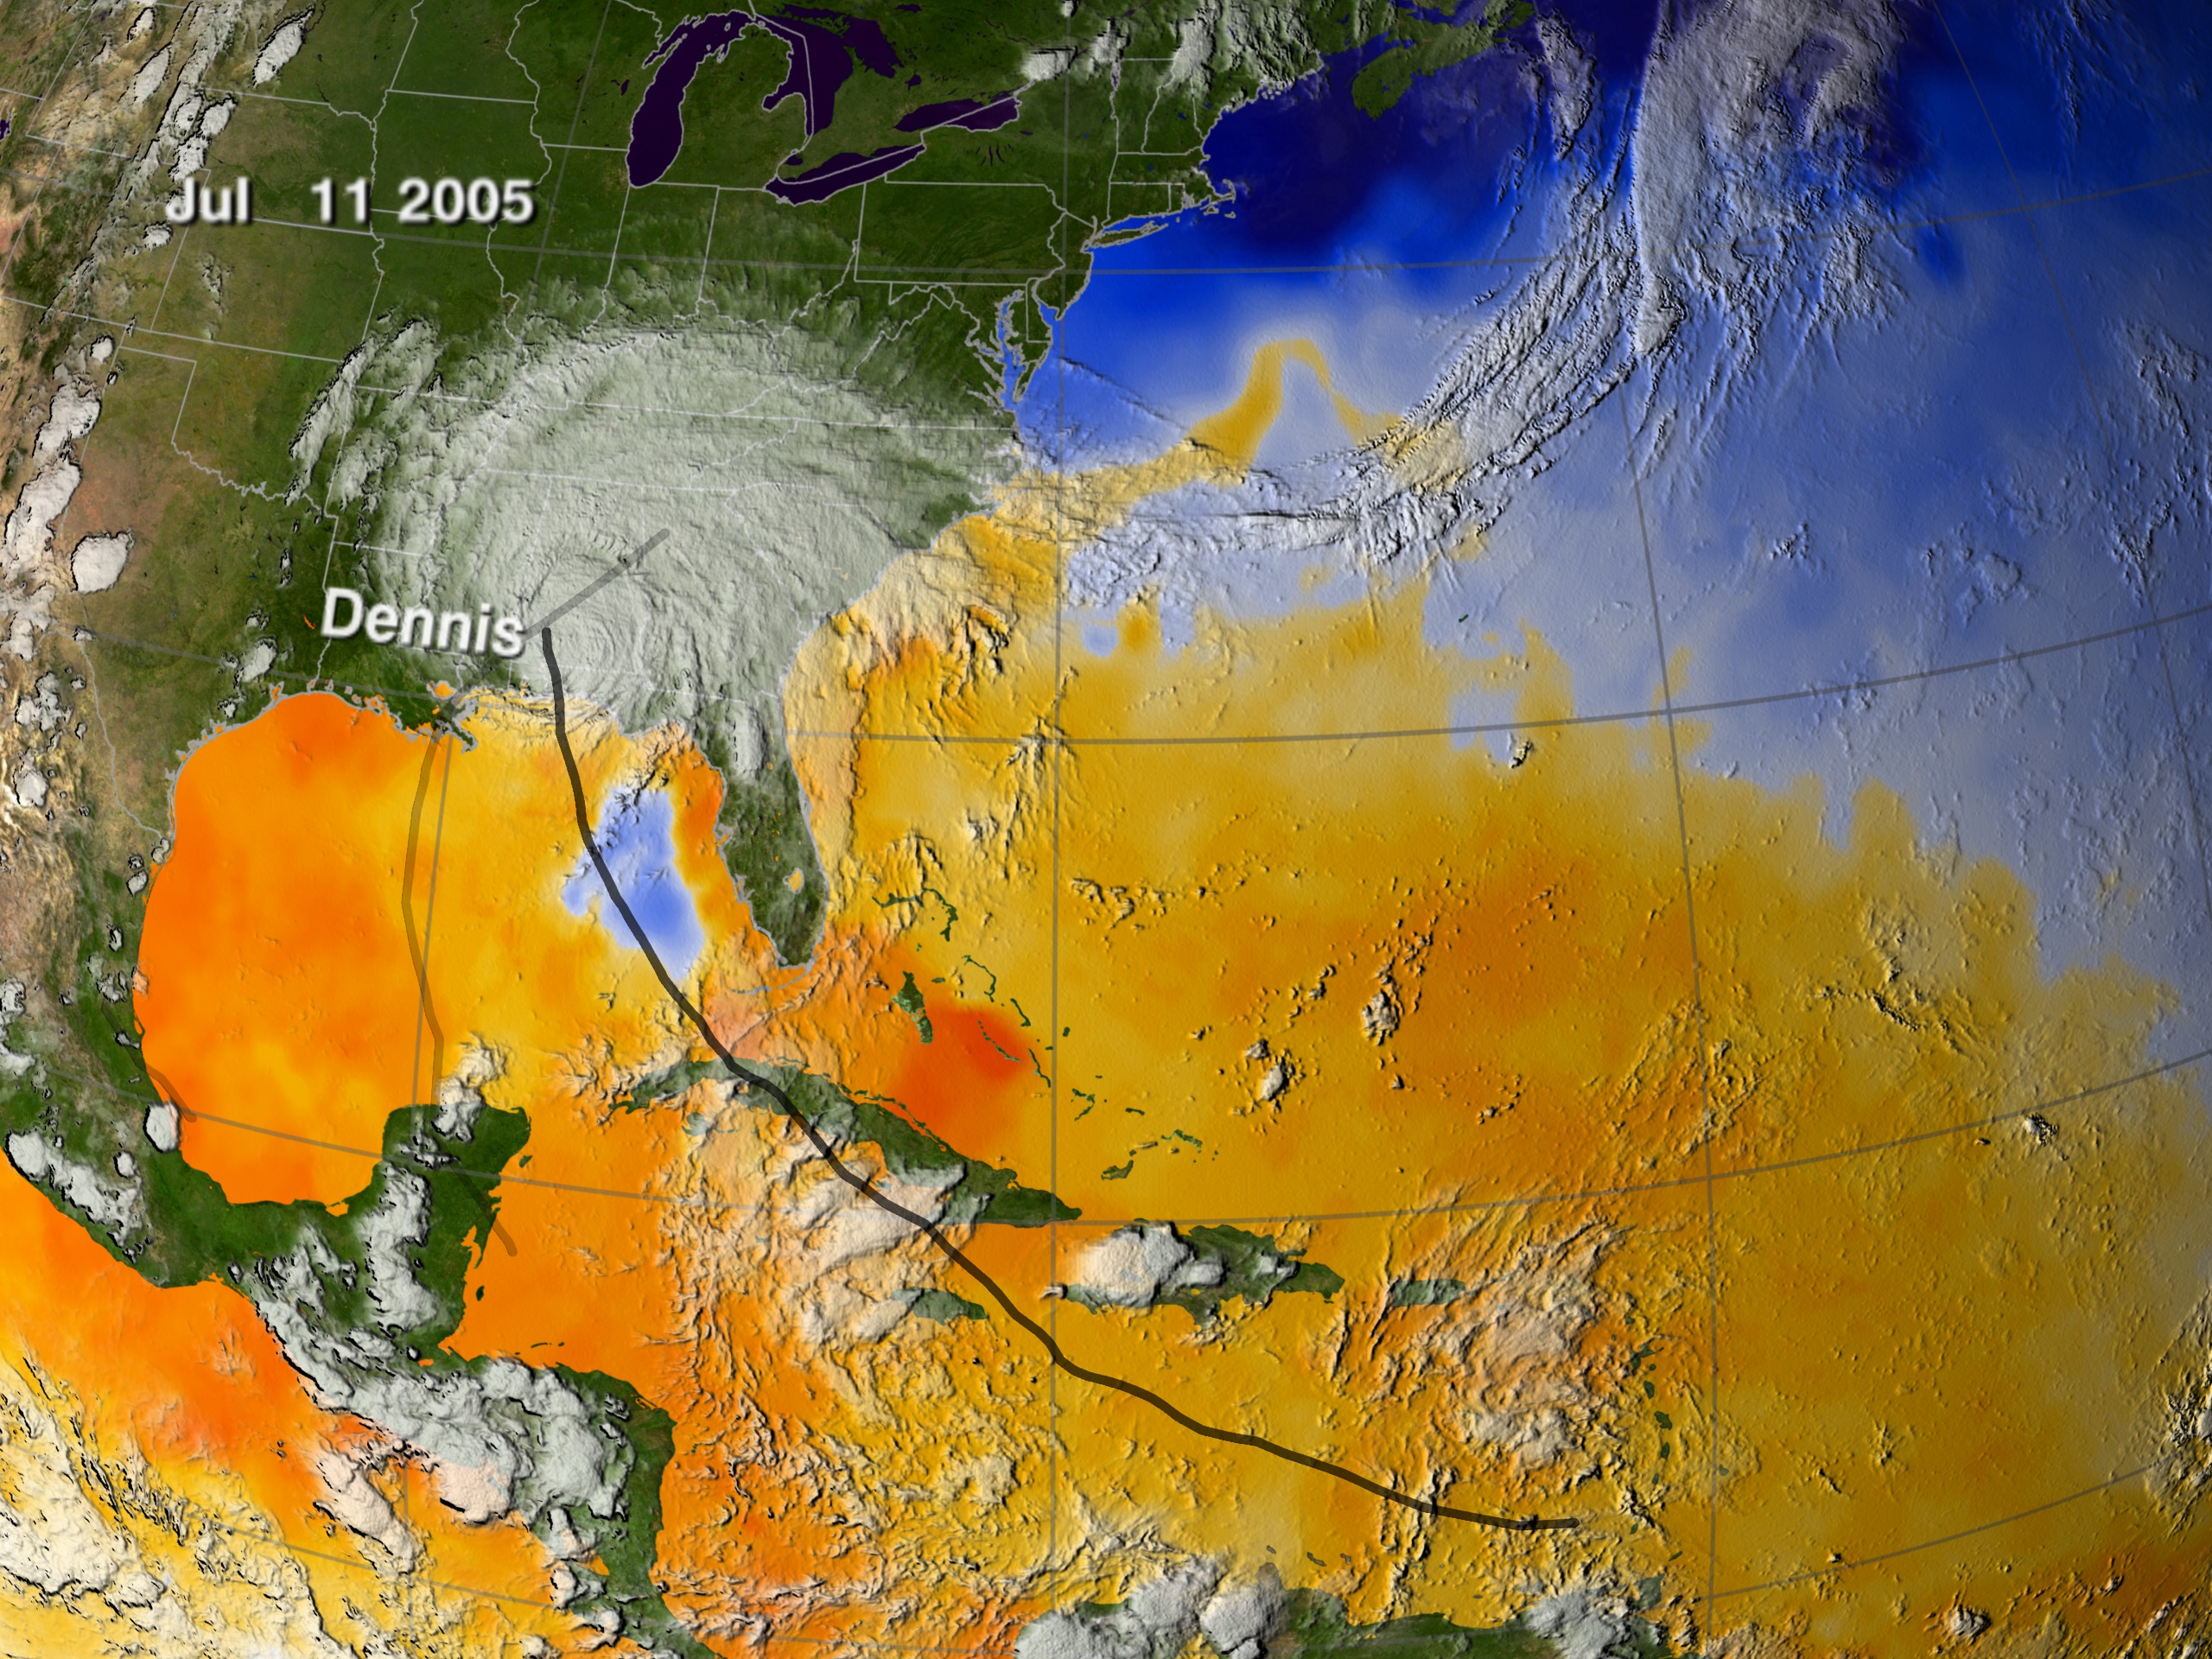
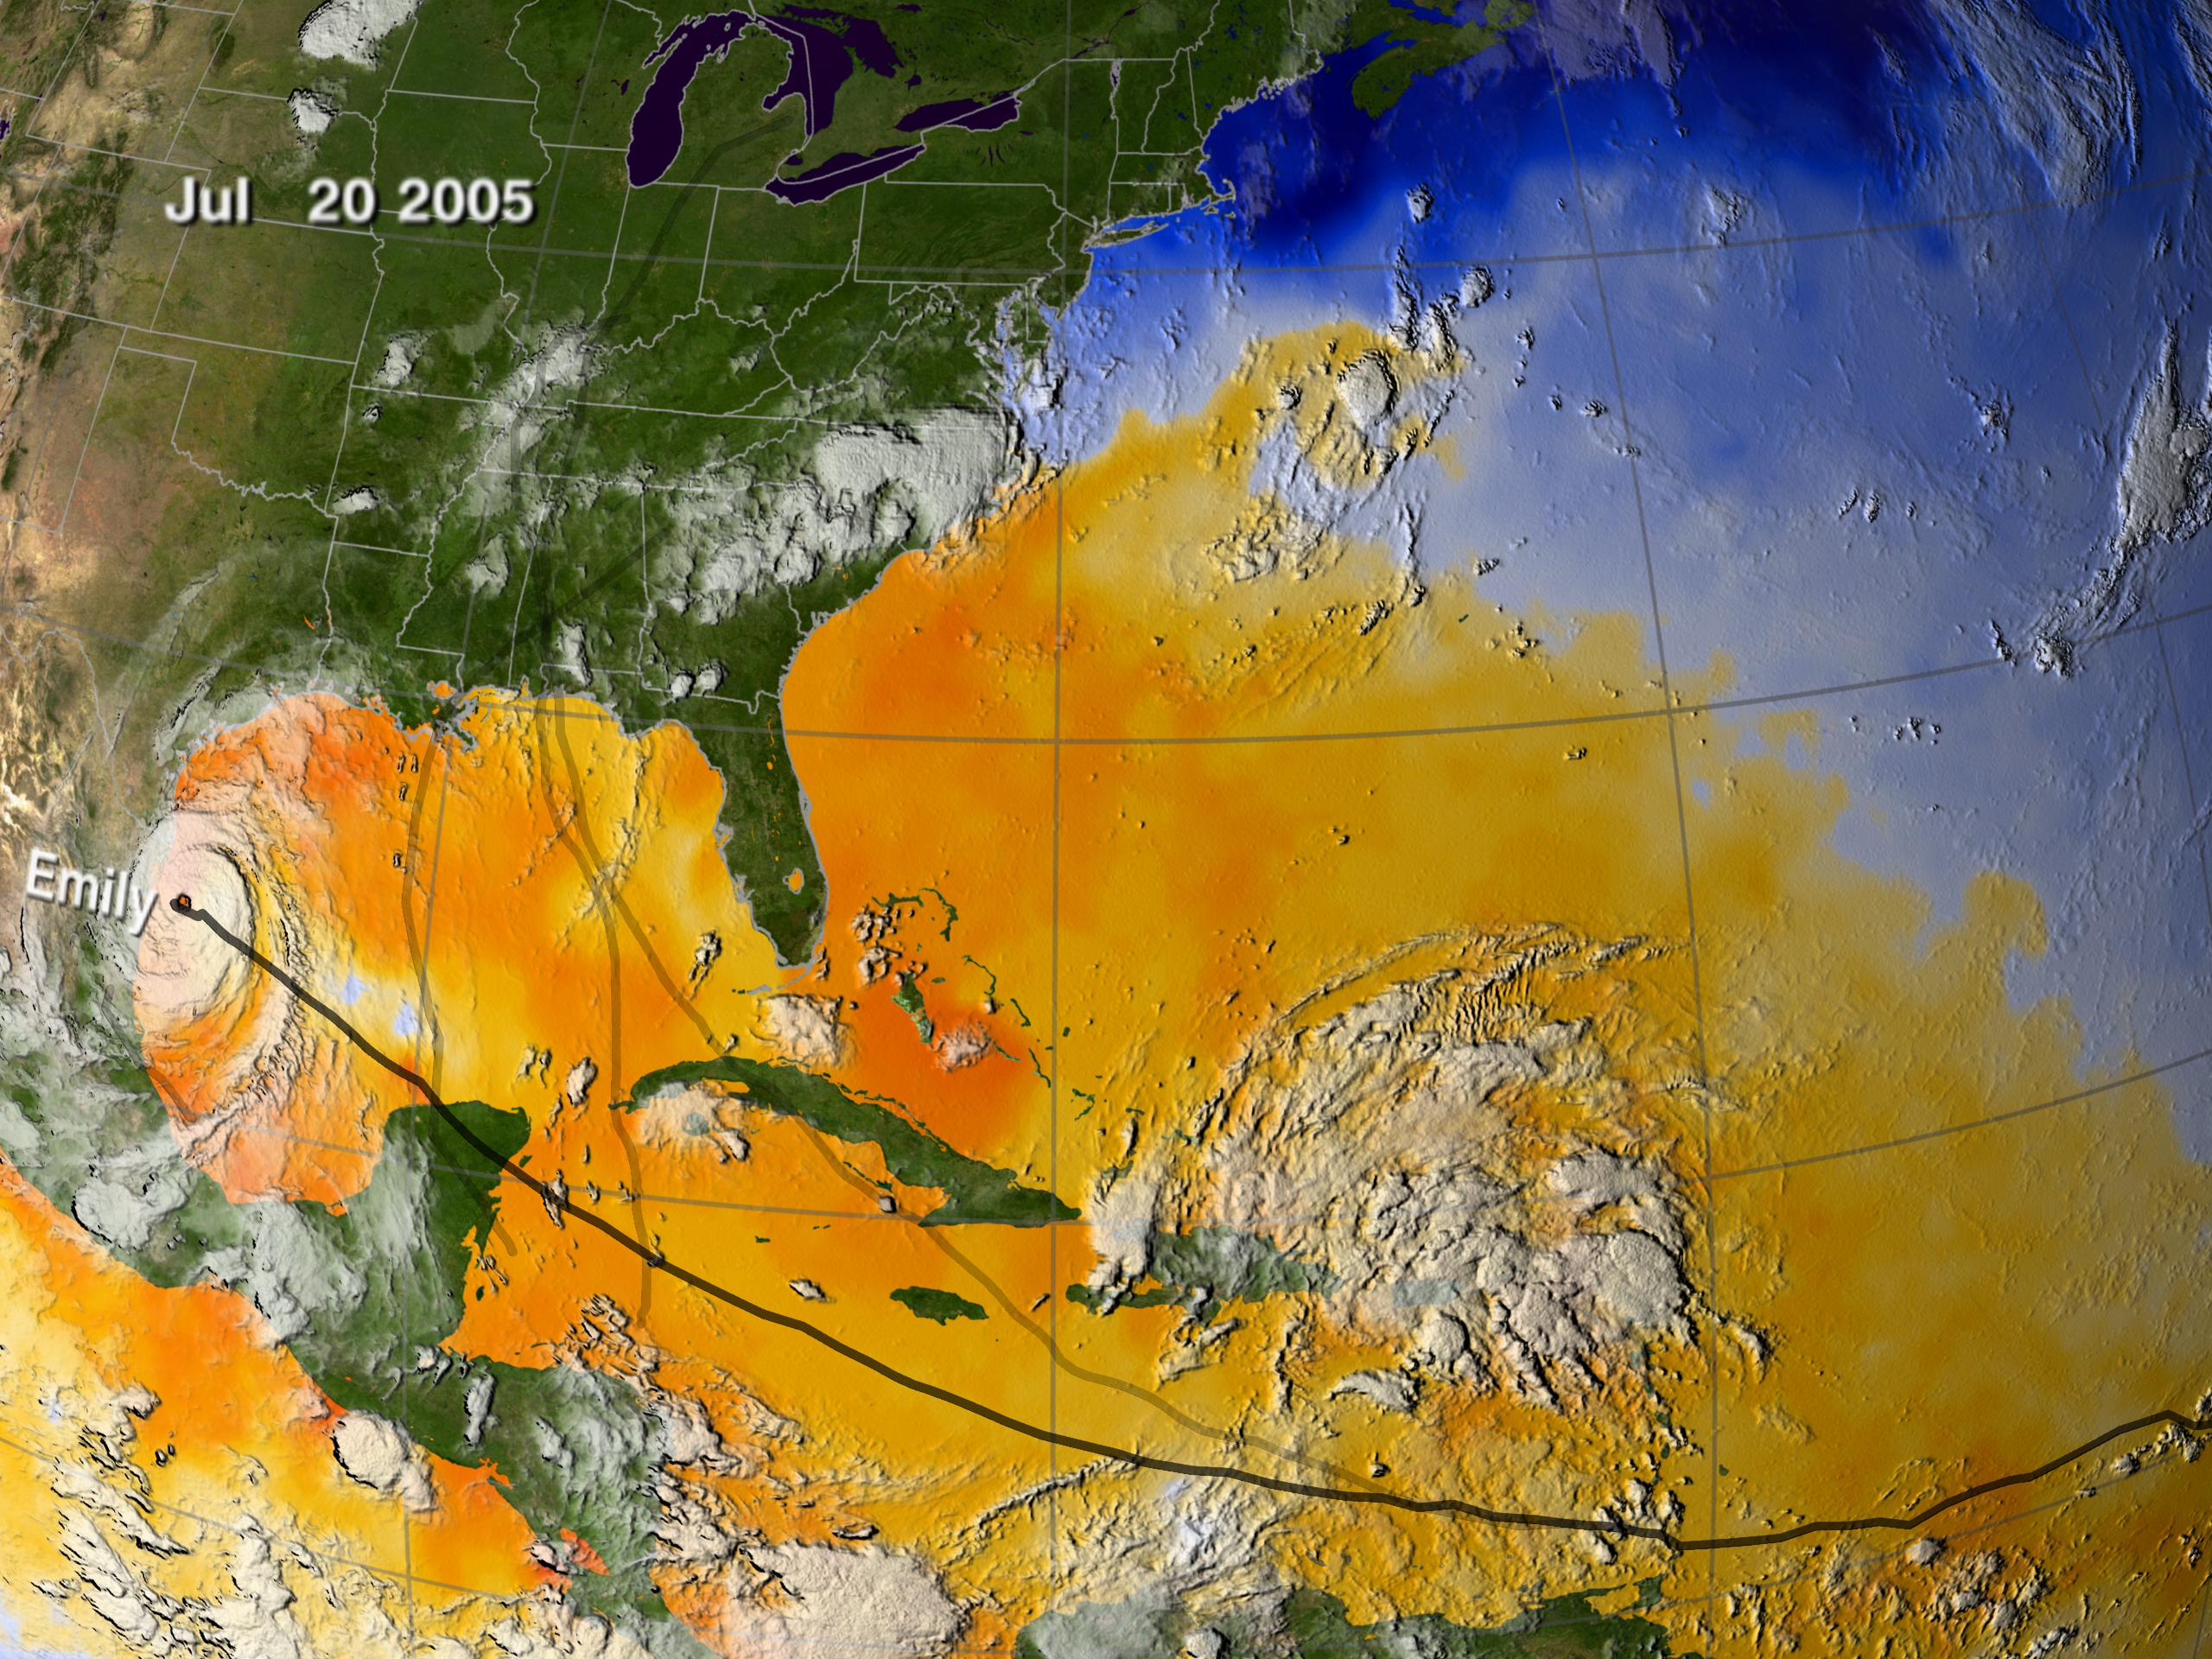
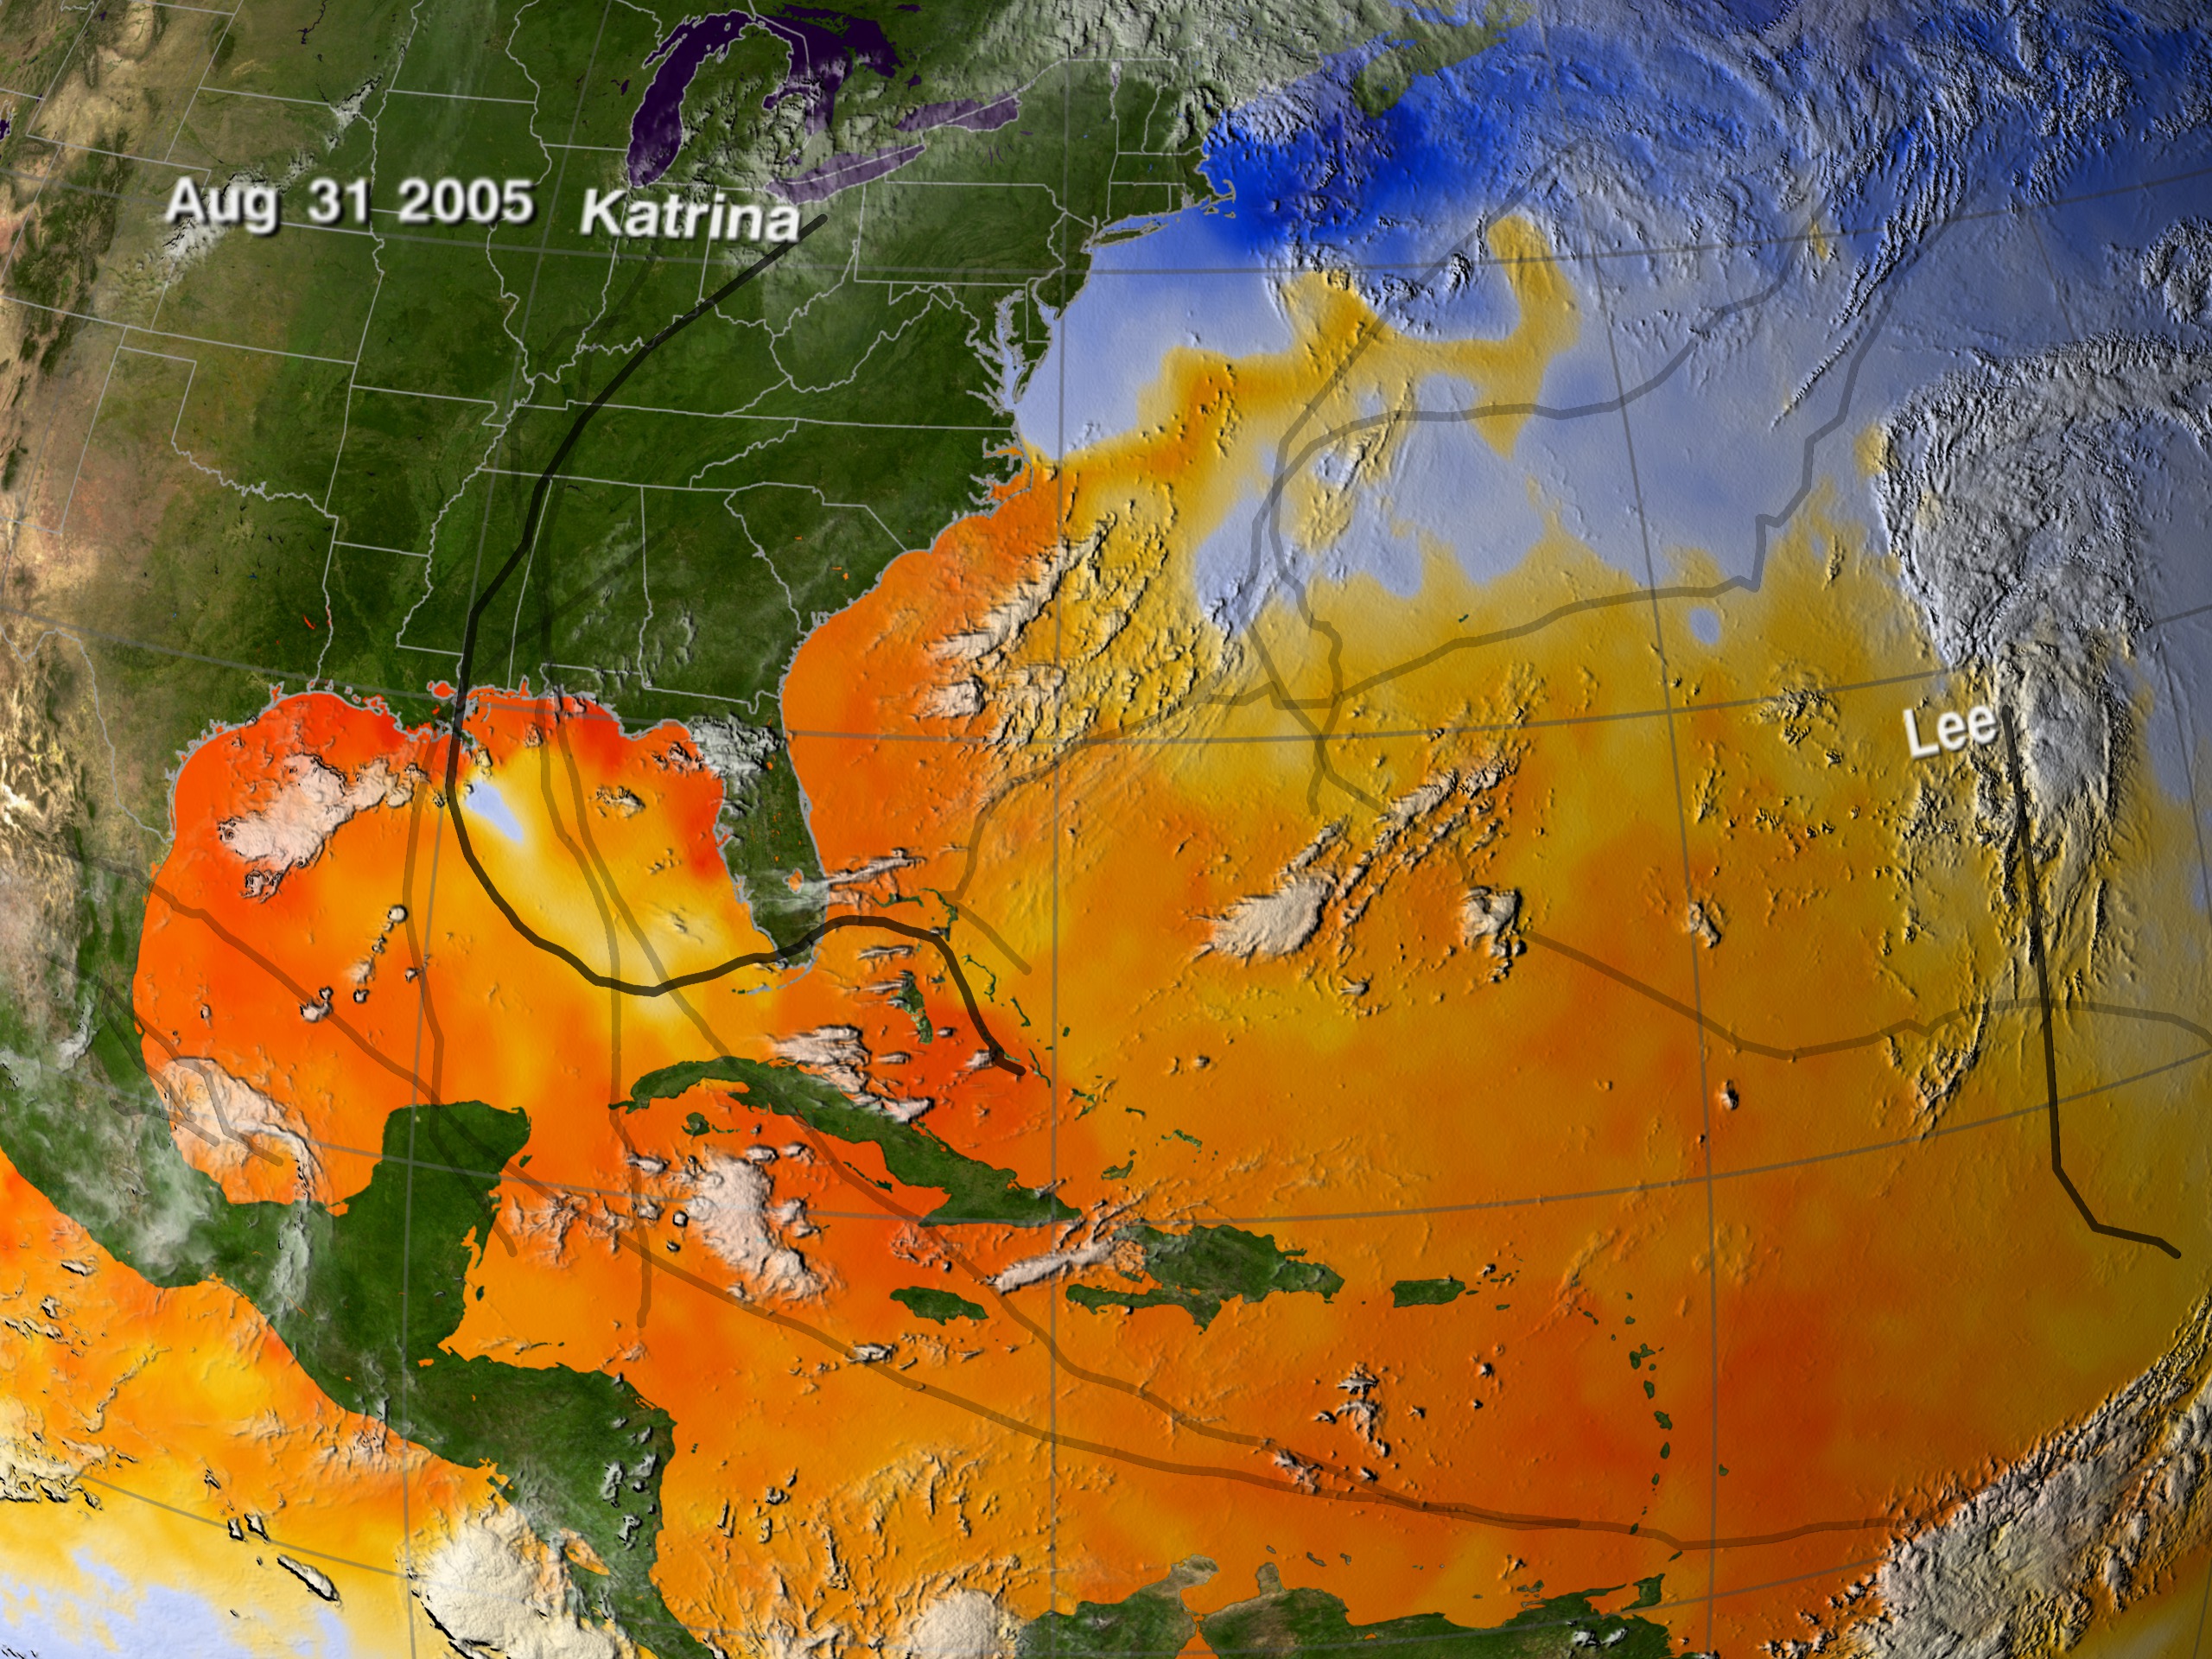
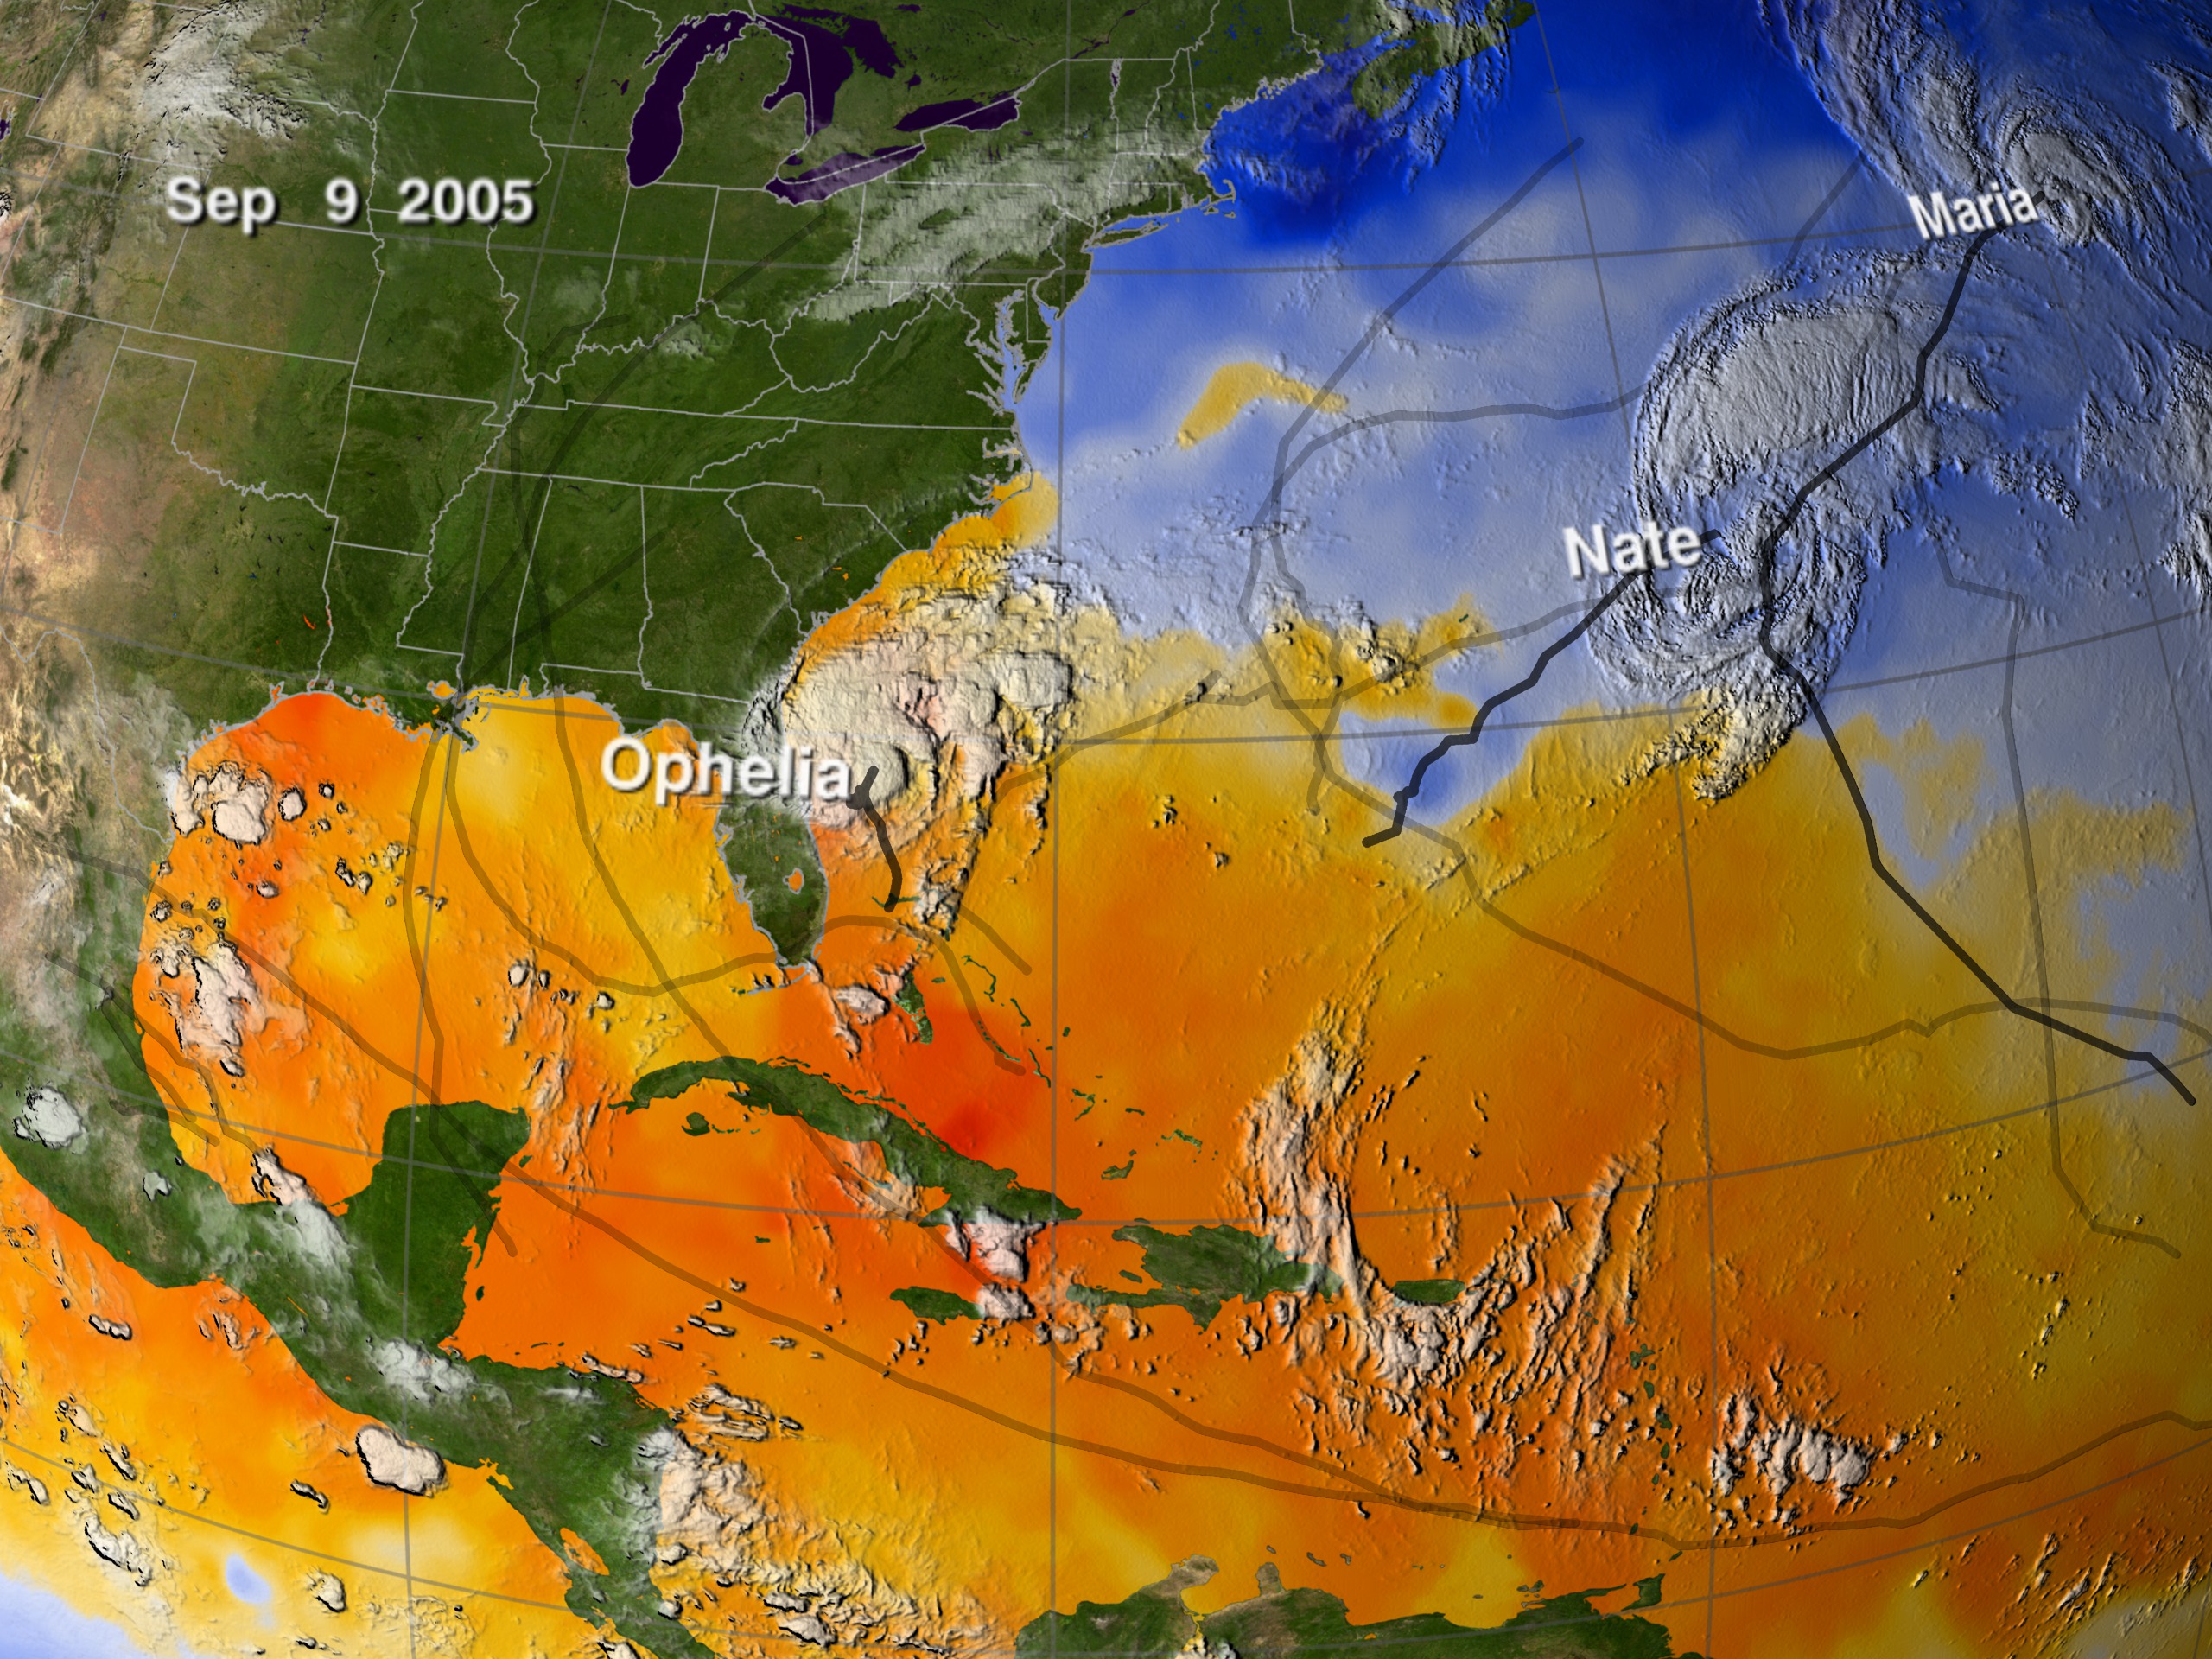
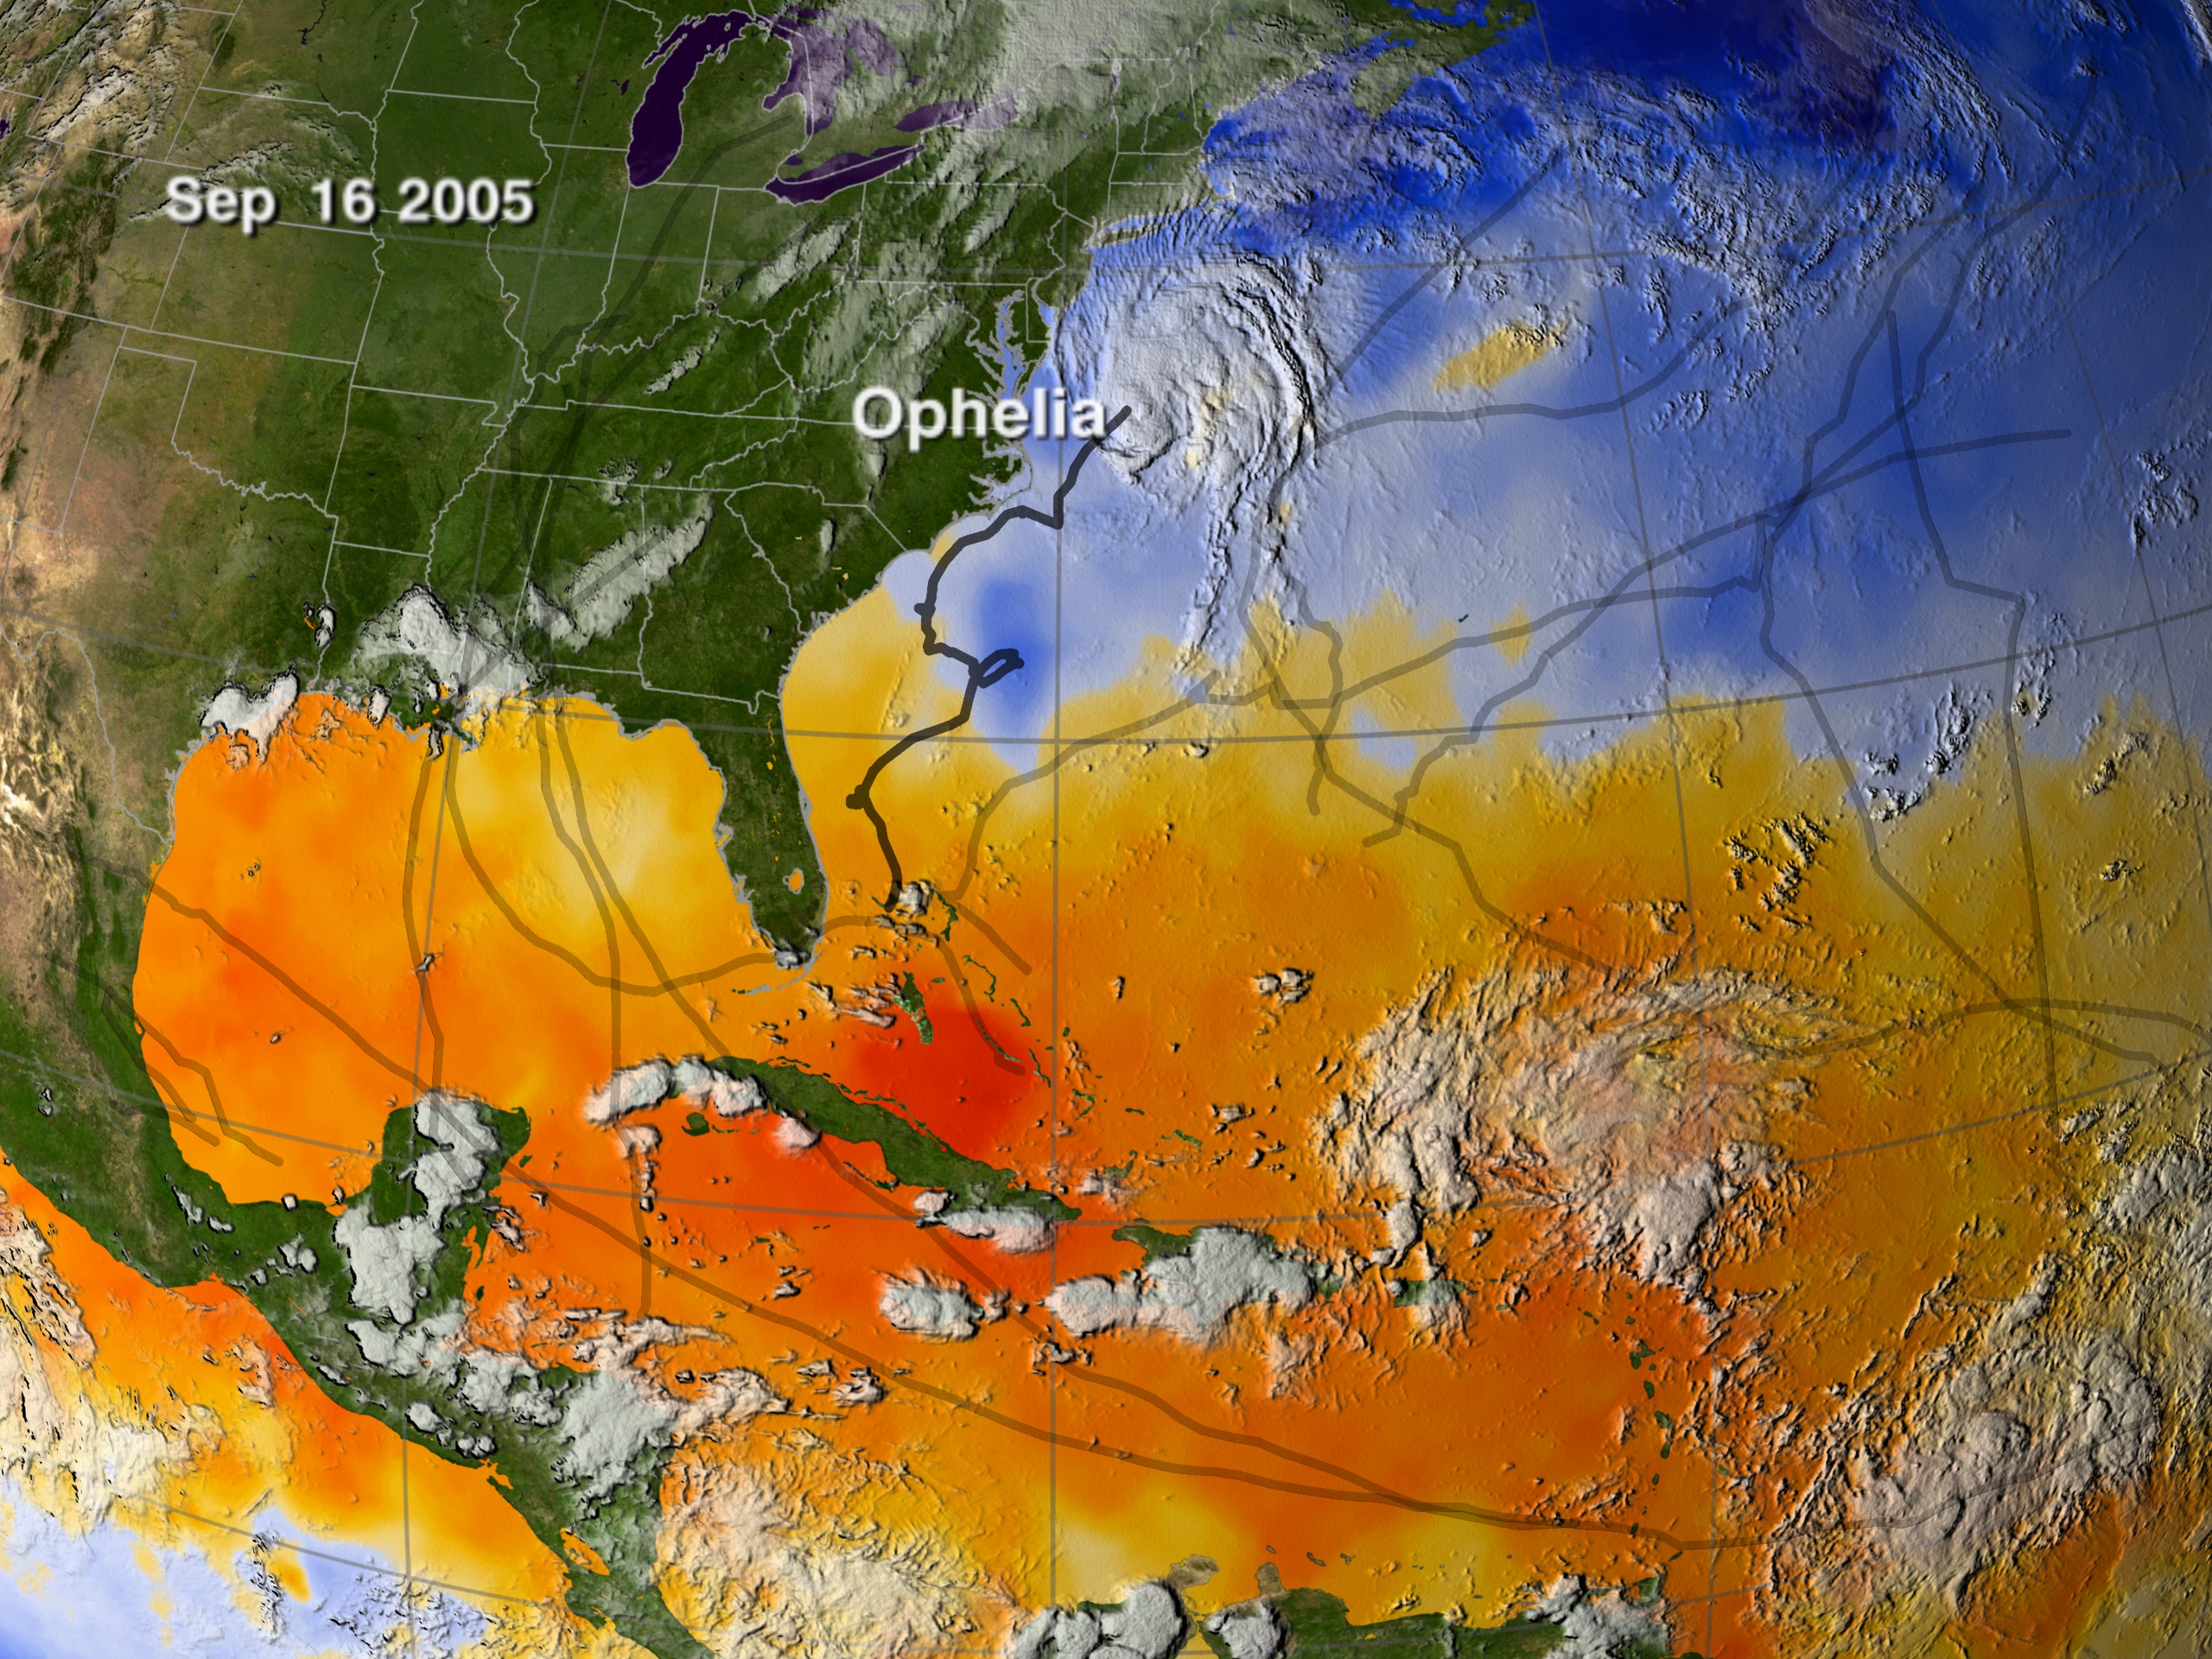
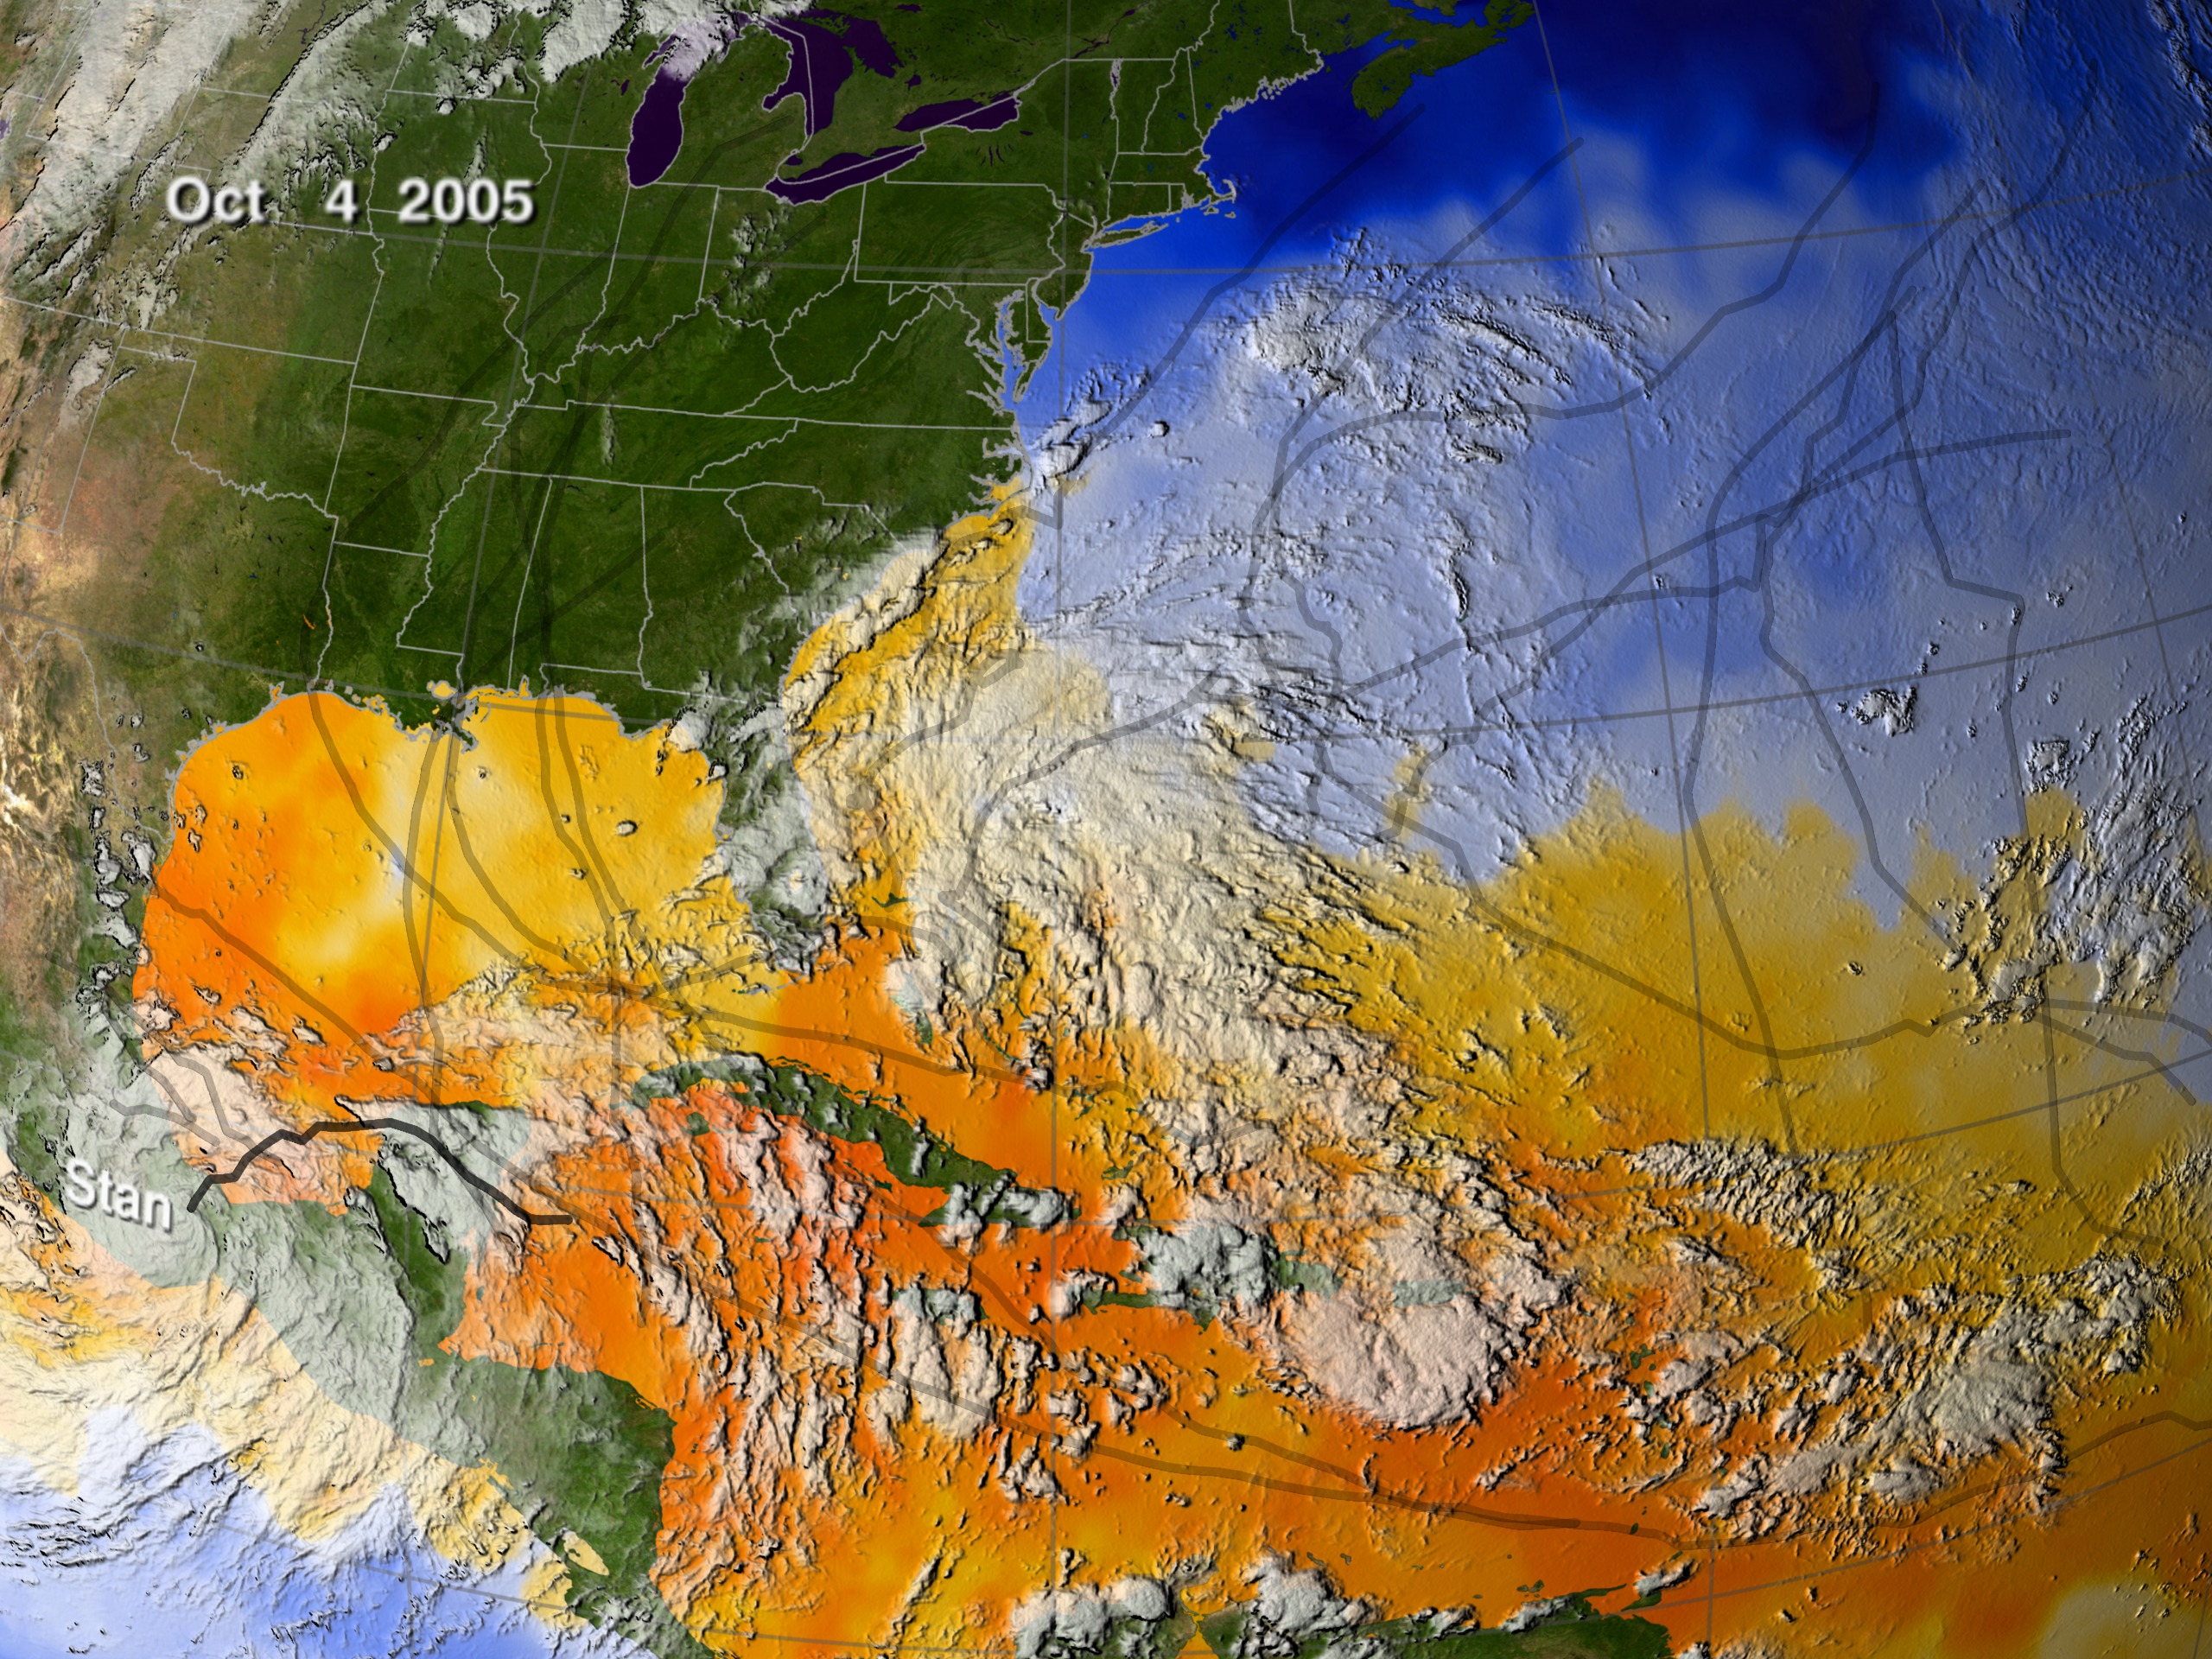
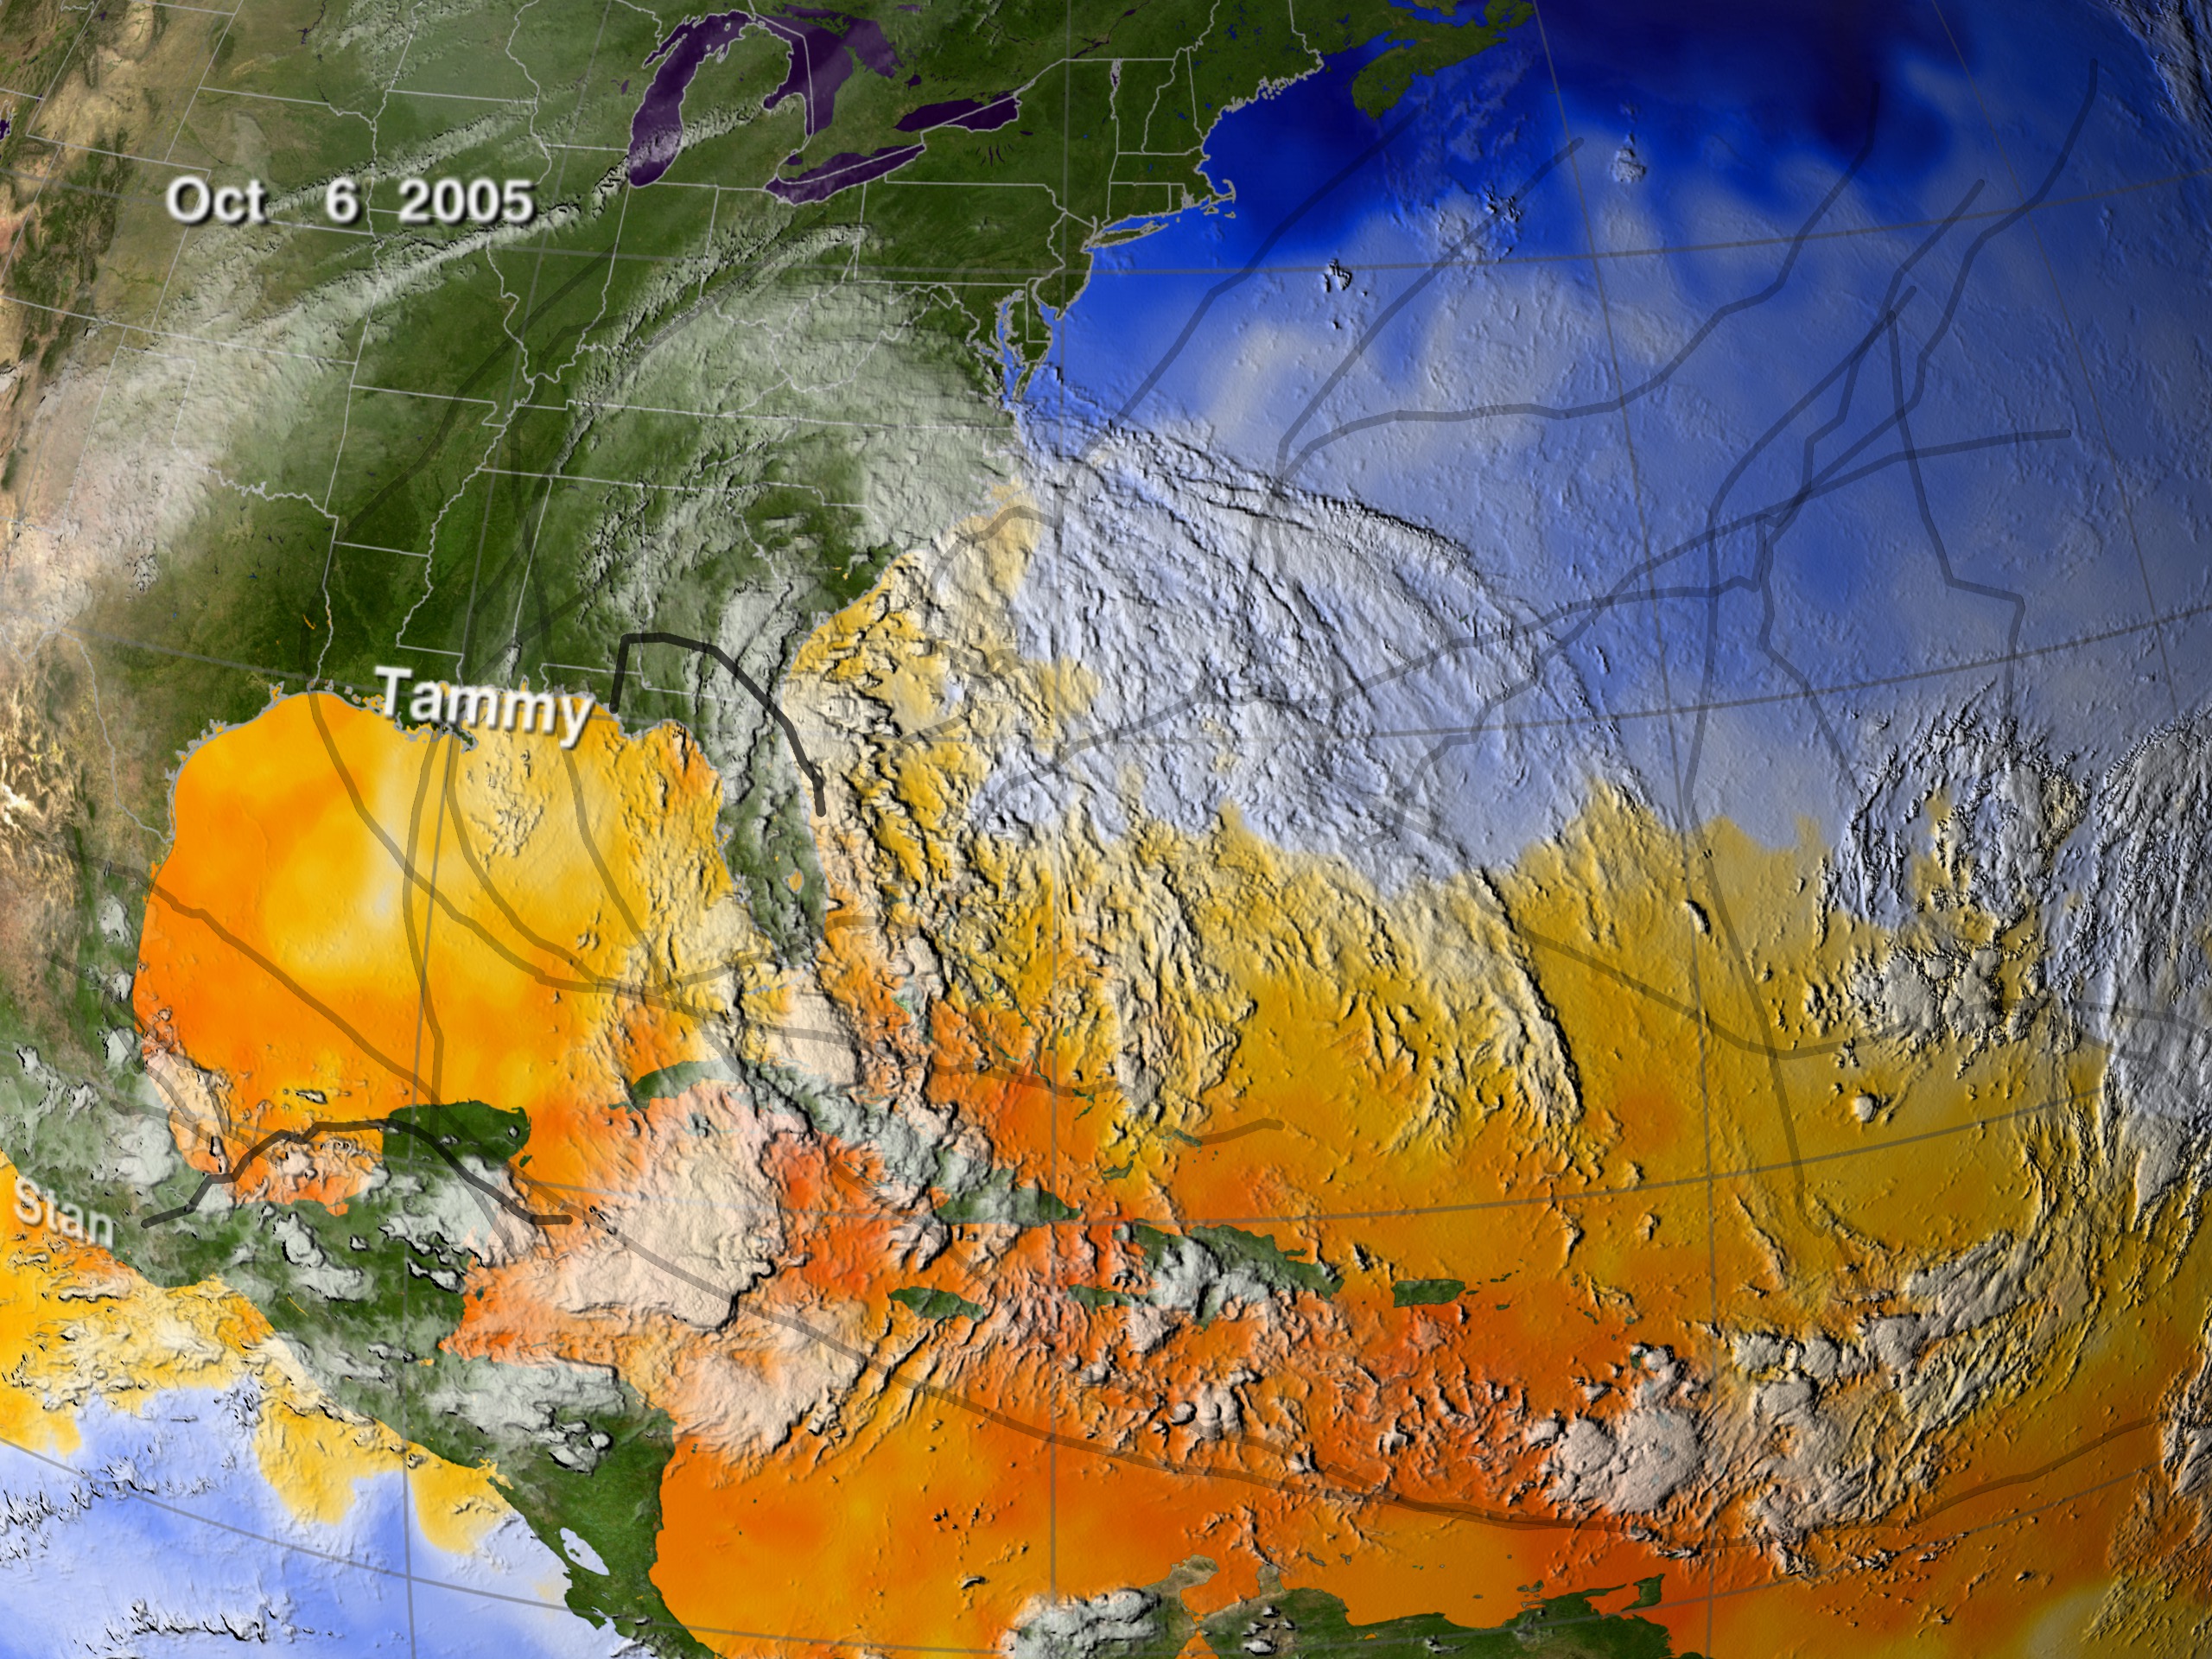
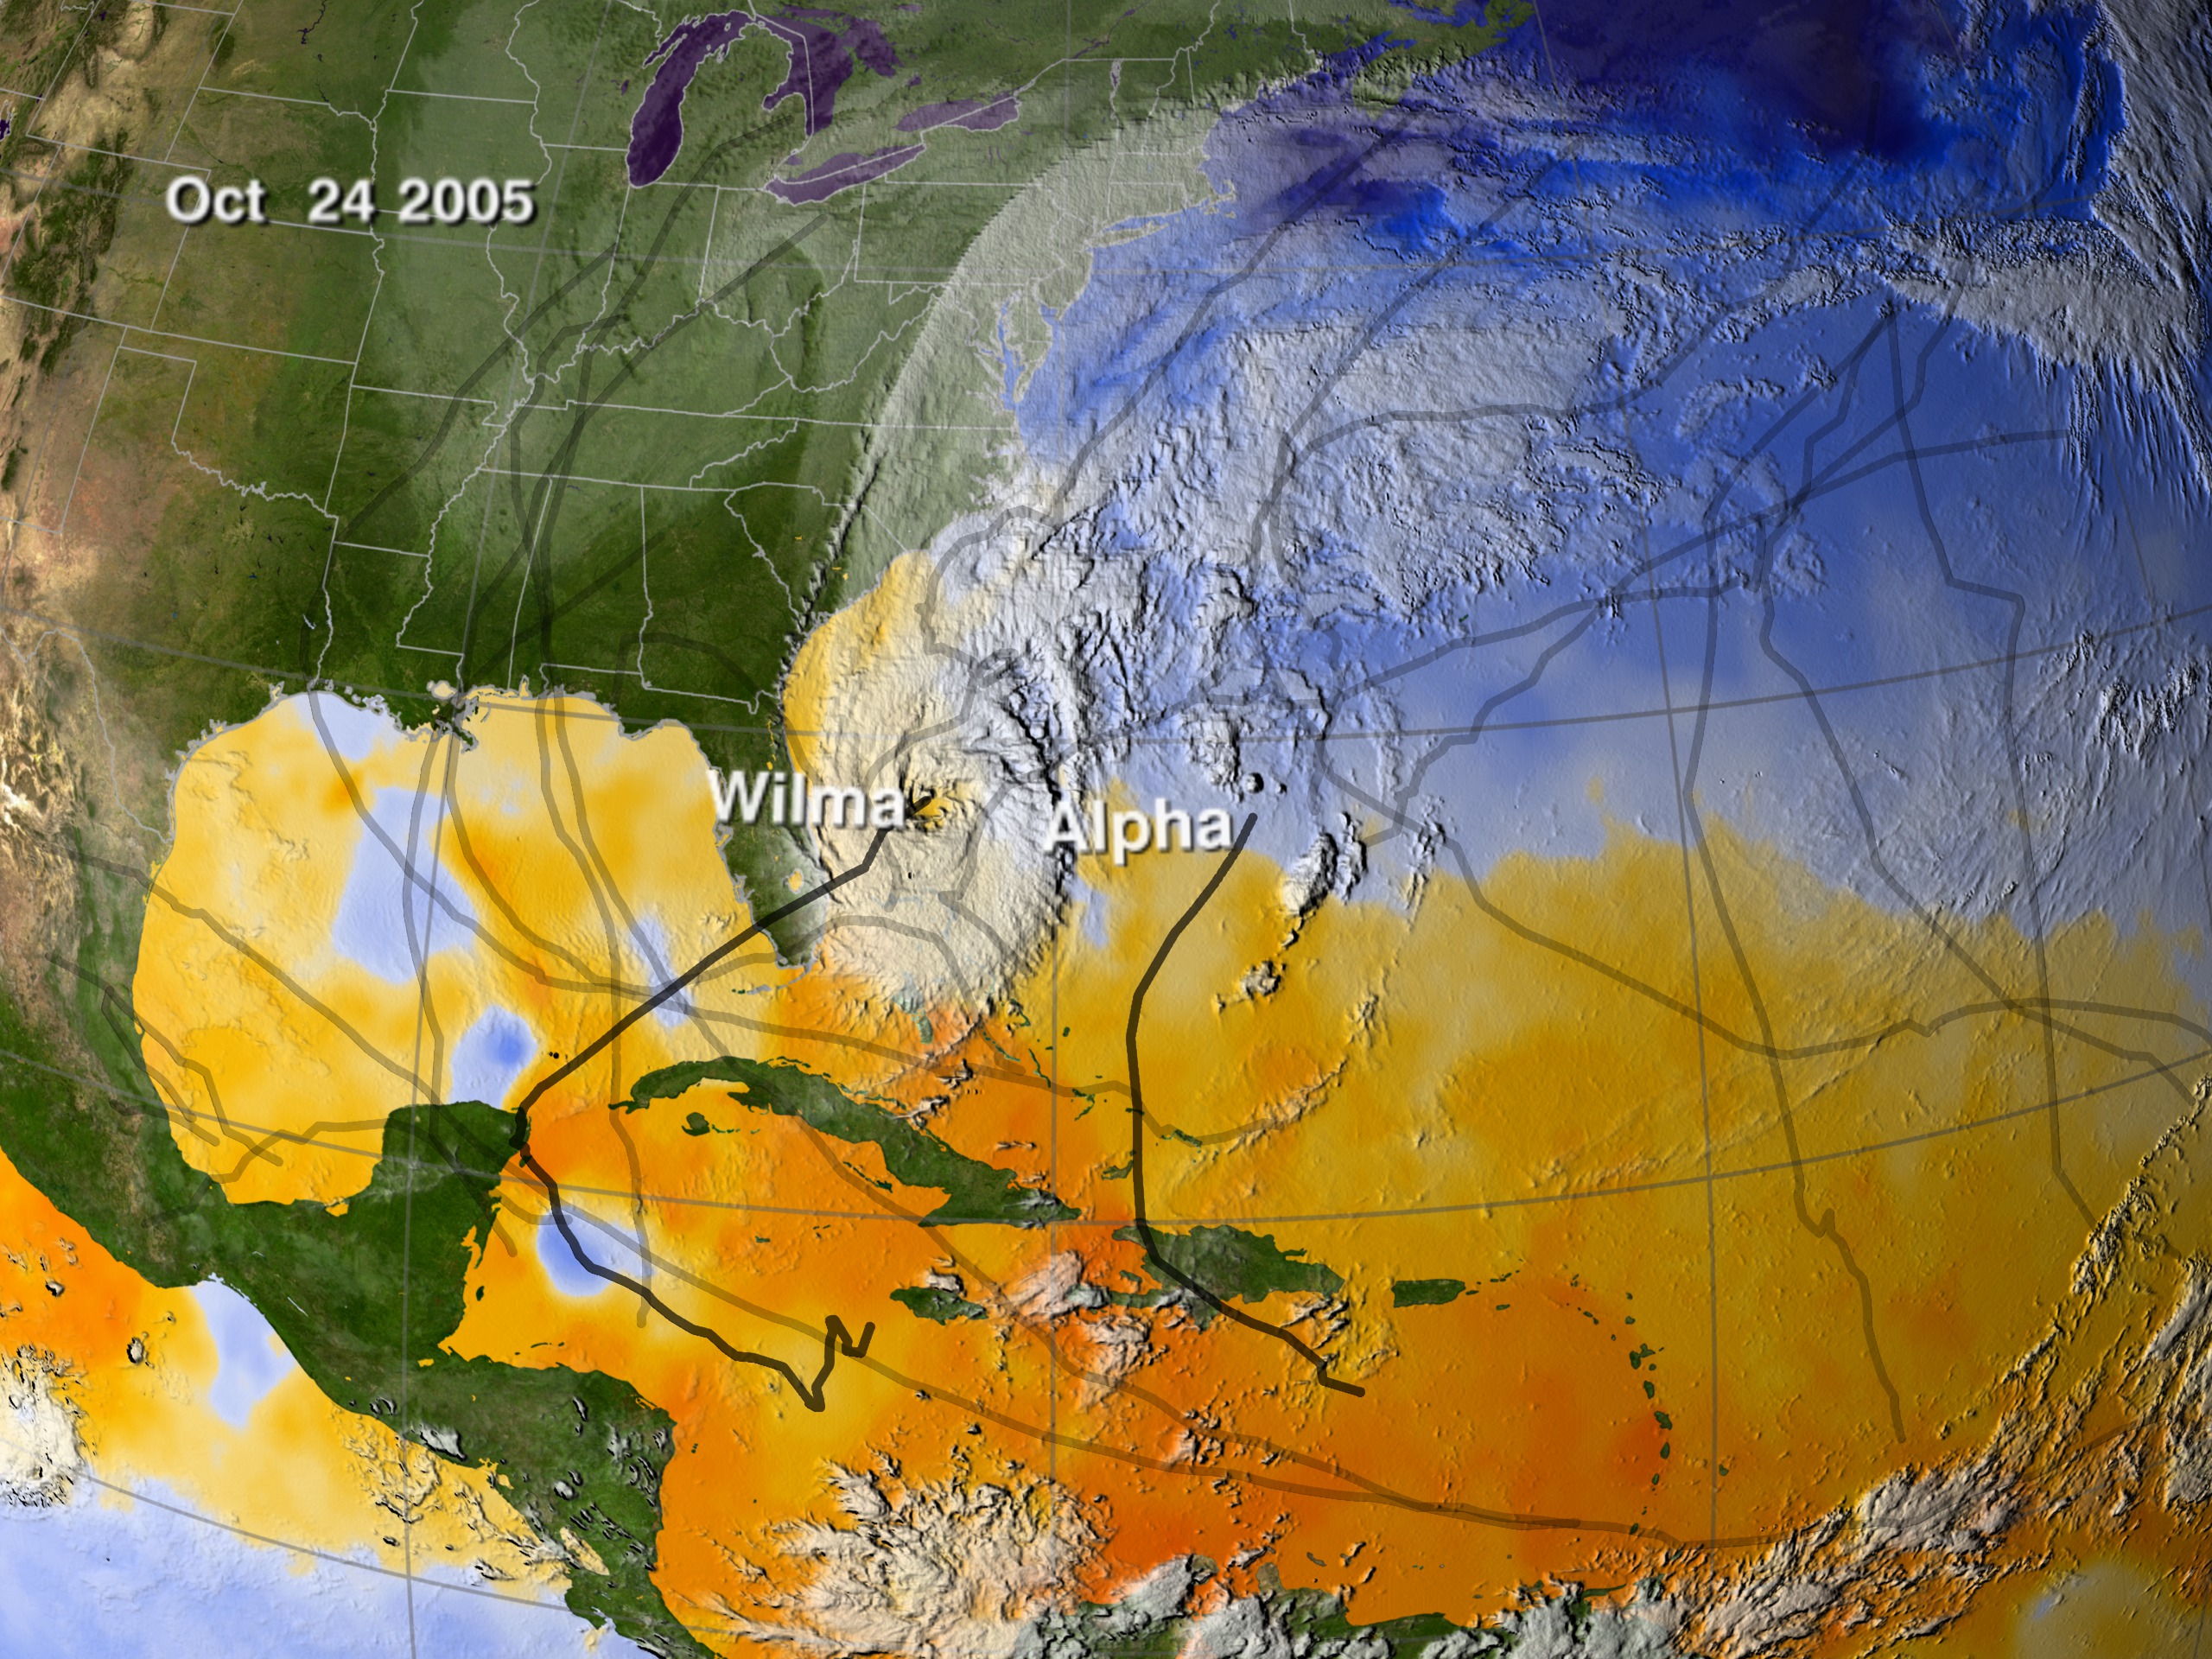
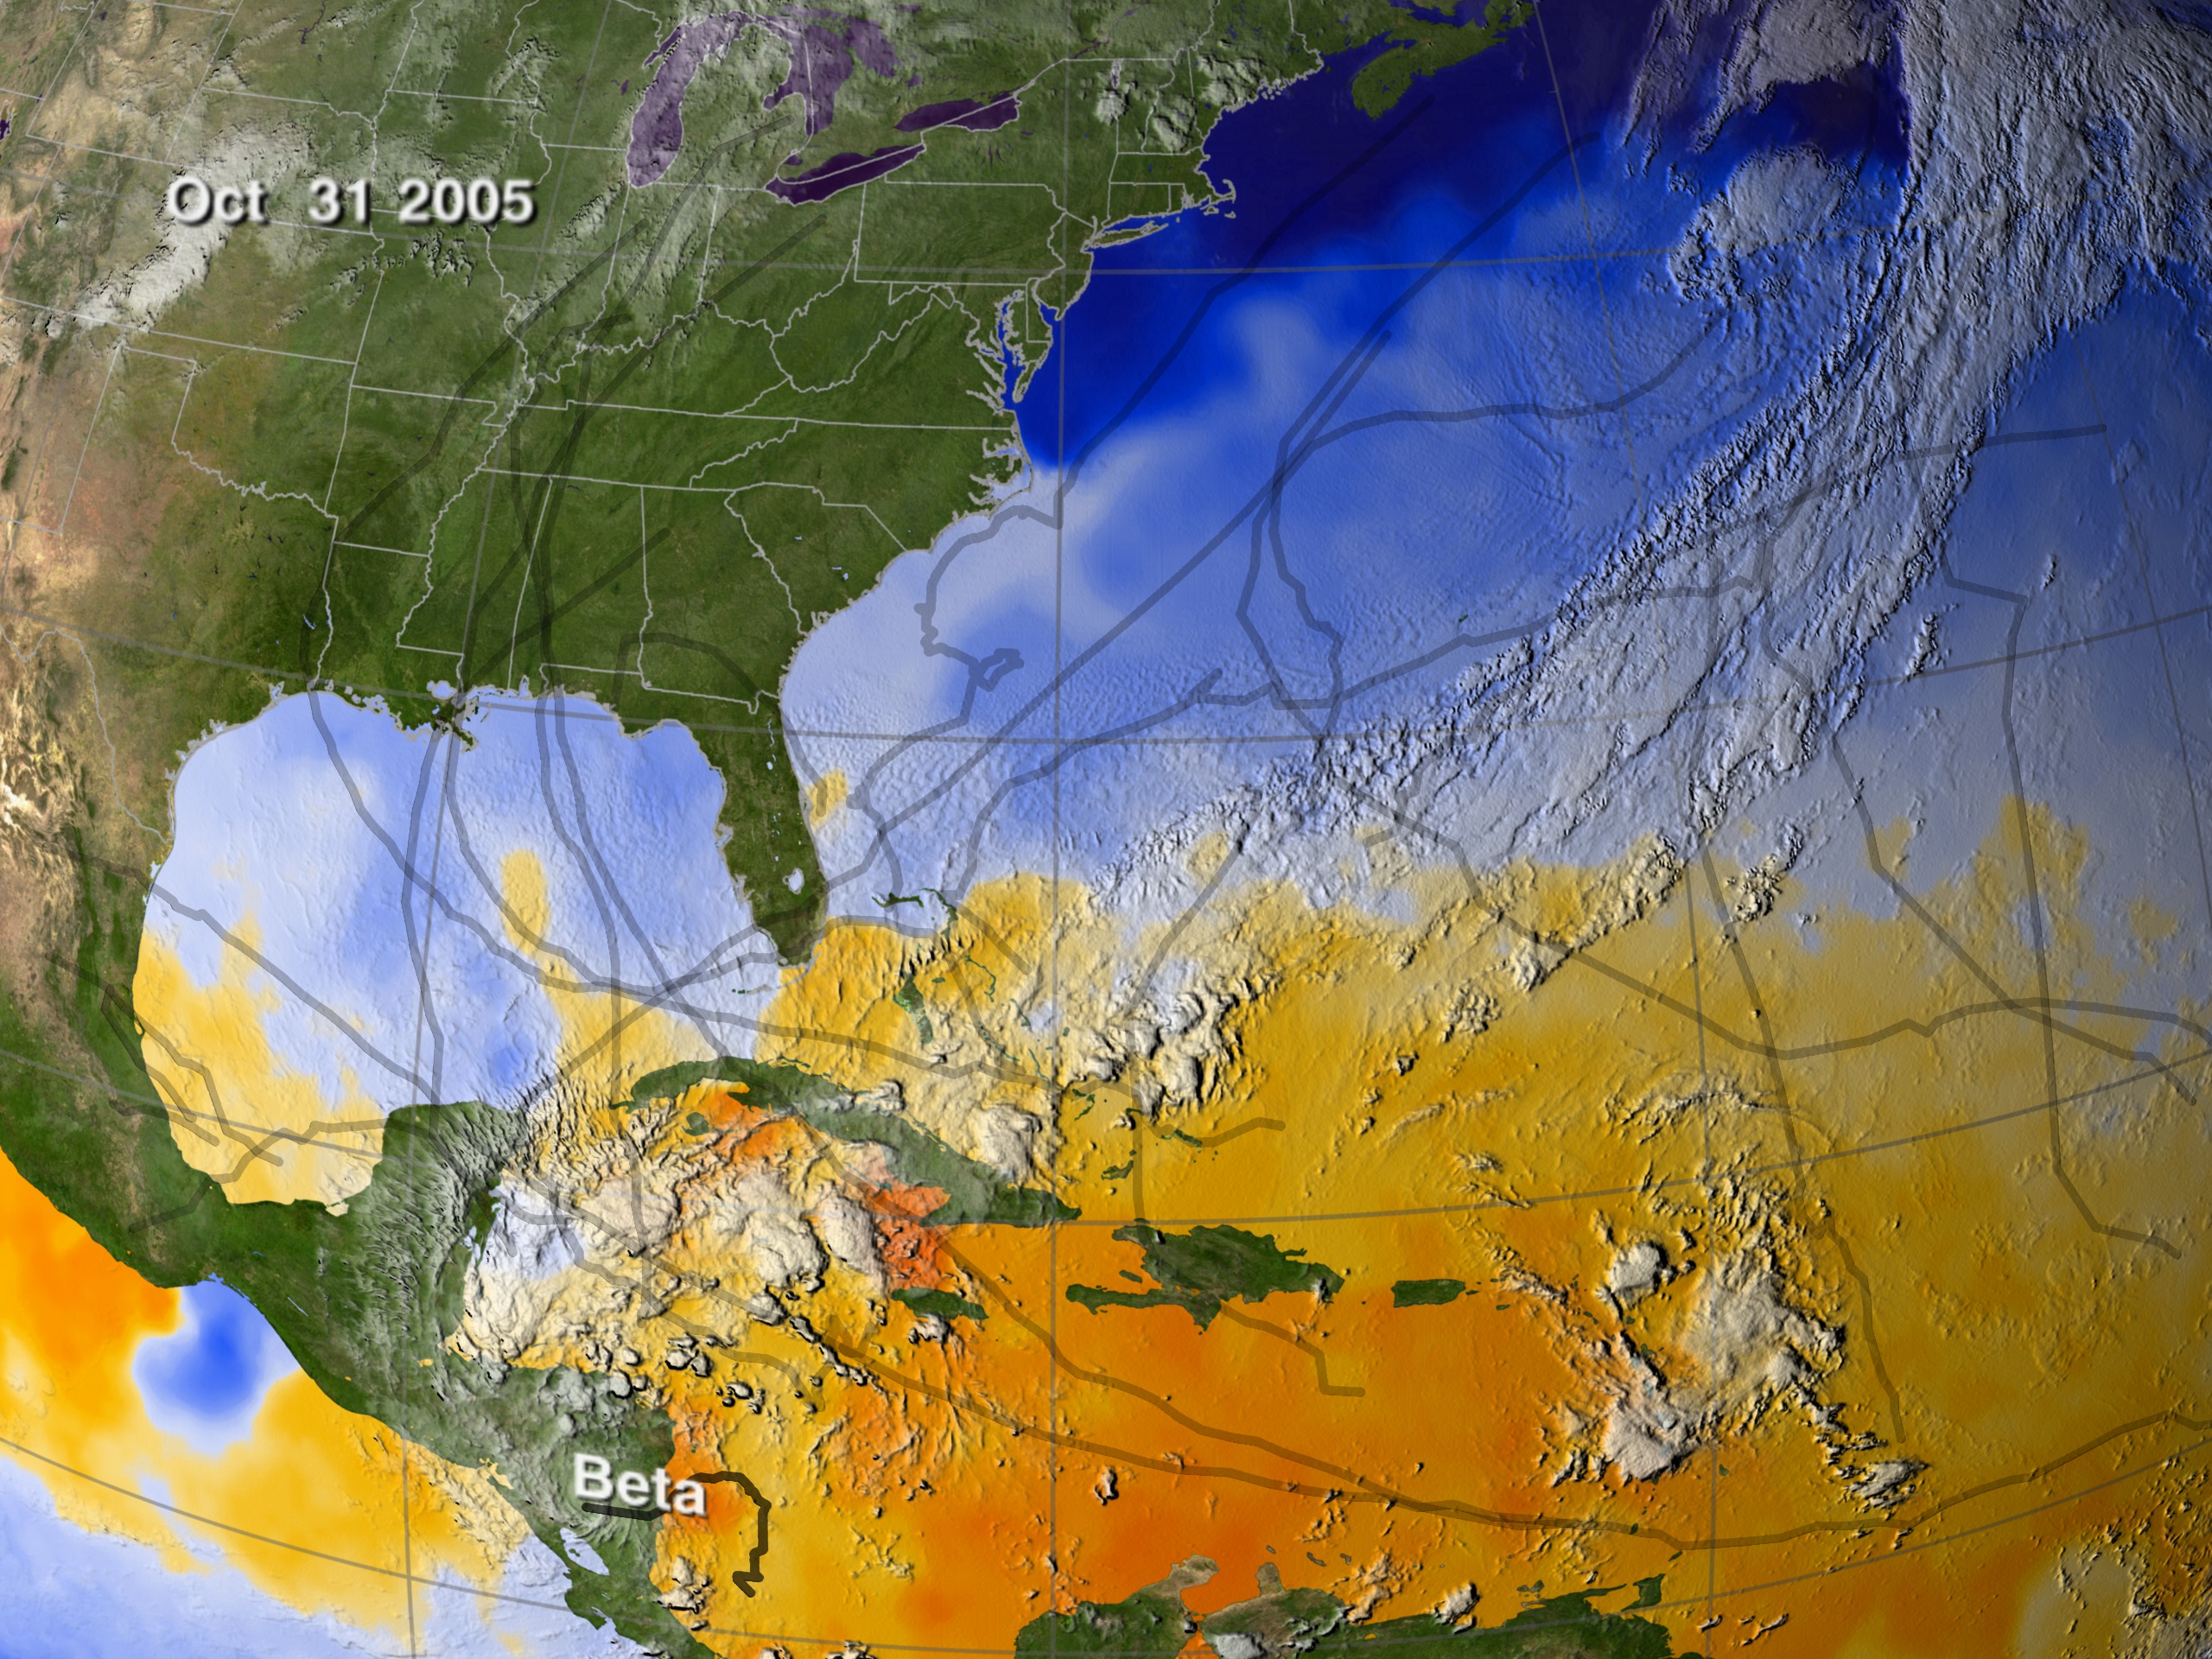
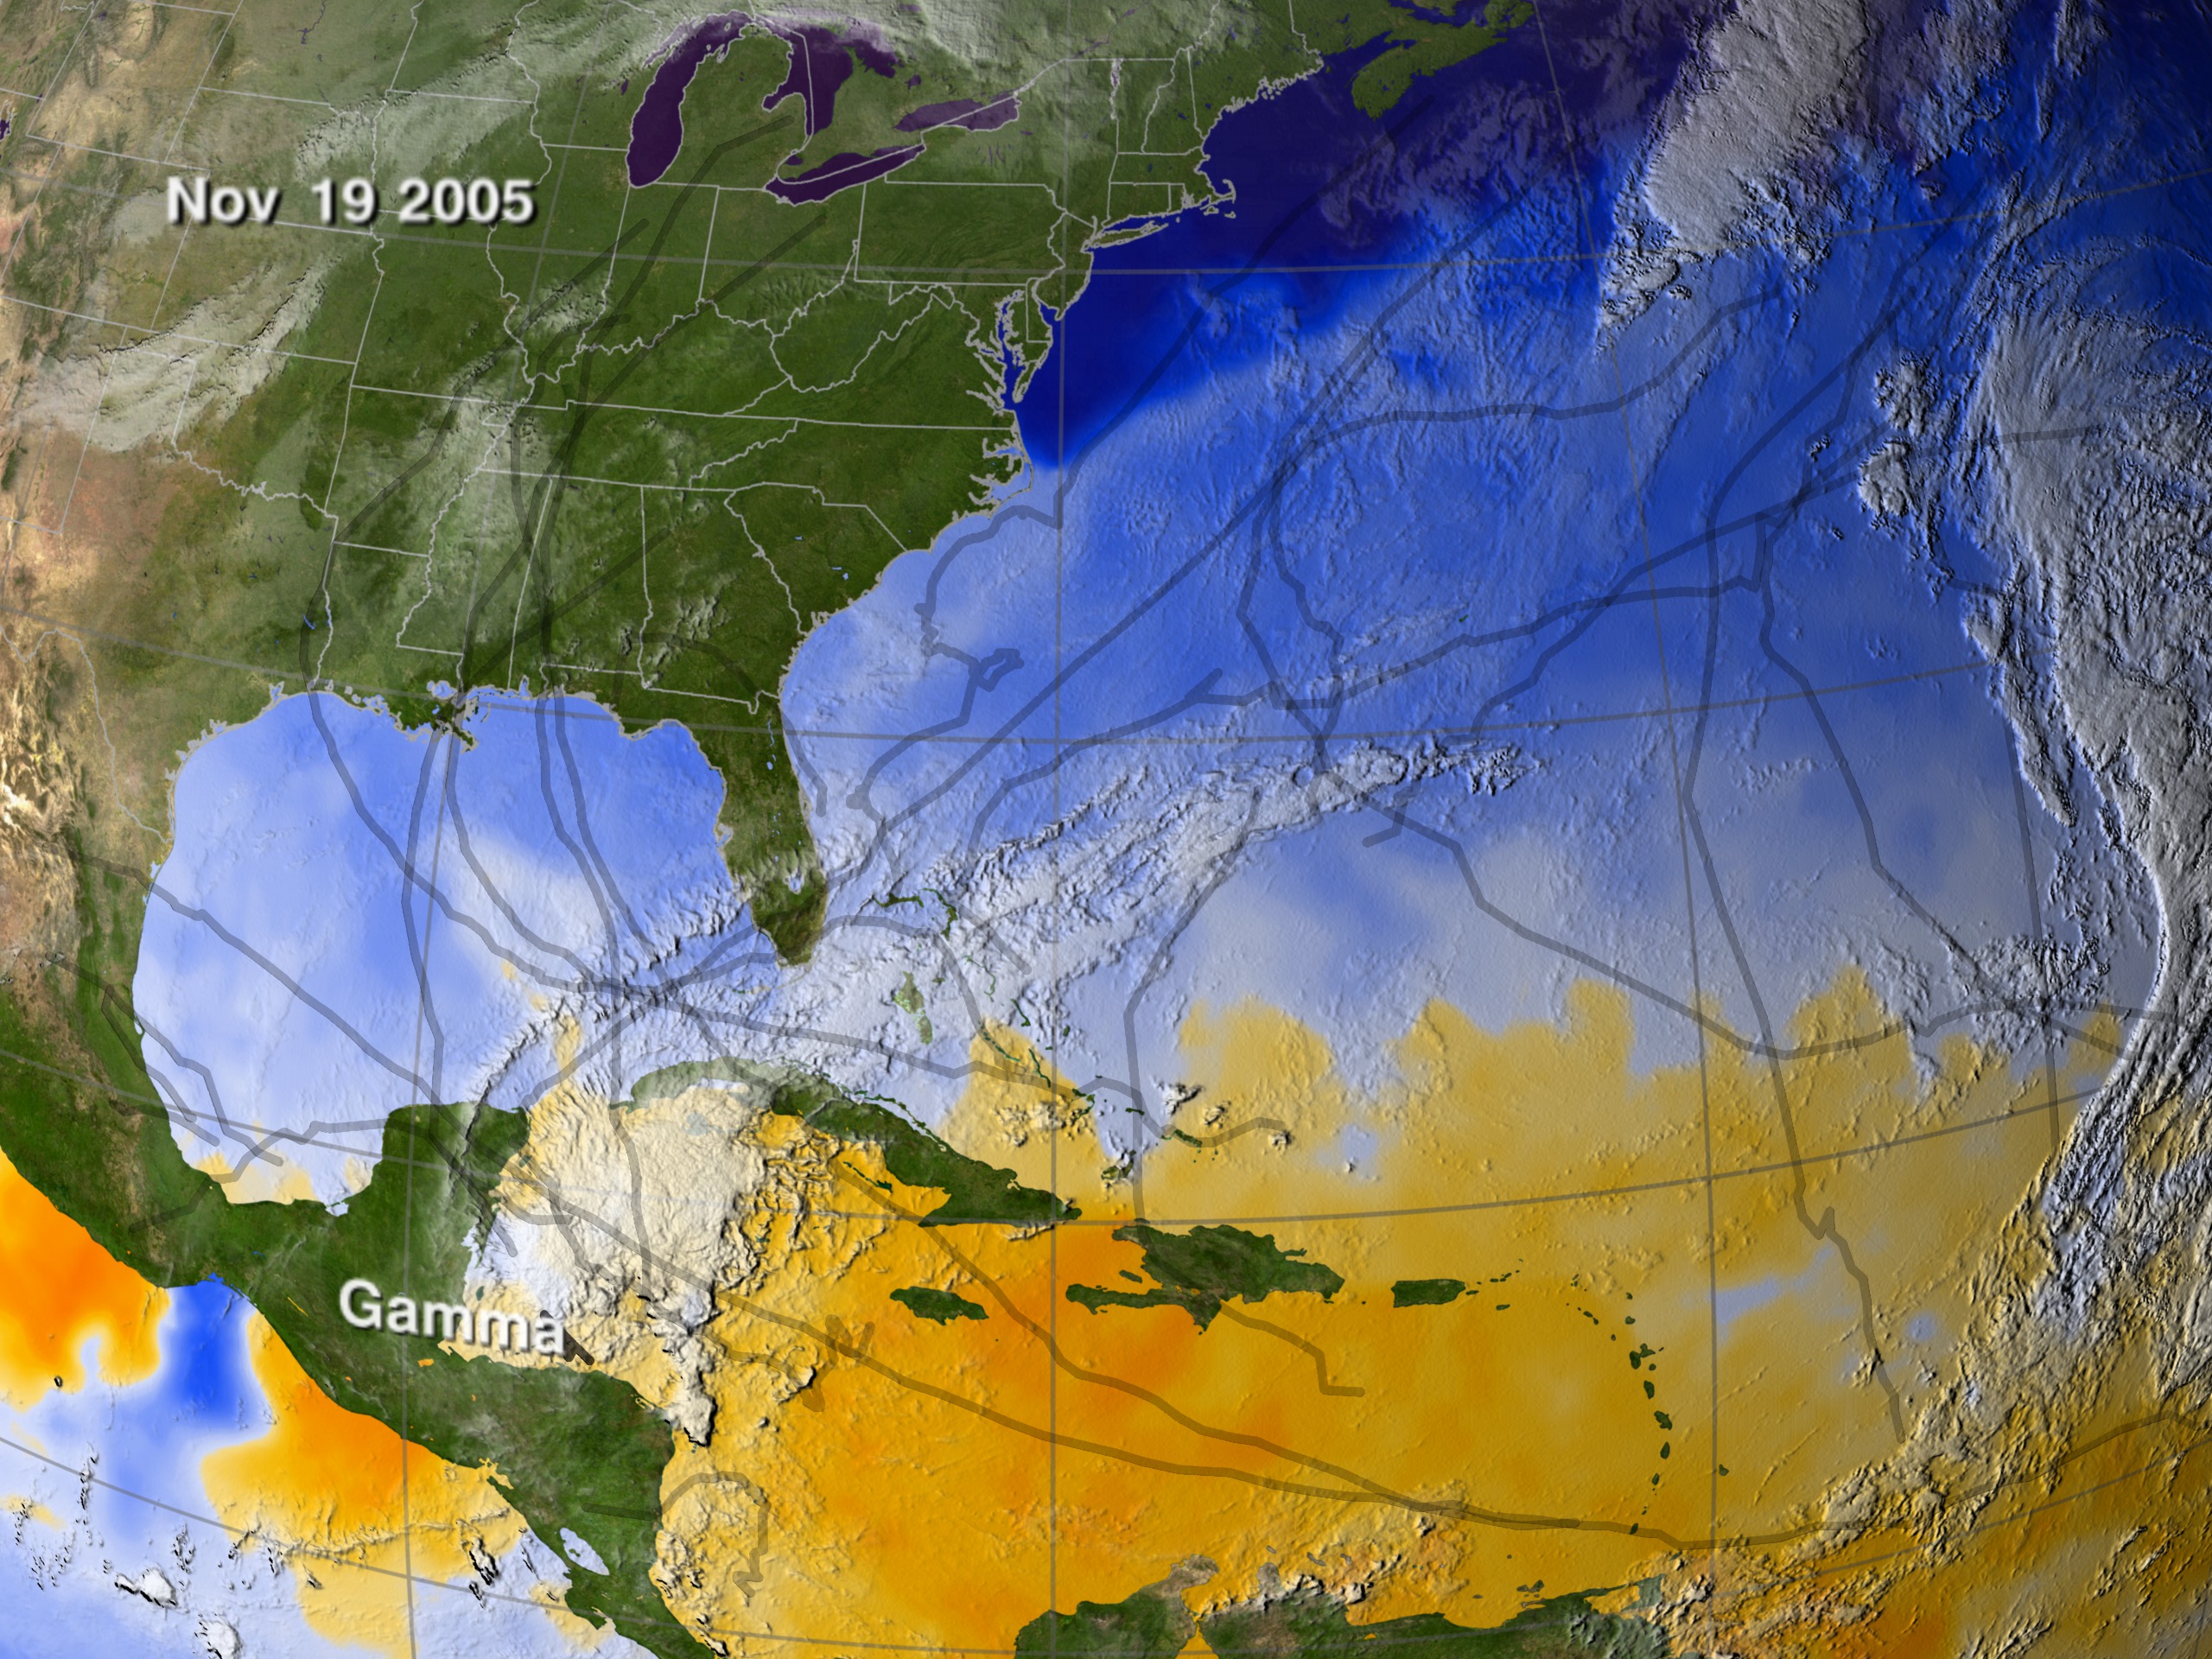
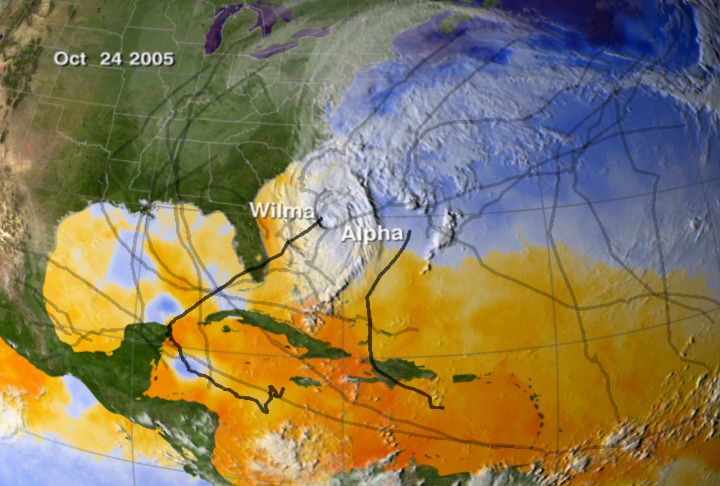
This visualization shows sea surface temperatures during most of the 2005 hurricane season. Overlaid are infrared cloud data, storm track data, and storm name labels. Ocean temperatures are the fuel that drive hurricanes. Notice the correspondence between the storm tracks and the sea surface temperature response; this is particulary noticeable for hurricanes Dennis, Emily, and Katrina. This versions shows a wide view of the Gulf of Mexico and Western Atlantic Ocean.
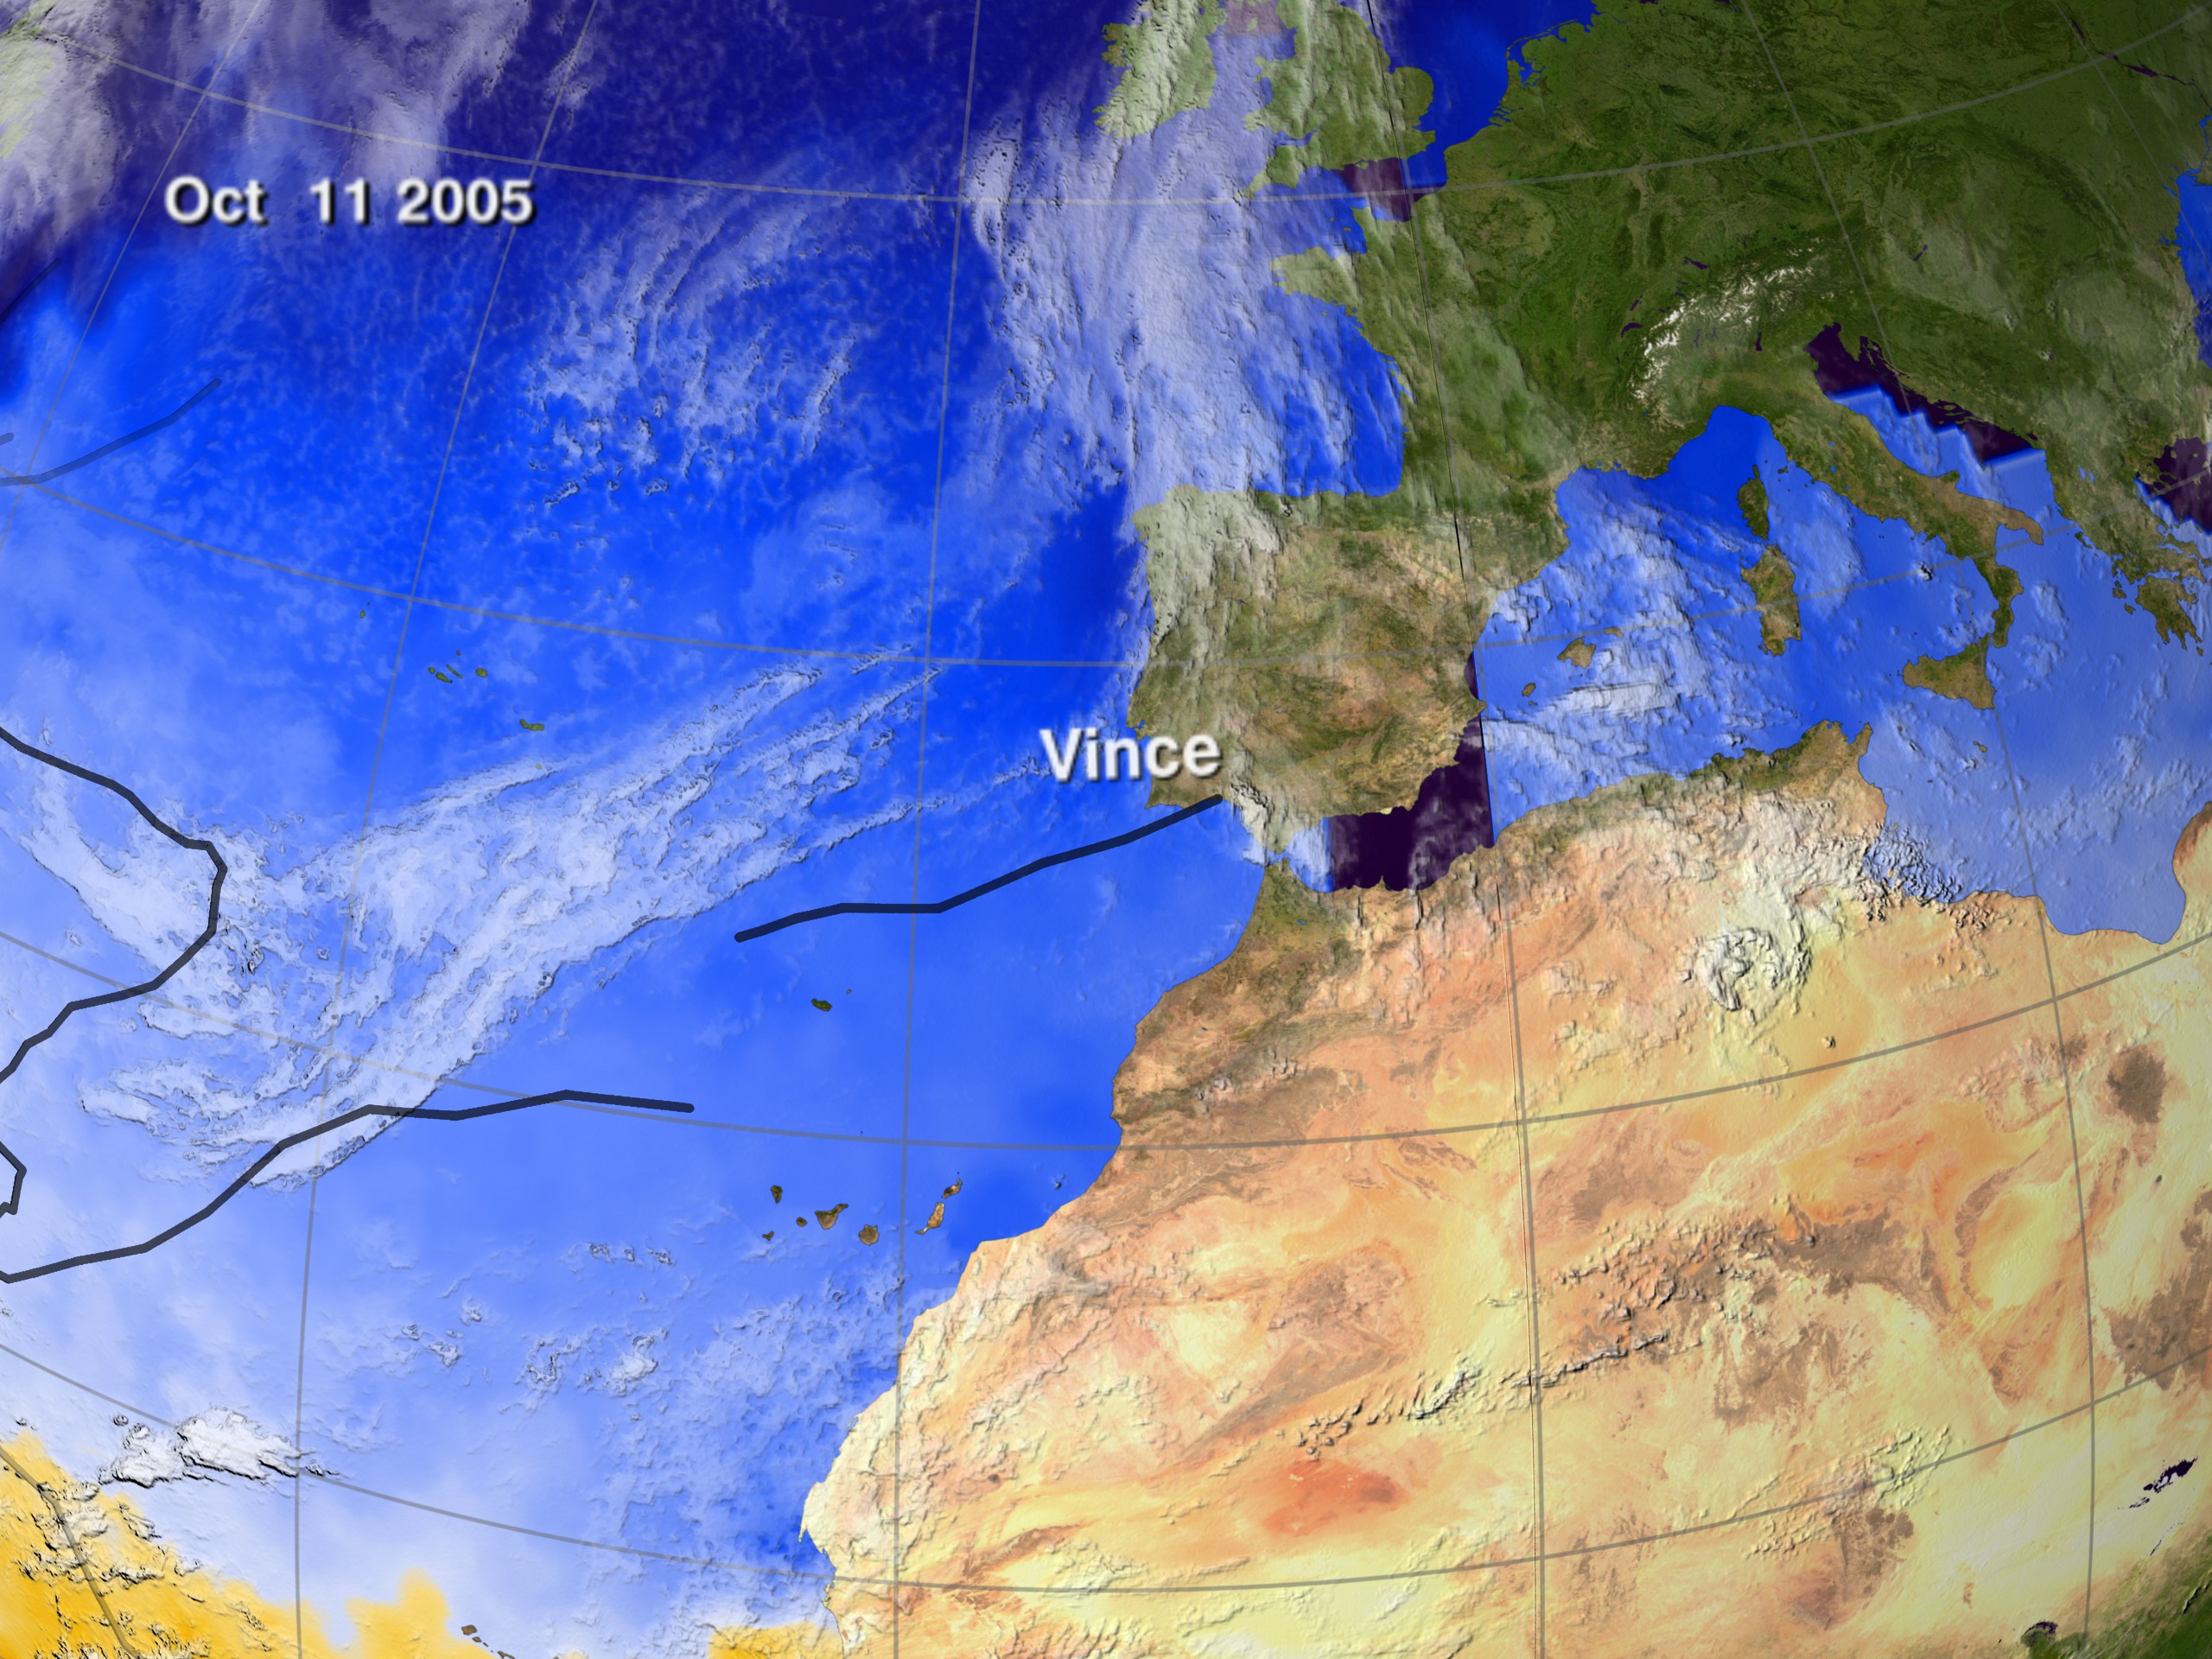
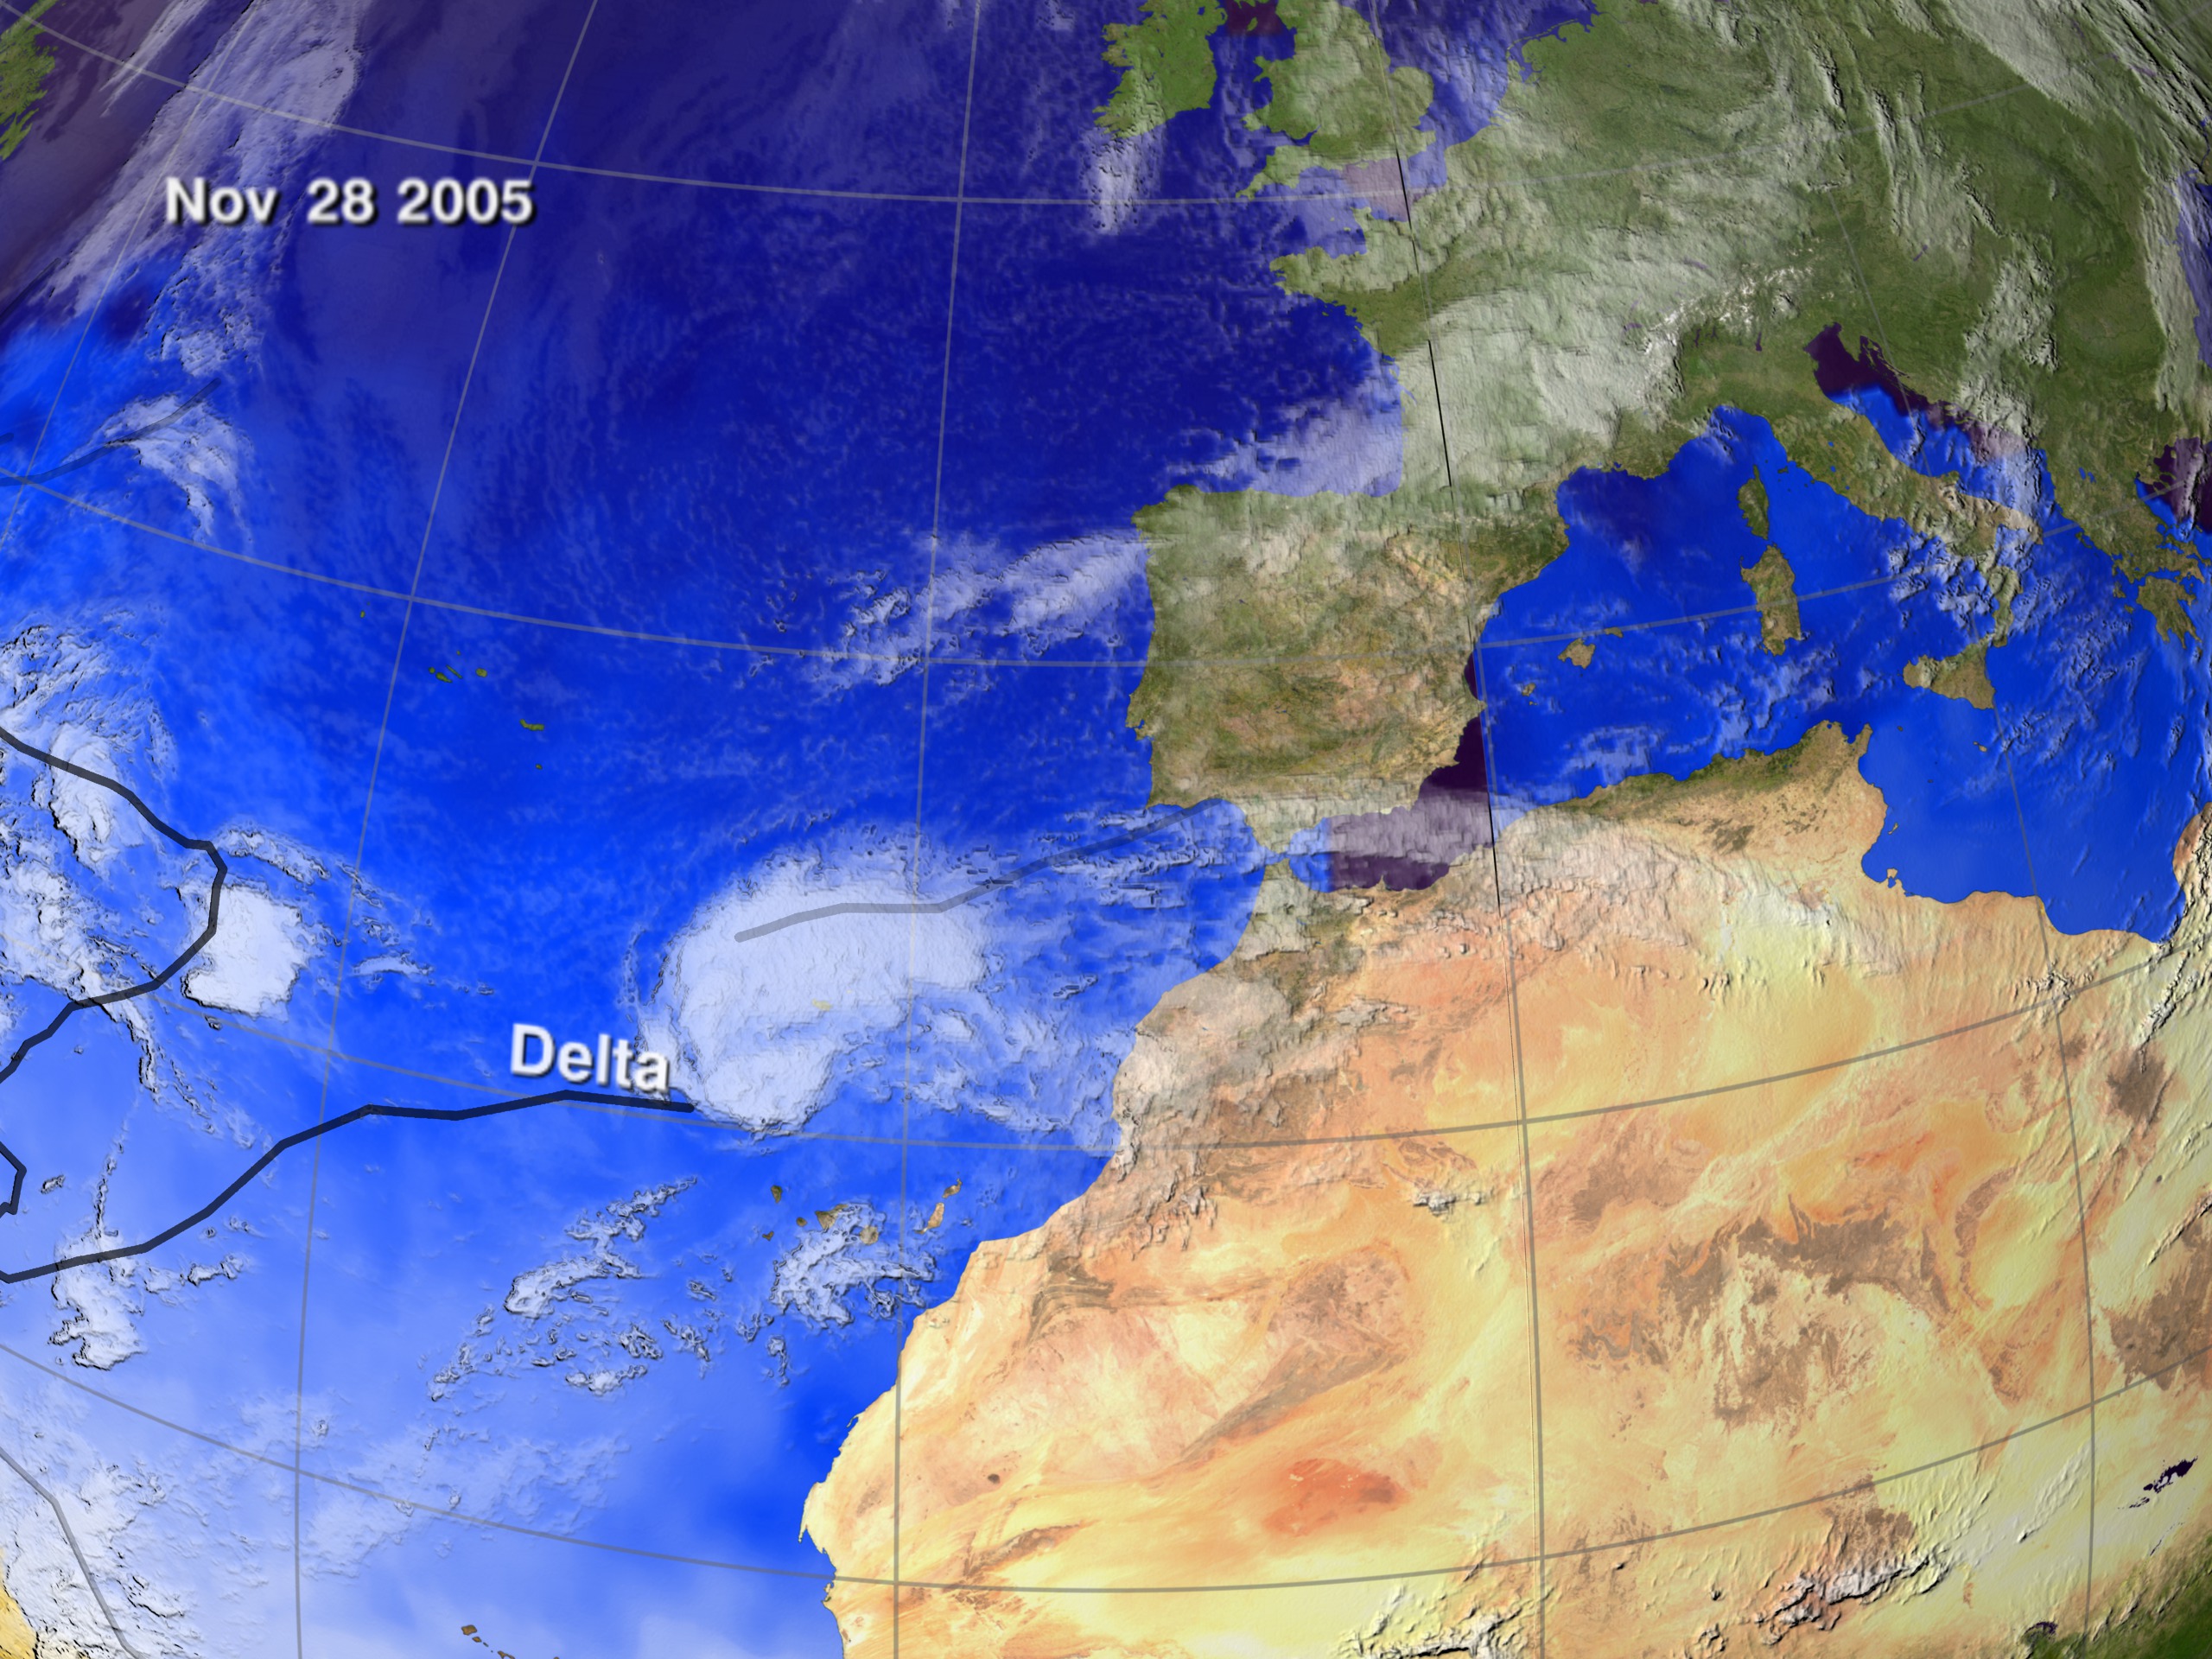
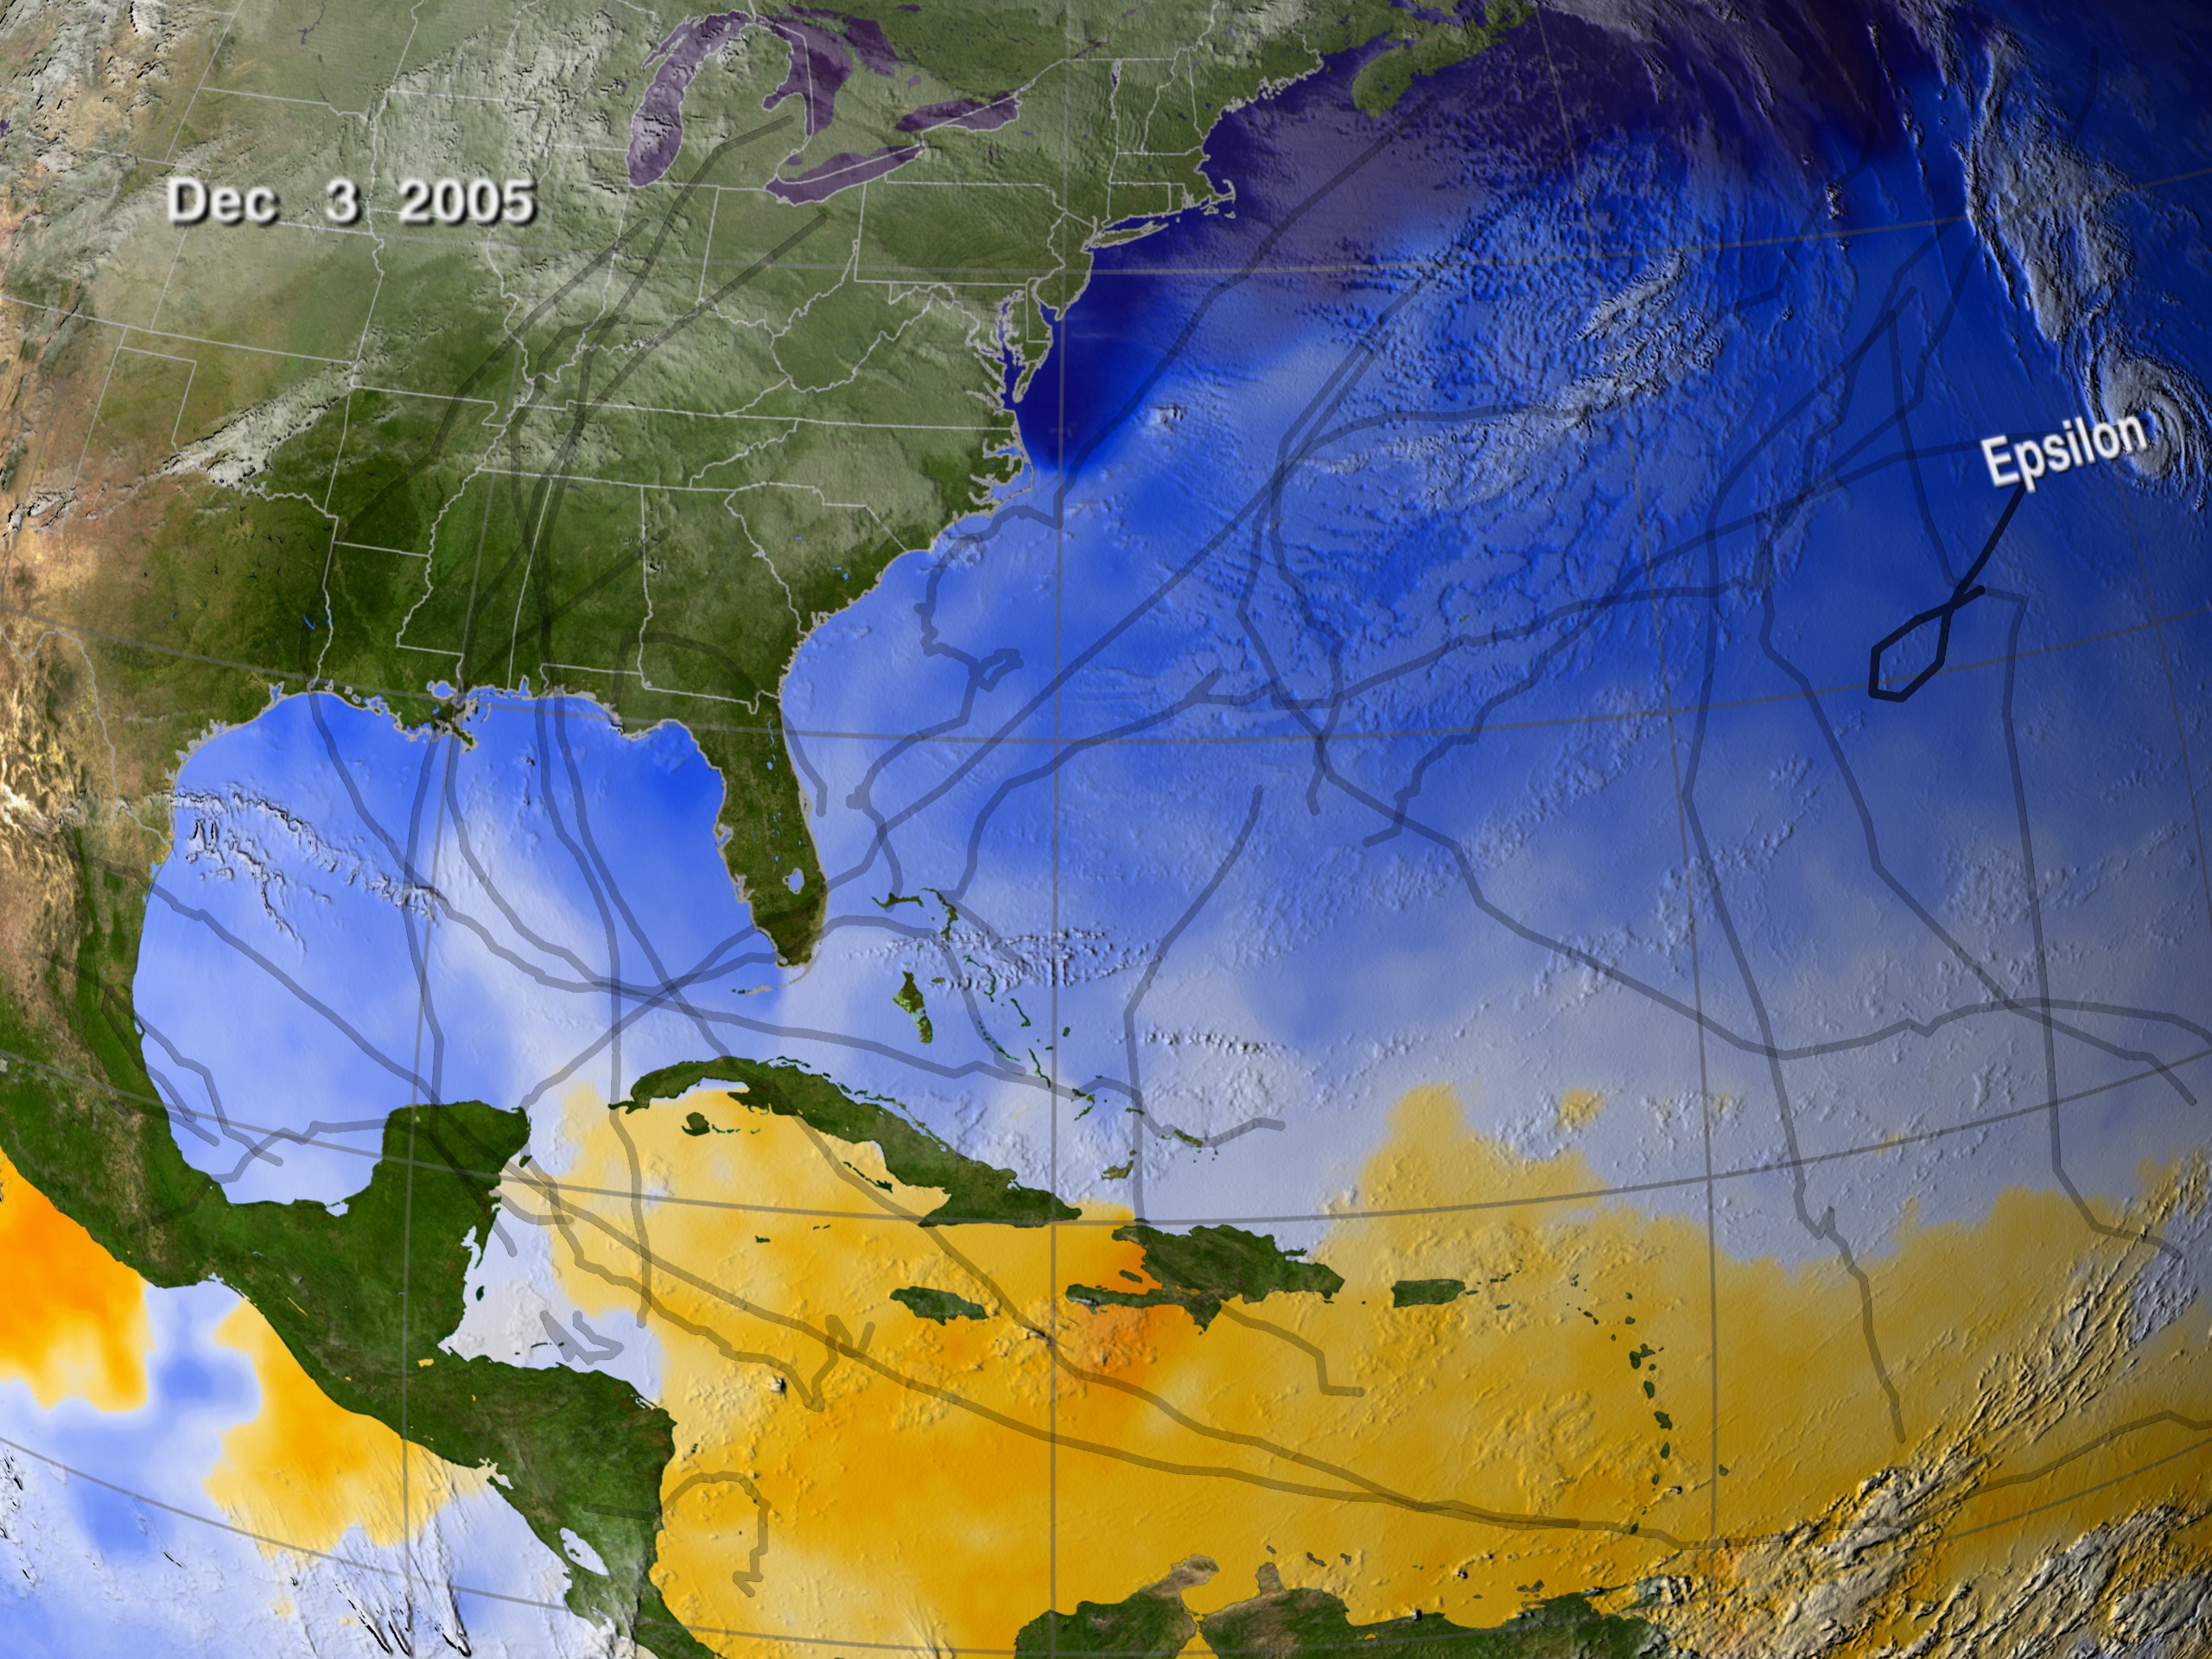
This visualization includes all of the named storms from Arlene though Wilma; however, Vince is not within the camera's view since it was in the Portugal/Spain region. Wilma tied the record for the most named Atlantic tropical storms in recorded history; and, the list of seleced names for this season is exhausted. Other storms that have formed after Wilma, have been named after the Greek alphabet.


Visualization Credits
Alex Kekesi (Global Science and Technology, Inc.): Animator
Lori Perkins (NASA/GSFC): Animator
Horace Mitchell (NASA/GSFC): Animator
J. Marshall Shepherd (NASA/GSFC): Scientist
Jeff Halverson (JCET UMBC): Scientist
NASA/Goddard Space Flight Center Scientific Visualization Studio
https://svs.gsfc.nasa.gov/3279
Mission:
Terra
Data Used:
GOES-12/Imager/Infrared
2005/06/01 - 2005/11/01Terra/MODIS/Blue Marble
The Blue Marble data is courtesy of Reto Stockli (NASA/GSFC).
Hurricane/Tropical Data
Database - Unisys - 2005/06/01 - 2005/11/01Aqua/AMSR-E/Sea Surface Temperature
2005/06/01 - 2005/11/01Aqua/MODIS/Blue Marble
The Blue Marble data is courtesy of Reto Stockli (NASA/GSFC).
Keywords:
DLESE >> Agricultural science
GCMD >> Earth Science >> Atmosphere >> Atmospheric Phenomena >> Hurricanes
GCMD >> Earth Science >> Oceans >> Ocean Temperature >> Sea Surface Temperature
SVS >> GOES
NASA Science >> Earth
GCMD keywords can be found on the Internet with the following citation: Olsen, L.M., G. Major, K. Shein, J. Scialdone, S. Ritz, T. Stevens, M. Morahan, A. Aleman, R. Vogel, S. Leicester, H. Weir, M. Meaux, S. Grebas, C.Solomon, M. Holland, T. Northcutt, R. A. Restrepo, R. Bilodeau, 2013. NASA/Global Change Master Directory (GCMD) Earth Science Keywords. Version 8.0.0.0.0


