Earth
ID: 3226
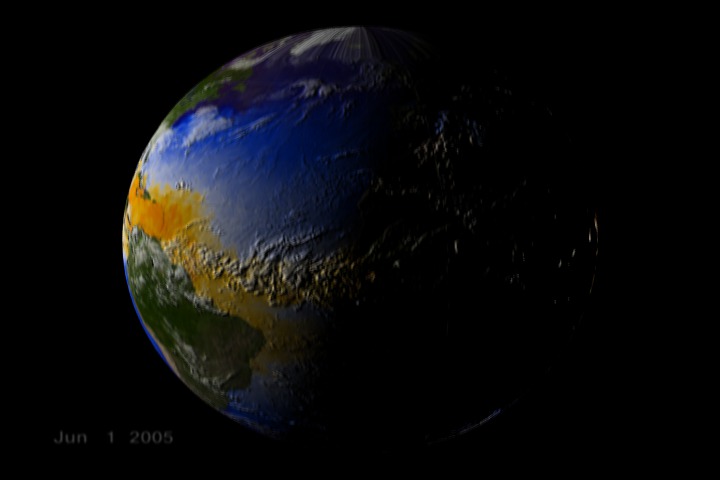
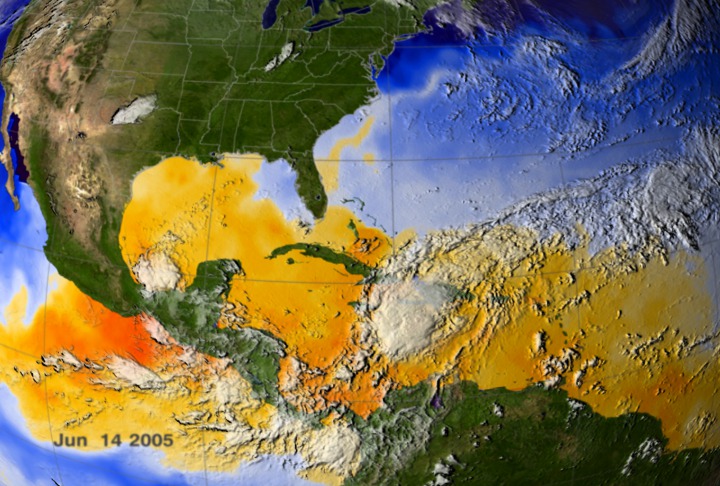
This visualization shows sea surface temperatures during the early part of the 2005 hurricane season. Overlaid are infrared cloud data and storm track data. Ocean temperatures are the fuel that drive hurricanes. Notice the correspondence between the storm tracks and the sea surface temperature response; this is particulary noticeable for hurricanes Dennis, Emily, and Katrina.


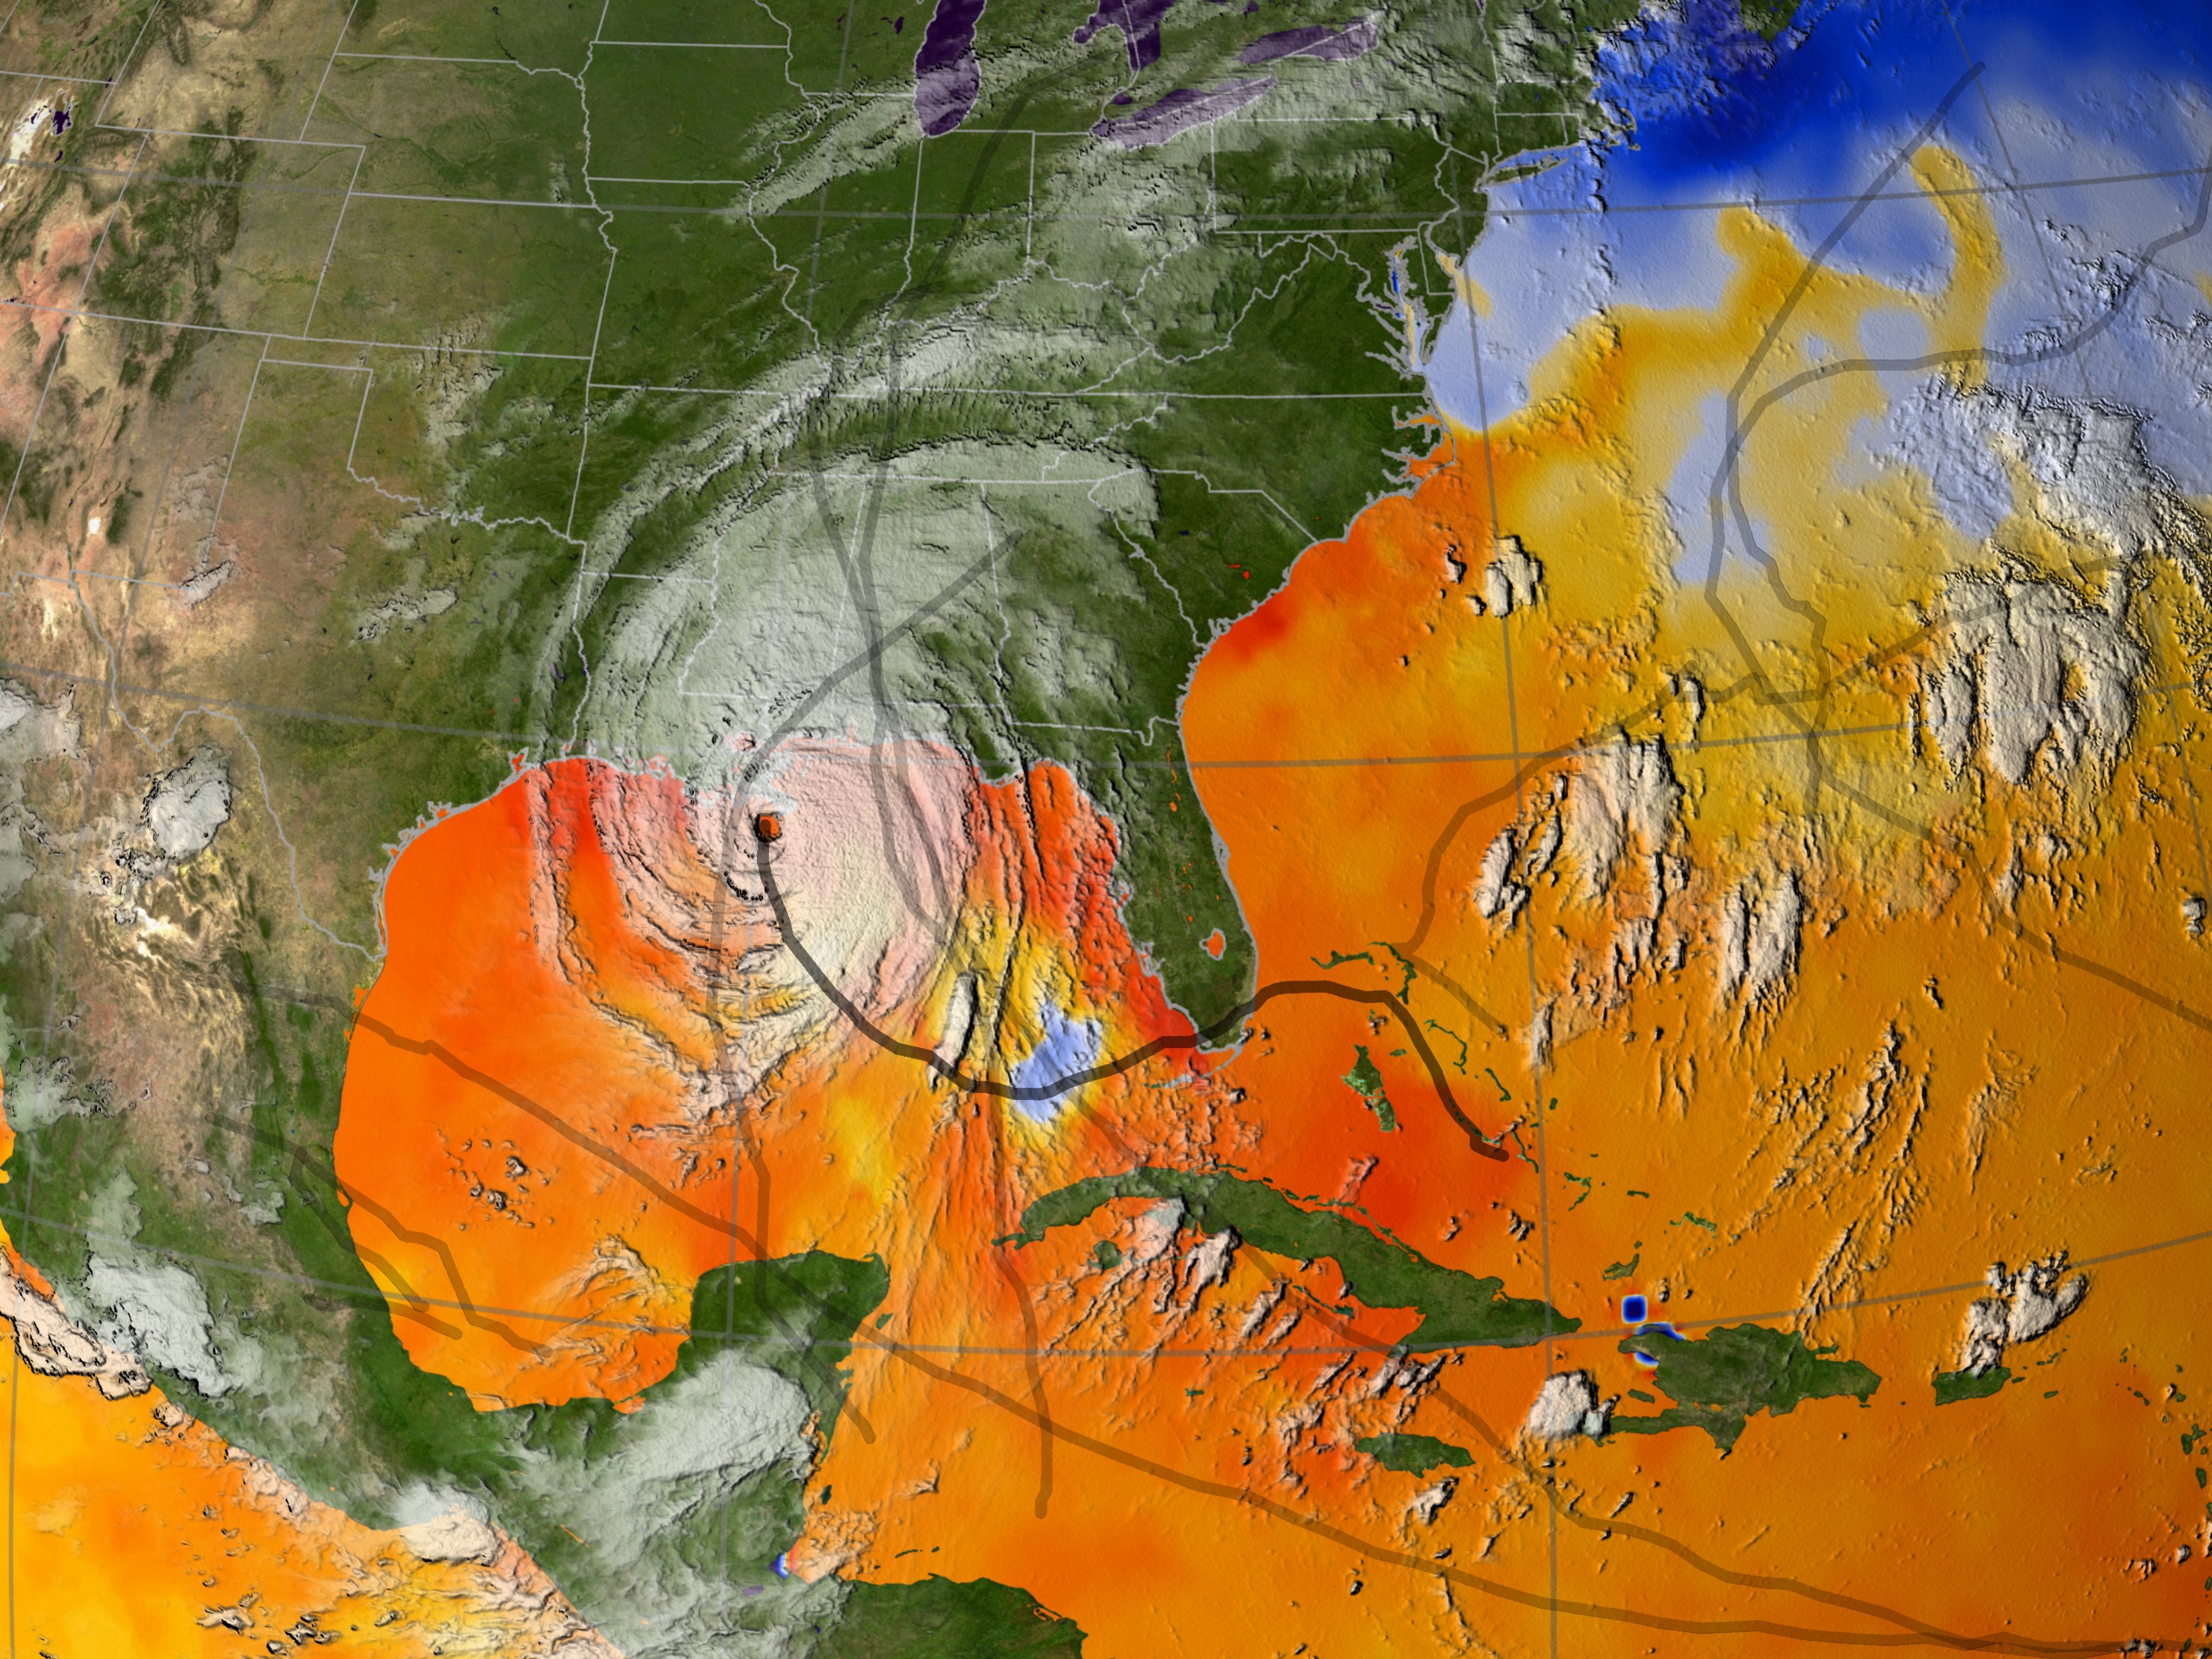
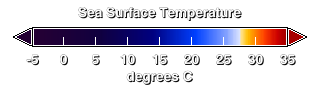
Sea Surface Temperature, Clouds, and Tropical Depression/Storm/Hurricane Tracks from June 1, 2005 to August 29, 2005
Visualization Credits
Greg Shirah (NASA/GSFC): Lead Animator
Alex Kekesi (Global Science and Technology, Inc.): Animator
Lori Perkins (NASA/GSFC): Animator
J. Marshall Shepherd (NASA/GSFC): Scientist
Jeff Halverson (JCET UMBC): Scientist
Alex Kekesi (Global Science and Technology, Inc.): Animator
Lori Perkins (NASA/GSFC): Animator
J. Marshall Shepherd (NASA/GSFC): Scientist
Jeff Halverson (JCET UMBC): Scientist
Please give credit for this item to:
NASA/Goddard Space Flight Center Scientific Visualization Studio
NASA/Goddard Space Flight Center Scientific Visualization Studio
Short URL to share this page:
https://svs.gsfc.nasa.gov/3226
Mission:
Terra
Data Used:
Note: While we identify the data sets used in these visualizations, we do not store any further details nor the data sets themselves on our site.
This item is part of this series:
Hurricane Katrina
Keywords:
DLESE >> Agricultural science
SVS >> HDTV
GCMD >> Earth Science >> Atmosphere >> Atmospheric Phenomena >> Hurricanes
GCMD >> Earth Science >> Oceans >> Ocean Temperature >> Sea Surface Temperature
SVS >> GOES
NASA Science >> Earth
GCMD keywords can be found on the Internet with the following citation: Olsen, L.M., G. Major, K. Shein, J. Scialdone, S. Ritz, T. Stevens, M. Morahan, A. Aleman, R. Vogel, S. Leicester, H. Weir, M. Meaux, S. Grebas, C.Solomon, M. Holland, T. Northcutt, R. A. Restrepo, R. Bilodeau, 2013. NASA/Global Change Master Directory (GCMD) Earth Science Keywords. Version 8.0.0.0.0
https://svs.gsfc.nasa.gov/3226
Mission:
Terra
Data Used:
GOES/IR4
2005/06/01 - 2005/08/29Aqua/MODIS/Blue Marble
Credit:
The Blue Marble data is courtesy of Reto Stockli (NASA/GSFC).
The Blue Marble data is courtesy of Reto Stockli (NASA/GSFC).
Hurricane/Tropical Data
Database - Unisys - 2005/06/01 - 2005/08/29Terra/MODIS/Blue Marble
Credit:
The Blue Marble data is courtesy of Reto Stockli (NASA/GSFC).
The Blue Marble data is courtesy of Reto Stockli (NASA/GSFC).
This item is part of this series:
Hurricane Katrina
Keywords:
DLESE >> Agricultural science
SVS >> HDTV
GCMD >> Earth Science >> Atmosphere >> Atmospheric Phenomena >> Hurricanes
GCMD >> Earth Science >> Oceans >> Ocean Temperature >> Sea Surface Temperature
SVS >> GOES
NASA Science >> Earth
GCMD keywords can be found on the Internet with the following citation: Olsen, L.M., G. Major, K. Shein, J. Scialdone, S. Ritz, T. Stevens, M. Morahan, A. Aleman, R. Vogel, S. Leicester, H. Weir, M. Meaux, S. Grebas, C.Solomon, M. Holland, T. Northcutt, R. A. Restrepo, R. Bilodeau, 2013. NASA/Global Change Master Directory (GCMD) Earth Science Keywords. Version 8.0.0.0.0


