Earth
ID: 3204
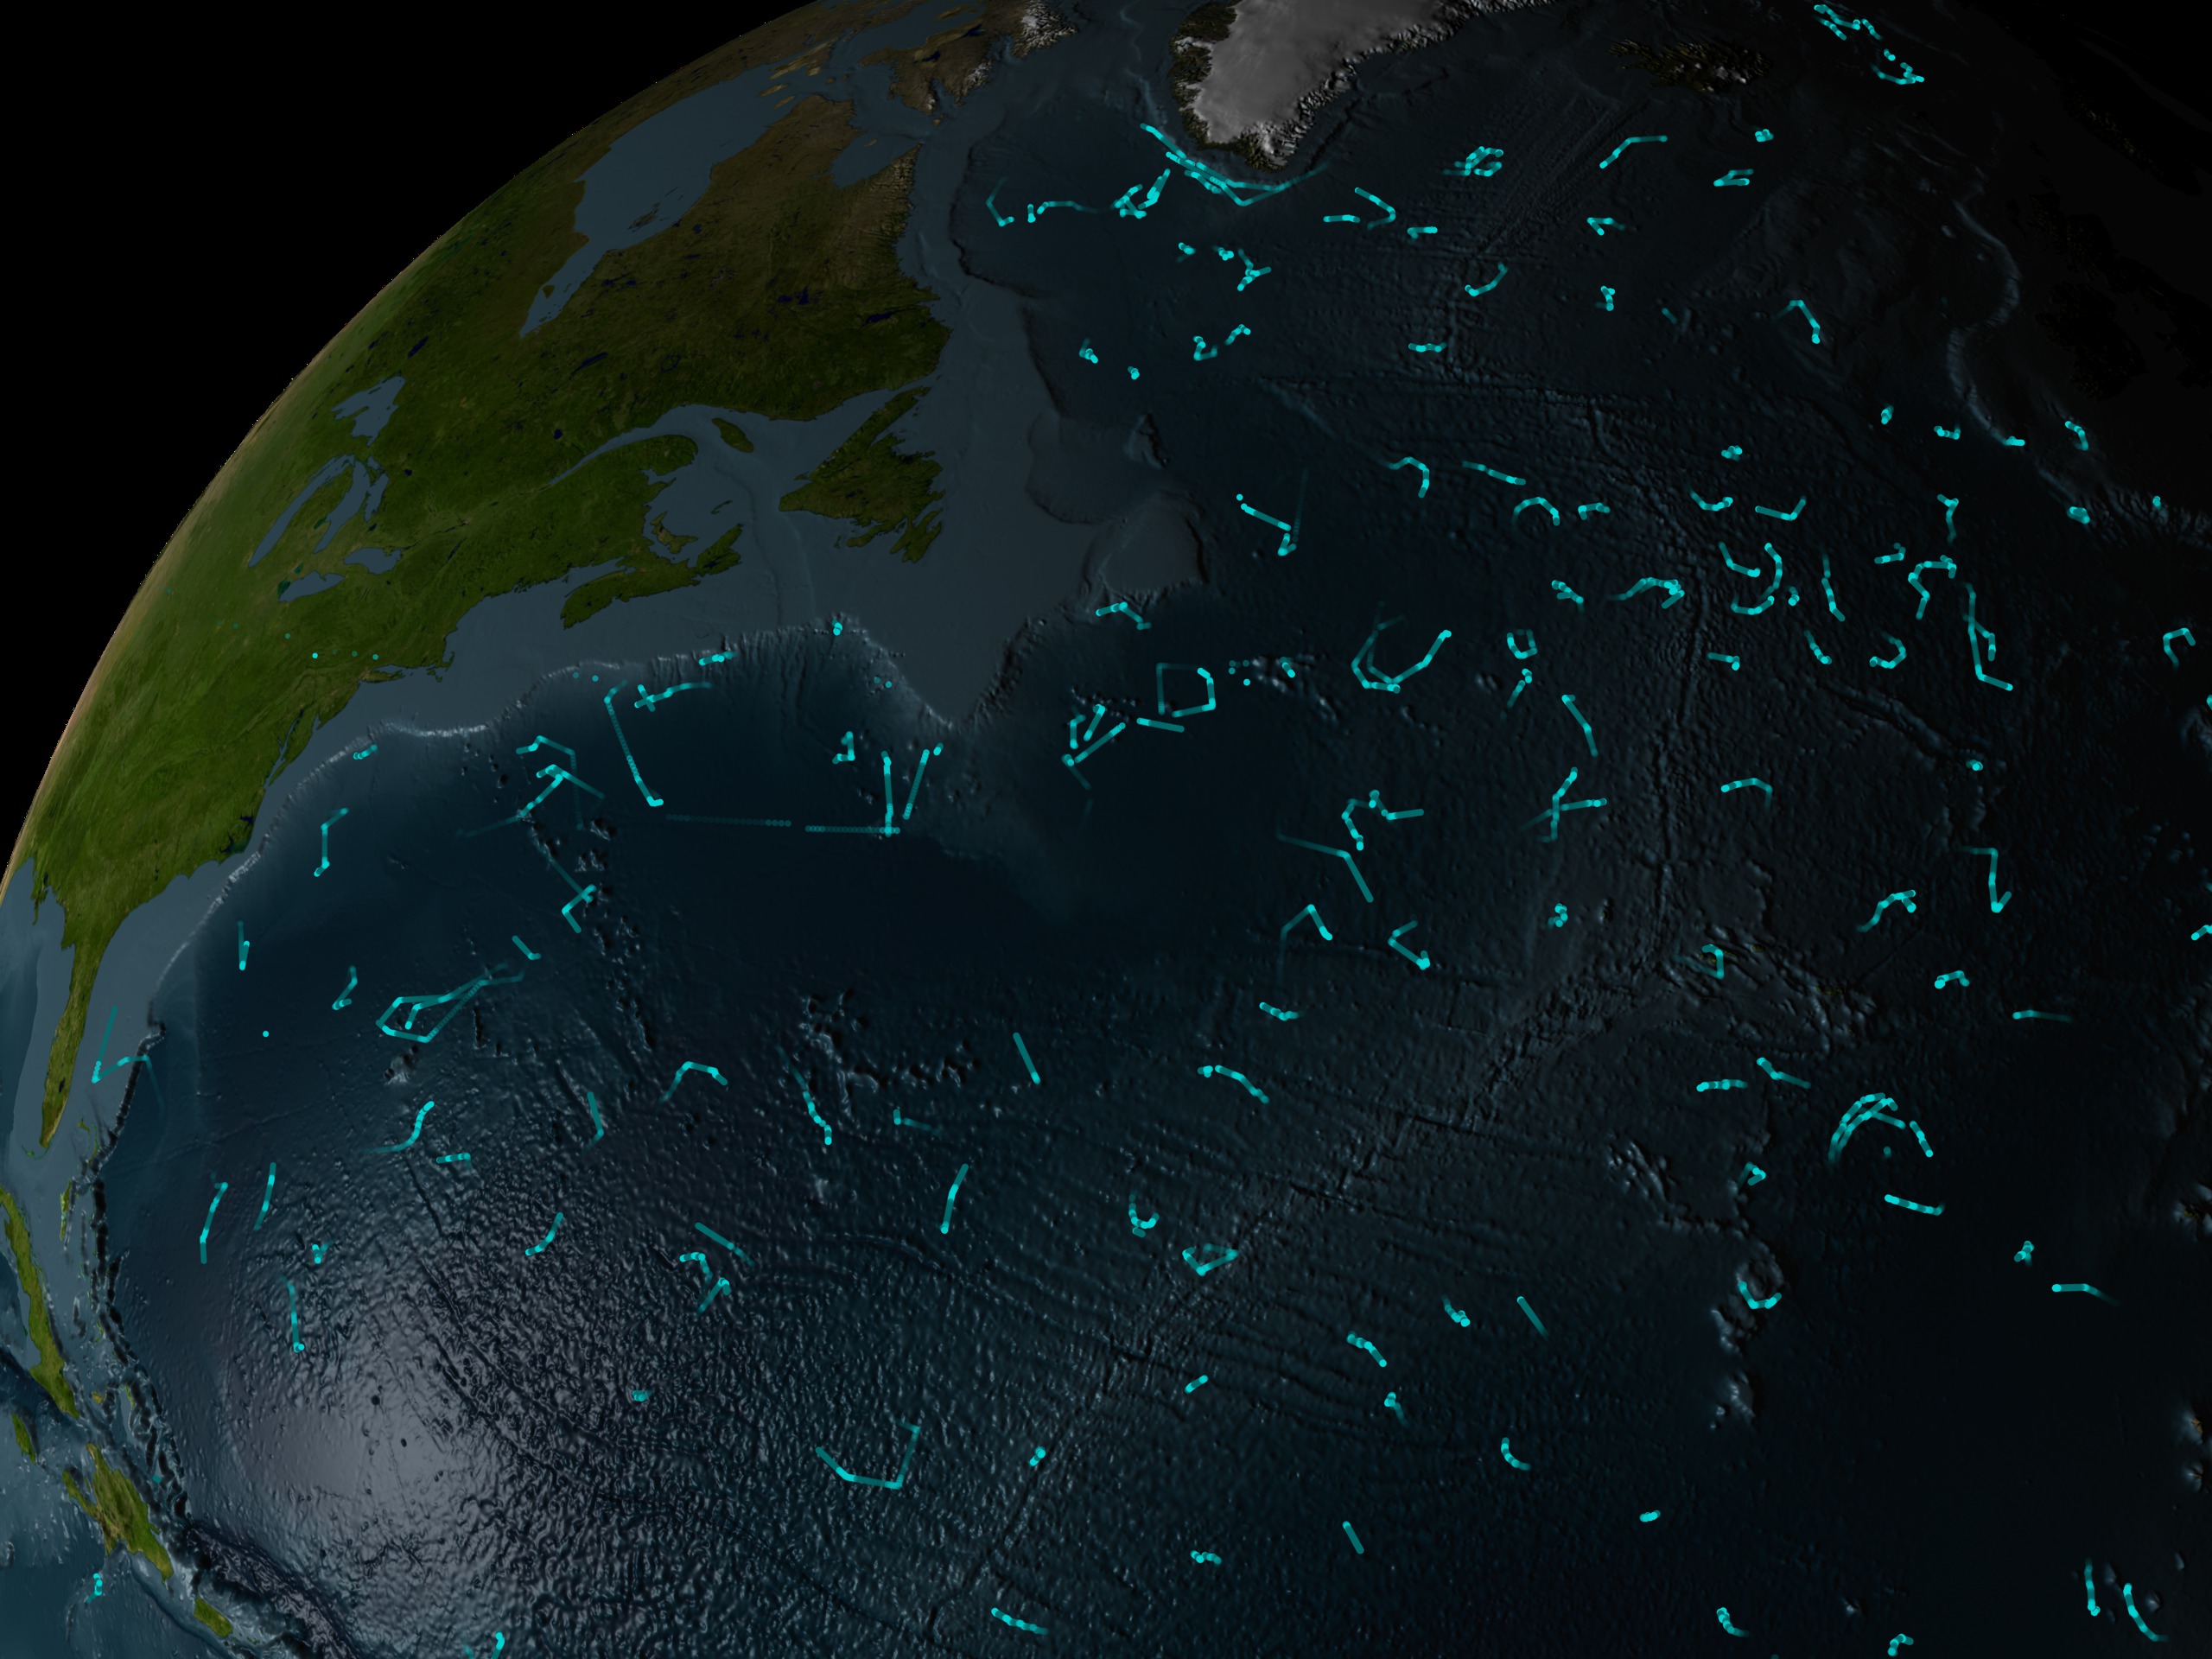
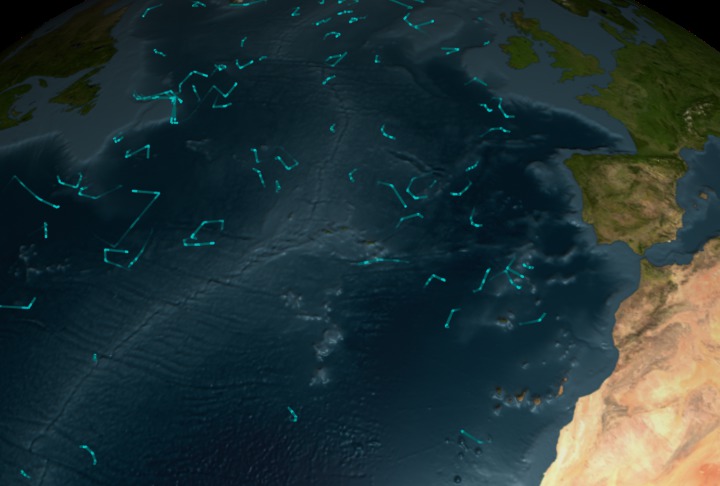
This visualization shows the locations of the ARGO buoy array over time. When the buoys are above water, the lines are brighter; when the buoys are under water, the lines are fainter. The ARGO buoys measure ocean salinity, column temperature, and current velocities. This version of the visualization uses a slow camera move.
ARGO Float Animation #1
For More Information
Visualization Credits
Please give credit for this item to:
NASA/Goddard Space Flight Center Scientific Visualization Studio
NASA/Goddard Space Flight Center Scientific Visualization Studio
Short URL to share this page:
https://svs.gsfc.nasa.gov/3204
Data Used:
Note: While we identify the data sets used in these visualizations, we do not store any further details nor the data sets themselves on our site.
This item is part of this series:
Sea Level NSU
Keywords:
GCMD >> Earth Science >> Oceans >> Ocean Circulation
GCMD >> Earth Science >> Oceans >> Ocean Temperature
GCMD >> Earth Science >> Oceans >> Salinity/Density
NASA Science >> Earth
GCMD keywords can be found on the Internet with the following citation: Olsen, L.M., G. Major, K. Shein, J. Scialdone, S. Ritz, T. Stevens, M. Morahan, A. Aleman, R. Vogel, S. Leicester, H. Weir, M. Meaux, S. Grebas, C.Solomon, M. Holland, T. Northcutt, R. A. Restrepo, R. Bilodeau, 2013. NASA/Global Change Master Directory (GCMD) Earth Science Keywords. Version 8.0.0.0.0
https://svs.gsfc.nasa.gov/3204
Data Used:
Argo Buoy Positions
UCSD - 2001/05/01 to 2005/05/10
The Argo array is part of the Global Climate Observing System/Global Ocean Observing System
This item is part of this series:
Sea Level NSU
Keywords:
GCMD >> Earth Science >> Oceans >> Ocean Circulation
GCMD >> Earth Science >> Oceans >> Ocean Temperature
GCMD >> Earth Science >> Oceans >> Salinity/Density
NASA Science >> Earth
GCMD keywords can be found on the Internet with the following citation: Olsen, L.M., G. Major, K. Shein, J. Scialdone, S. Ritz, T. Stevens, M. Morahan, A. Aleman, R. Vogel, S. Leicester, H. Weir, M. Meaux, S. Grebas, C.Solomon, M. Holland, T. Northcutt, R. A. Restrepo, R. Bilodeau, 2013. NASA/Global Change Master Directory (GCMD) Earth Science Keywords. Version 8.0.0.0.0


