Earth
ID: 3191
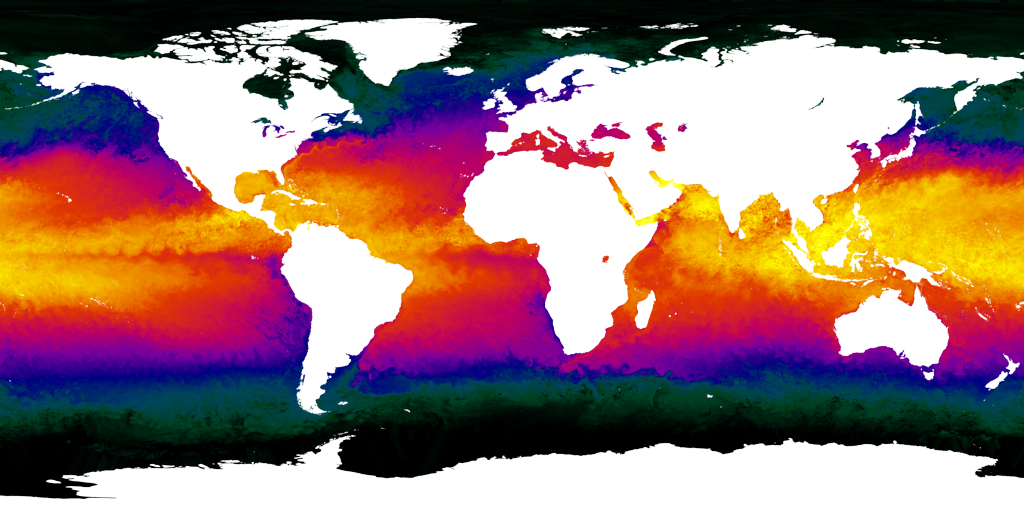
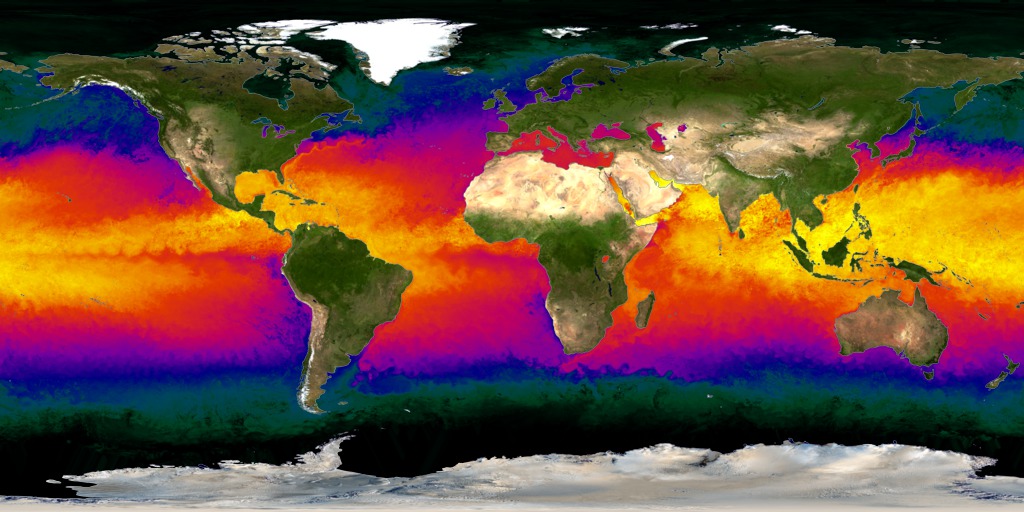
The temperature of the surface of the world's oceans provides a clear indication of the state of the Earth's climate and weather. In this visualization sequence covering the period from January to June, 2005, the most obvious effects are the north-south movement of warm regions across the equator due to the seasonal movement of the sun and the seasonal advance and retreat of the sea ice near the North and South poles. It is also possible to see the Gulf Stream, the warm river of water that parallels the east coast of the United States before heading towards northern Europe, in this data.
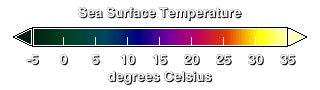
Sea Surface Temperature, 2005 (WMS)
Visualization Credits
Eric Sokolowsky (GST): Lead Animator
Frank J. Wentz (Remote Sensing Systems): Scientist
Chelle Gentemann (Remote Sensing Systems): Scientist
Frank J. Wentz (Remote Sensing Systems): Scientist
Chelle Gentemann (Remote Sensing Systems): Scientist
Please give credit for this item to:
NASA/Goddard Space Flight Center Scientific Visualization Studio
NASA/Goddard Space Flight Center Scientific Visualization Studio
Short URL to share this page:
https://svs.gsfc.nasa.gov/3191
Data Used:
Note: While we identify the data sets used in these visualizations, we do not store any further details nor the data sets themselves on our site.
This item is part of this series:
WMS
Keywords:
SVS >> HDTV
GCMD >> Earth Science >> Climate Indicators >> Teleconnections >> El Nino Southern Oscillation
GCMD >> Earth Science >> Oceans >> Ocean Temperature >> Sea Surface Temperature
GCMD >> Location >> Global Land
NASA Science >> Earth
GCMD keywords can be found on the Internet with the following citation: Olsen, L.M., G. Major, K. Shein, J. Scialdone, S. Ritz, T. Stevens, M. Morahan, A. Aleman, R. Vogel, S. Leicester, H. Weir, M. Meaux, S. Grebas, C.Solomon, M. Holland, T. Northcutt, R. A. Restrepo, R. Bilodeau, 2013. NASA/Global Change Master Directory (GCMD) Earth Science Keywords. Version 8.0.0.0.0
https://svs.gsfc.nasa.gov/3191
Data Used:
Aqua/AMSR-E
2005/01/01 - 2005/07/03
For more information, please click http://wwwghcc.msfc.nasa.gov/AMSR/
This item is part of this series:
WMS
Keywords:
SVS >> HDTV
GCMD >> Earth Science >> Climate Indicators >> Teleconnections >> El Nino Southern Oscillation
GCMD >> Earth Science >> Oceans >> Ocean Temperature >> Sea Surface Temperature
GCMD >> Location >> Global Land
NASA Science >> Earth
GCMD keywords can be found on the Internet with the following citation: Olsen, L.M., G. Major, K. Shein, J. Scialdone, S. Ritz, T. Stevens, M. Morahan, A. Aleman, R. Vogel, S. Leicester, H. Weir, M. Meaux, S. Grebas, C.Solomon, M. Holland, T. Northcutt, R. A. Restrepo, R. Bilodeau, 2013. NASA/Global Change Master Directory (GCMD) Earth Science Keywords. Version 8.0.0.0.0


