Earth
Sun
ID: 3170
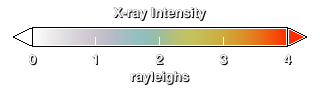
Here are X-rays images (shown on the same brightness scale) of the north polar region obtained by Chandra HRC-I on different days, showing large variability in soft (0.1-10.0 keV) X-ray emissions from Earth s aurora. Note that the images are not snap shots, but are approximately 20-min scans of the northern auroral region in the HRC-I field-of-view. The brightness scale in Rayleighs (R) assumes an average effective area of 40 cm2. The day-night terminator at an altitude of 0 km is displayed with lighting. The day-night terminator at an altitude of 100 km is shown by the blue line.
X-Ray Images of the North Polar Region (WMS)
Visualization Credits
Lori Perkins (NASA/GSFC): Lead Animator
Eric Sokolowsky (GST): Animator
Anil Bhardwaj (NASA/MSFC): Scientist
Ron Elsner (NASA/MSFC): Scientist
Randy Gladstone (SwRI): Scientist
Megan Watzke (Harvard): Scientist
Eric Sokolowsky (GST): Animator
Anil Bhardwaj (NASA/MSFC): Scientist
Ron Elsner (NASA/MSFC): Scientist
Randy Gladstone (SwRI): Scientist
Megan Watzke (Harvard): Scientist
Please give credit for this item to:
NASA/Goddard Space Flight Center Scientific Visualization Studio
NASA/Goddard Space Flight Center Scientific Visualization Studio
Short URL to share this page:
https://svs.gsfc.nasa.gov/3170
Data Used:
Note: While we identify the data sets used in these visualizations, we do not store any further details nor the data sets themselves on our site.
This item is part of this series:
WMS
Keywords:
GCMD >> Earth Science >> Atmosphere >> Atmospheric Radiation >> Atmospheric Emitted Radiation
GCMD >> Earth Science >> Sun-earth Interactions >> Ionosphere/Magnetosphere Particles >> Aurorae
NASA Science >> Earth
NASA Science >> Sun
GCMD keywords can be found on the Internet with the following citation: Olsen, L.M., G. Major, K. Shein, J. Scialdone, S. Ritz, T. Stevens, M. Morahan, A. Aleman, R. Vogel, S. Leicester, H. Weir, M. Meaux, S. Grebas, C.Solomon, M. Holland, T. Northcutt, R. A. Restrepo, R. Bilodeau, 2013. NASA/Global Change Master Directory (GCMD) Earth Science Keywords. Version 8.0.0.0.0
https://svs.gsfc.nasa.gov/3170
Data Used:
Chandra/HRC-I
2004/01/24, 2004/01/30, 2004/02/15, 2004/04/13This item is part of this series:
WMS
Keywords:
GCMD >> Earth Science >> Atmosphere >> Atmospheric Radiation >> Atmospheric Emitted Radiation
GCMD >> Earth Science >> Sun-earth Interactions >> Ionosphere/Magnetosphere Particles >> Aurorae
NASA Science >> Earth
NASA Science >> Sun
GCMD keywords can be found on the Internet with the following citation: Olsen, L.M., G. Major, K. Shein, J. Scialdone, S. Ritz, T. Stevens, M. Morahan, A. Aleman, R. Vogel, S. Leicester, H. Weir, M. Meaux, S. Grebas, C.Solomon, M. Holland, T. Northcutt, R. A. Restrepo, R. Bilodeau, 2013. NASA/Global Change Master Directory (GCMD) Earth Science Keywords. Version 8.0.0.0.0


