Earth
ID: 3047
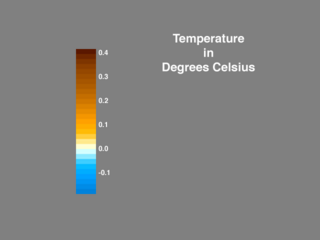
This image shows the 22-year surface temperature trend over the Arctic region. Blue hues indicate areas that are cooling; gold hues depict areas that are warming. Lighter colors indicate less change while darker colors indicate more. The temperature scale steps from zero degrees Celsius in increments of .02 degrees. (See color bar below) The data ranges from -0.162 to +0.487 degrees Celsius.
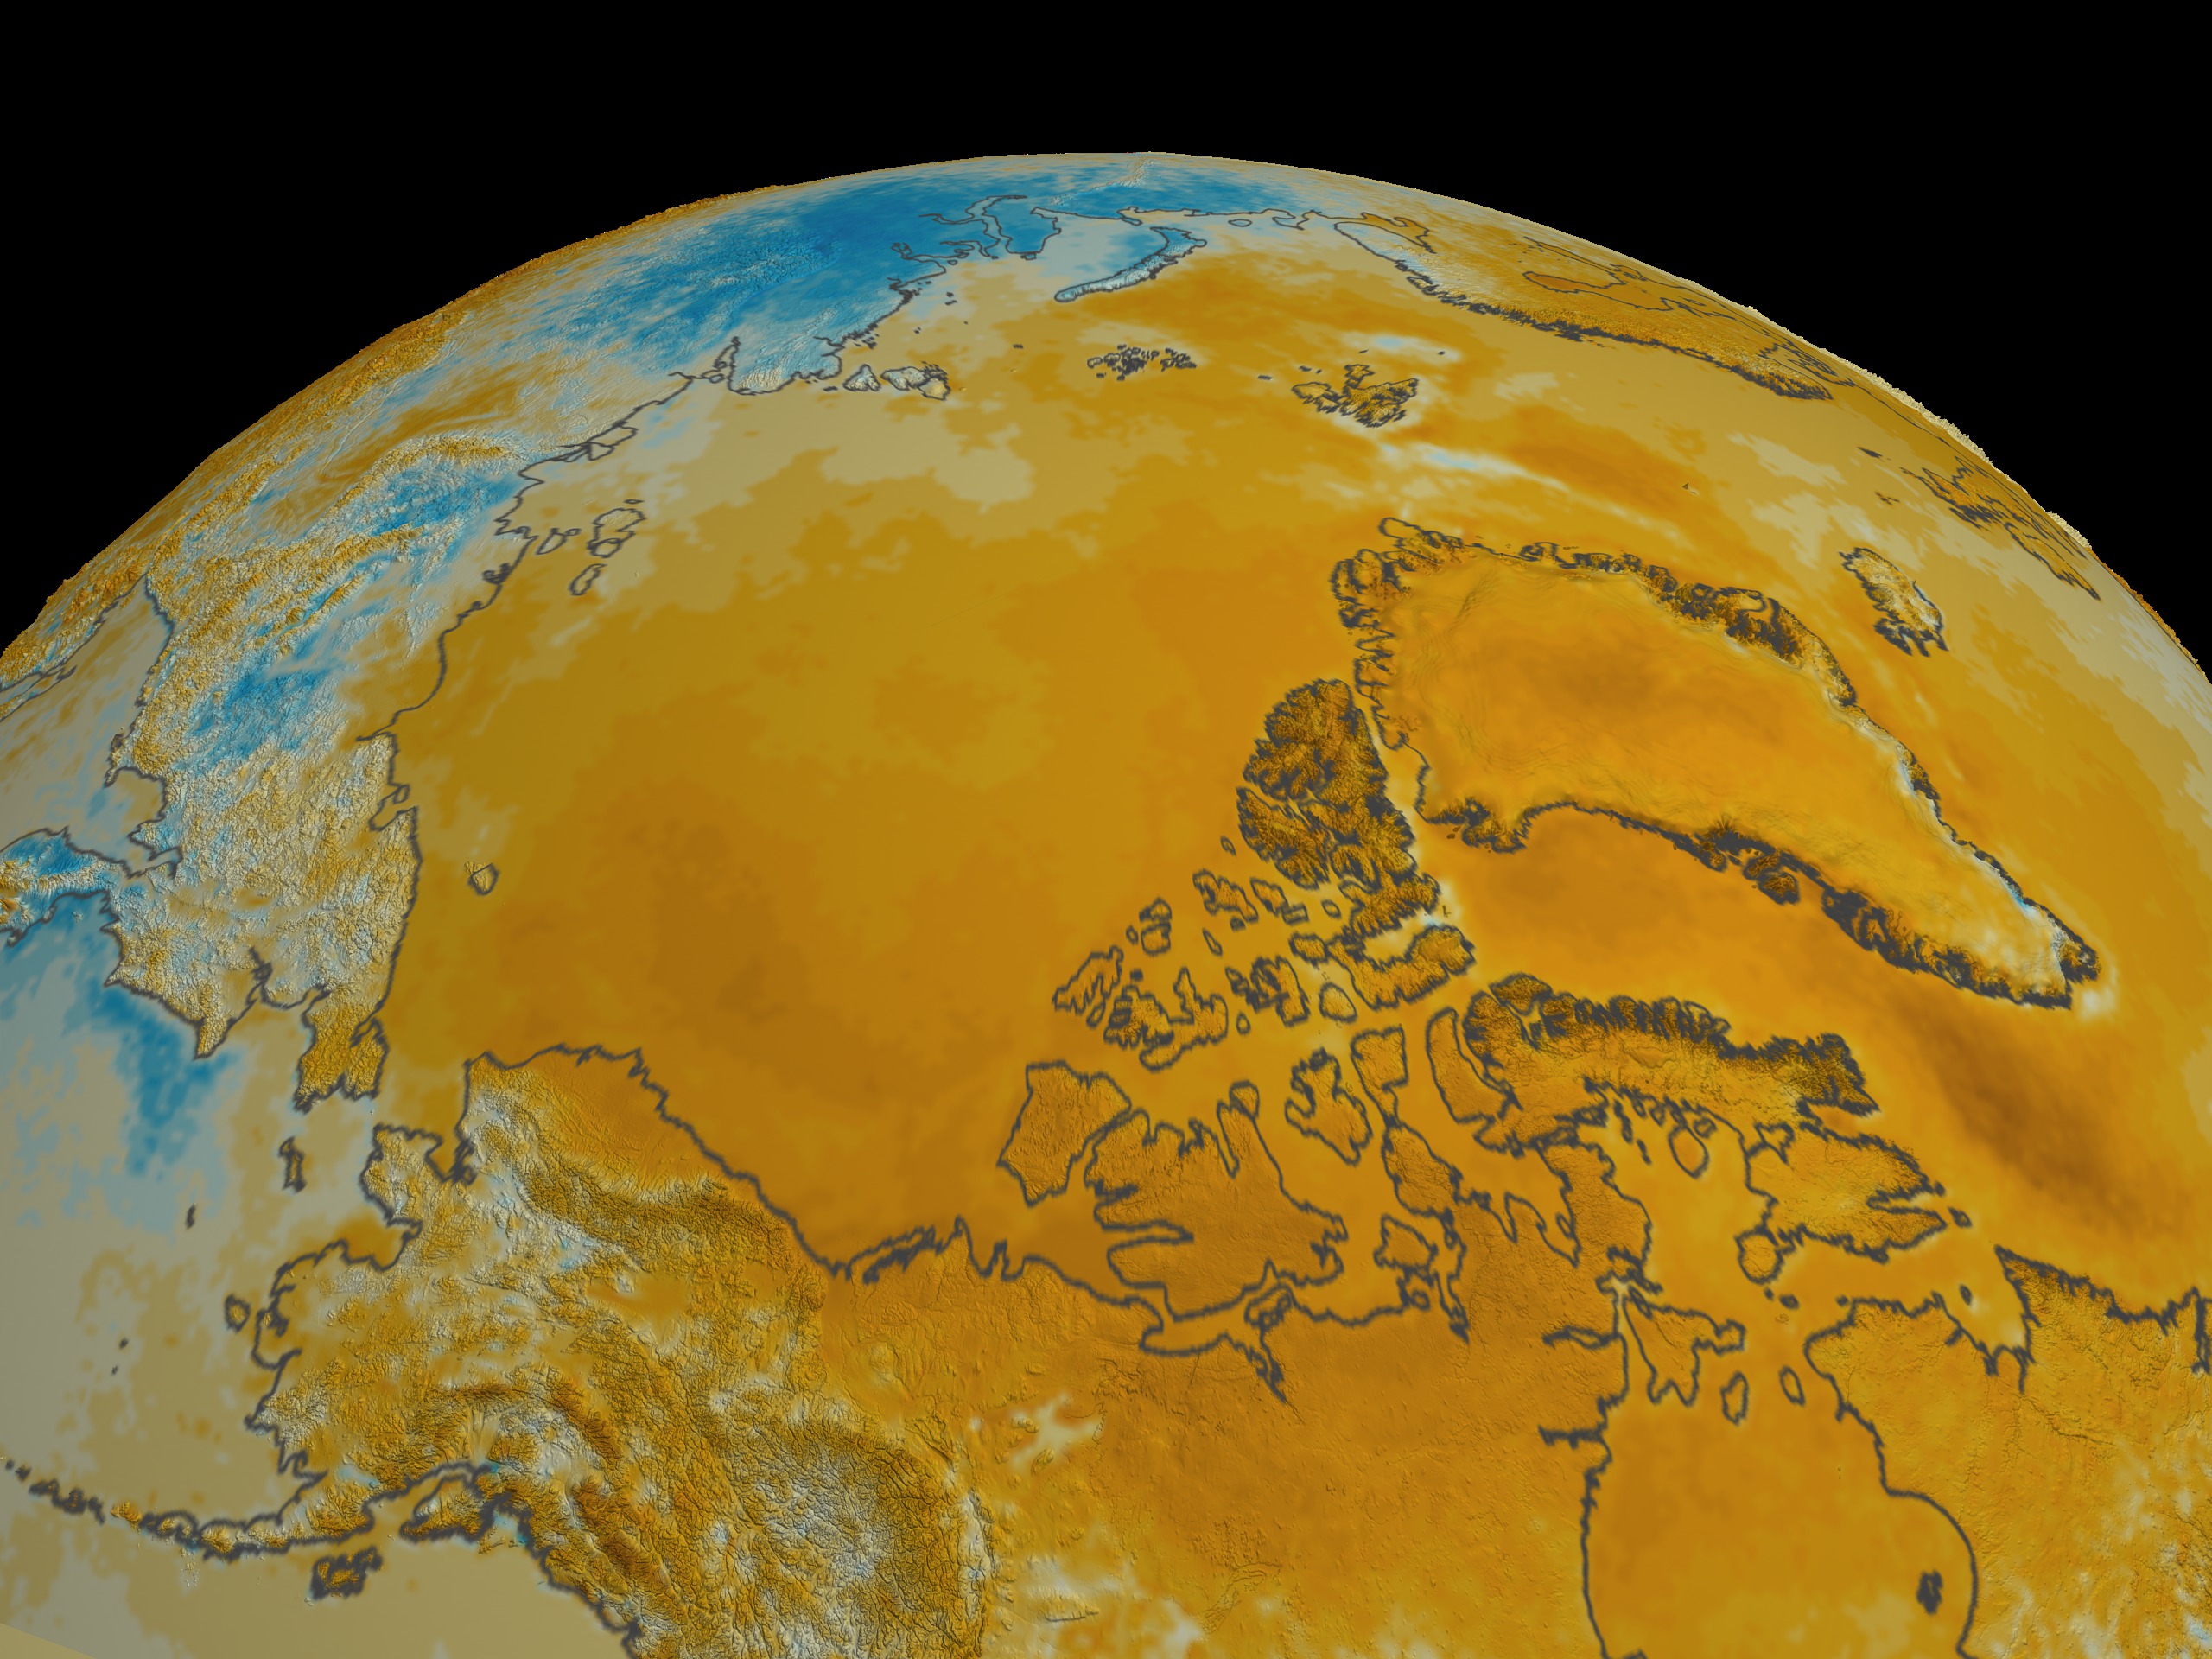
22-Year Arctic Surface Temperature Trend
Visualization Credits
Cindy Starr (Global Science and Technology, Inc.): Lead Visualizer
Josefino Comiso (NASA/GSFC): Scientist
Josefino Comiso (NASA/GSFC): Scientist
Please give credit for this item to:
NASA/Goddard Space Flight Center Scientific Visualization Studio, Larry Stock, Stephen Pizer (UNC)
NASA/Goddard Space Flight Center Scientific Visualization Studio, Larry Stock, Stephen Pizer (UNC)
Short URL to share this page:
https://svs.gsfc.nasa.gov/3047
Data Used:
Note: While we identify the data sets used in these visualizations, we do not store any further details nor the data sets themselves on our site.
Dates of Data Used:
August 1981 through July 2003
Keywords:
DLESE >> Cryology
SVS >> North Pole
SVS >> Surface Temperature
SVS >> Temperature Trend
GCMD >> Location >> Arctic
SVS >> For Educators
SVS >> Weather >> Climate Change
NASA Science >> Earth
GCMD keywords can be found on the Internet with the following citation: Olsen, L.M., G. Major, K. Shein, J. Scialdone, S. Ritz, T. Stevens, M. Morahan, A. Aleman, R. Vogel, S. Leicester, H. Weir, M. Meaux, S. Grebas, C.Solomon, M. Holland, T. Northcutt, R. A. Restrepo, R. Bilodeau, 2013. NASA/Global Change Master Directory (GCMD) Earth Science Keywords. Version 8.0.0.0.0
https://svs.gsfc.nasa.gov/3047
Data Used:
NOAA-7, 9, 11, 14, 16/AVHRR/Arctic Temperature Trends
August 1981 through July 2003Dates of Data Used:
August 1981 through July 2003
Keywords:
DLESE >> Cryology
SVS >> North Pole
SVS >> Surface Temperature
SVS >> Temperature Trend
GCMD >> Location >> Arctic
SVS >> For Educators
SVS >> Weather >> Climate Change
NASA Science >> Earth
GCMD keywords can be found on the Internet with the following citation: Olsen, L.M., G. Major, K. Shein, J. Scialdone, S. Ritz, T. Stevens, M. Morahan, A. Aleman, R. Vogel, S. Leicester, H. Weir, M. Meaux, S. Grebas, C.Solomon, M. Holland, T. Northcutt, R. A. Restrepo, R. Bilodeau, 2013. NASA/Global Change Master Directory (GCMD) Earth Science Keywords. Version 8.0.0.0.0


