Earth
ID: 3039
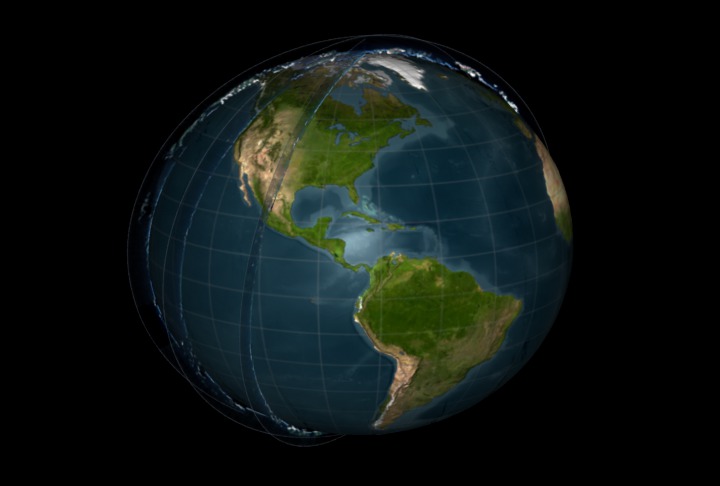
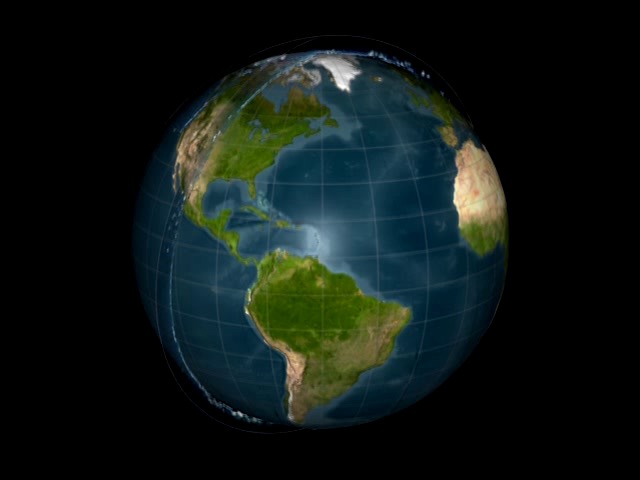
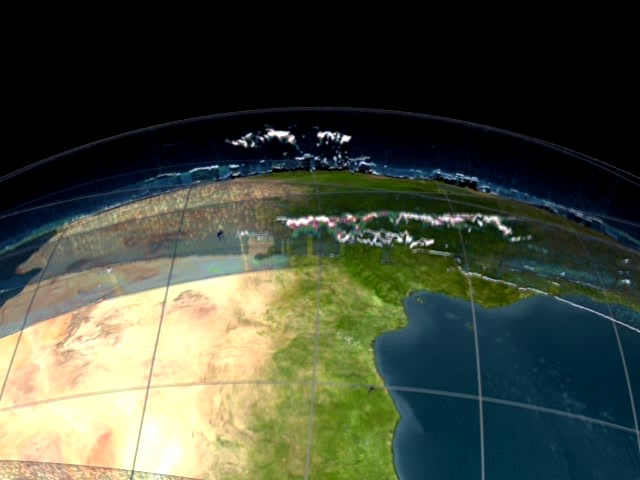
This is an animation showing data from ICESat's Geoscience Laser Altimeter System (GLAS). Cloud data can be seen over about 15 orbits on October 6, 2003. The data are initially laid out in the order that is was collected followed by continued movement around the scene. This version of the animation starts with the full globe, moves south to Antarctica, over the pole, then north to Africa, around the world near the equator and finally to the north pole.
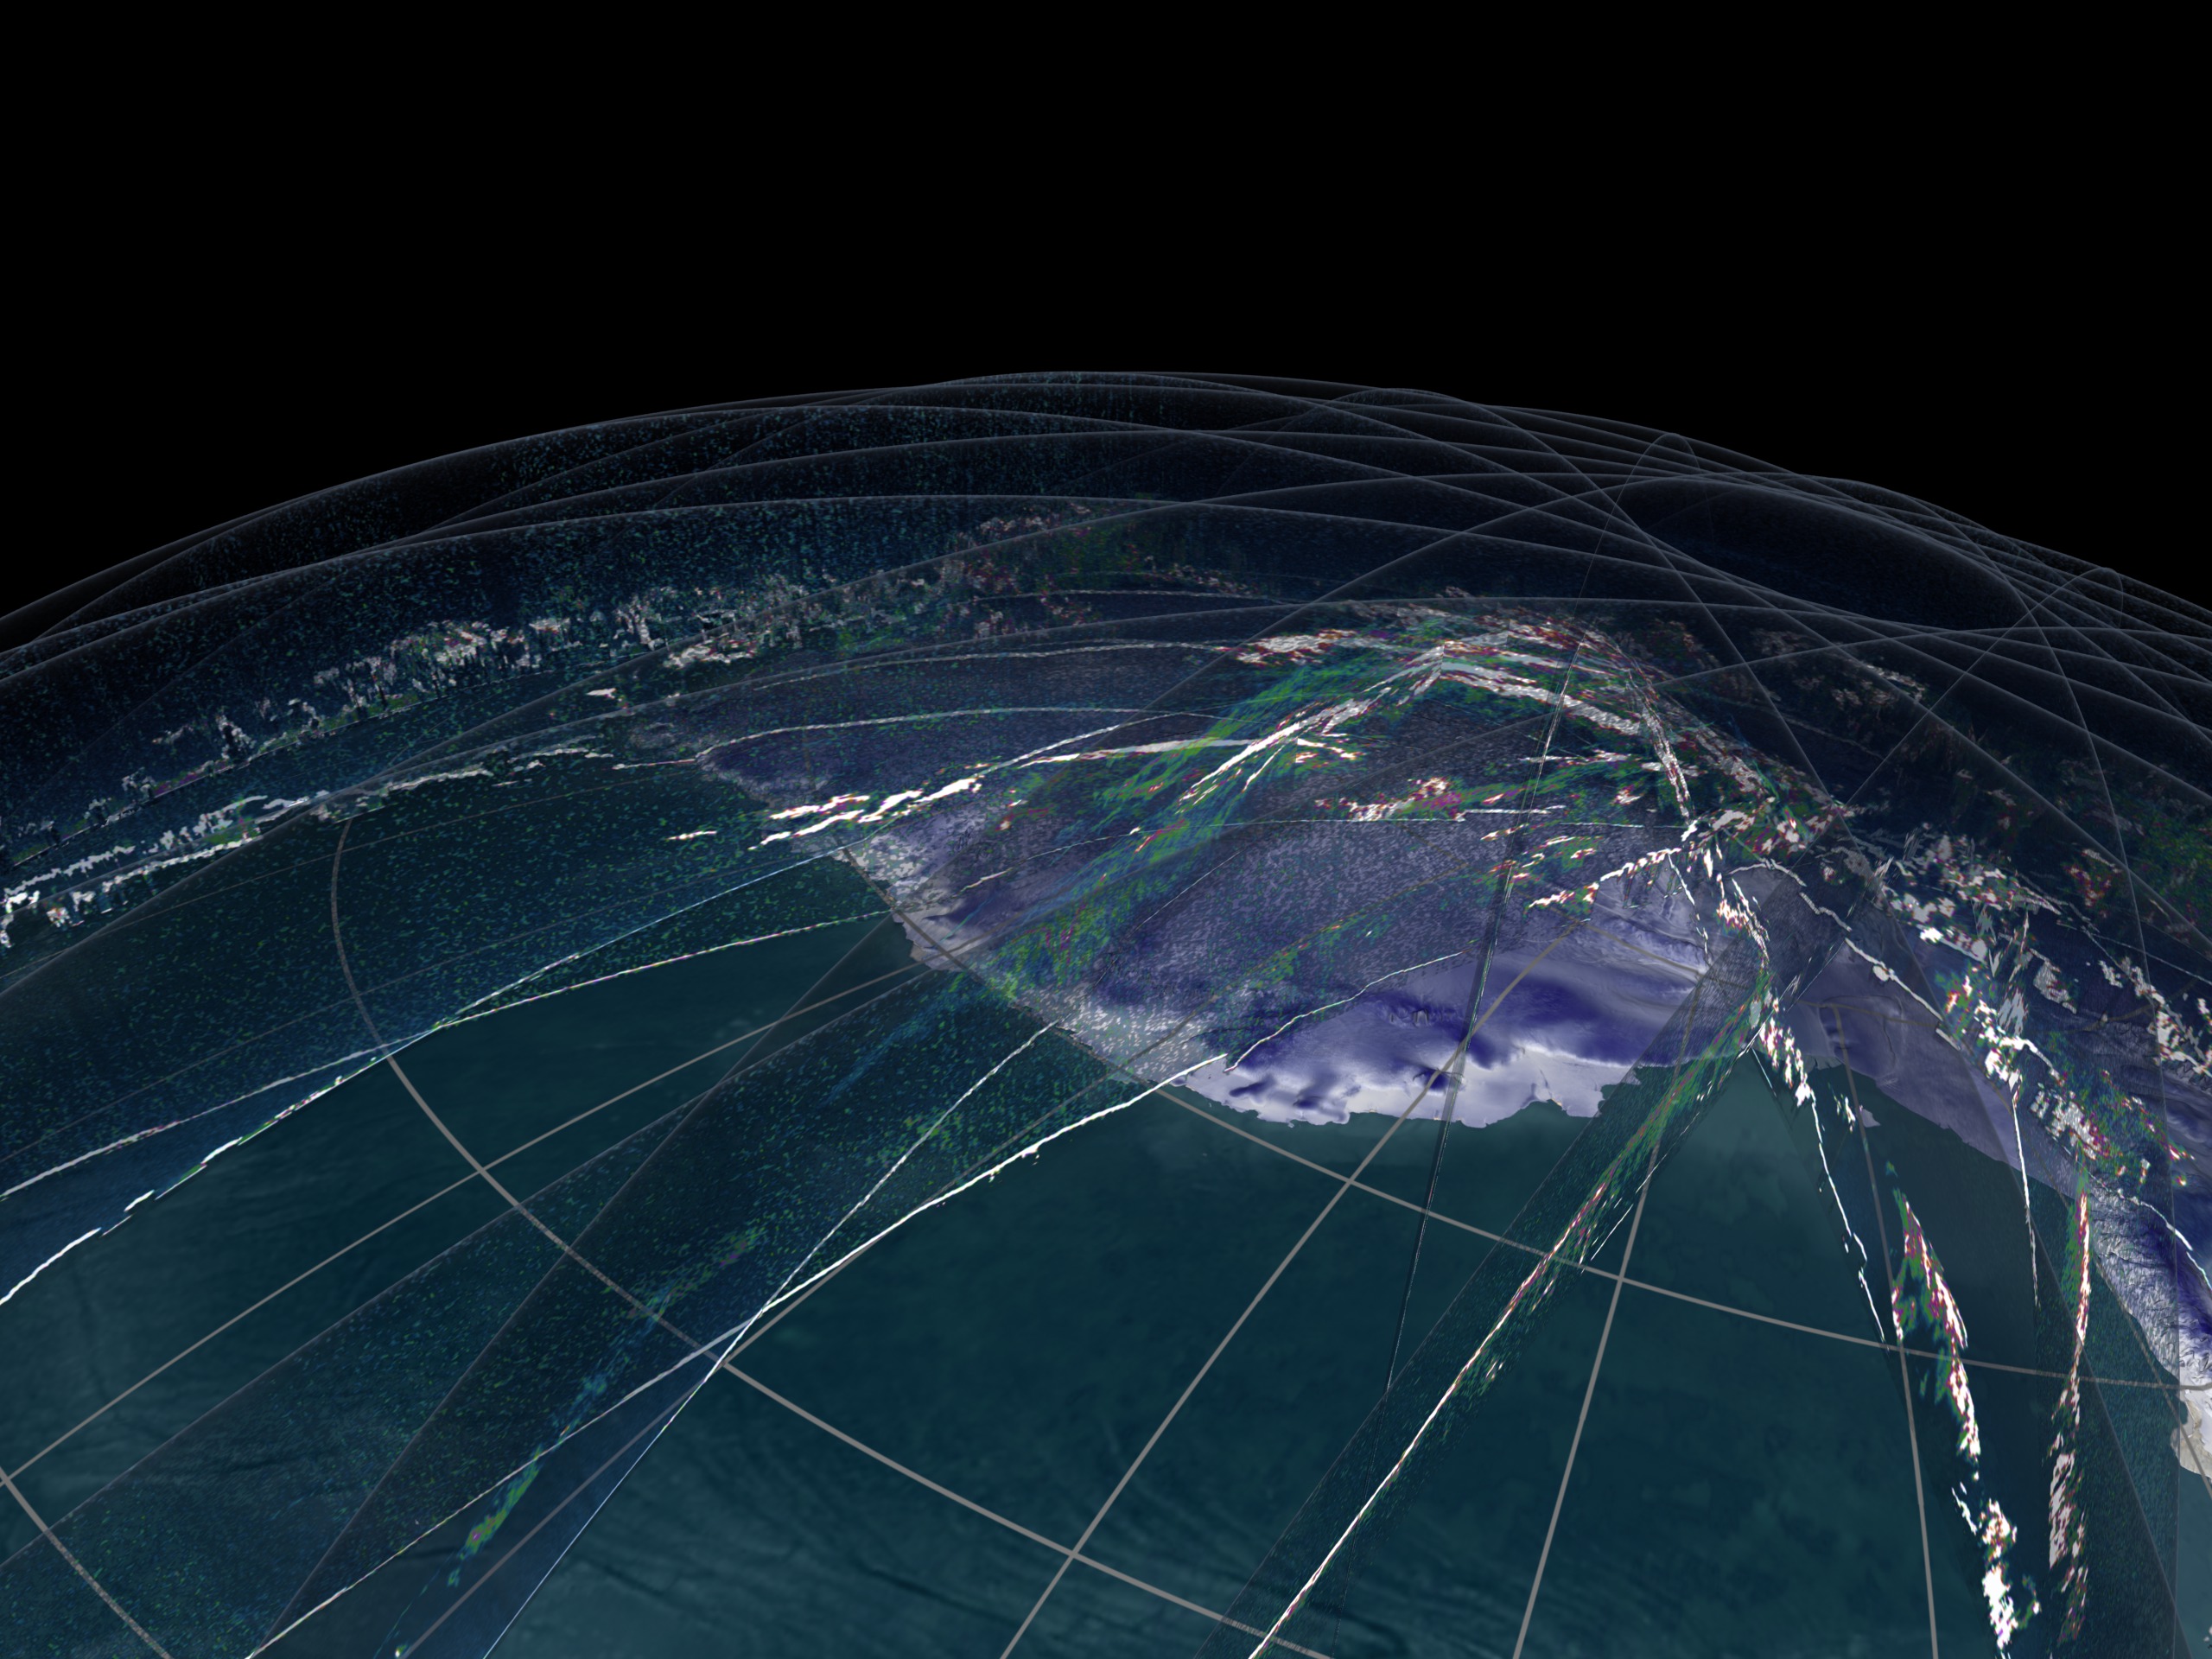
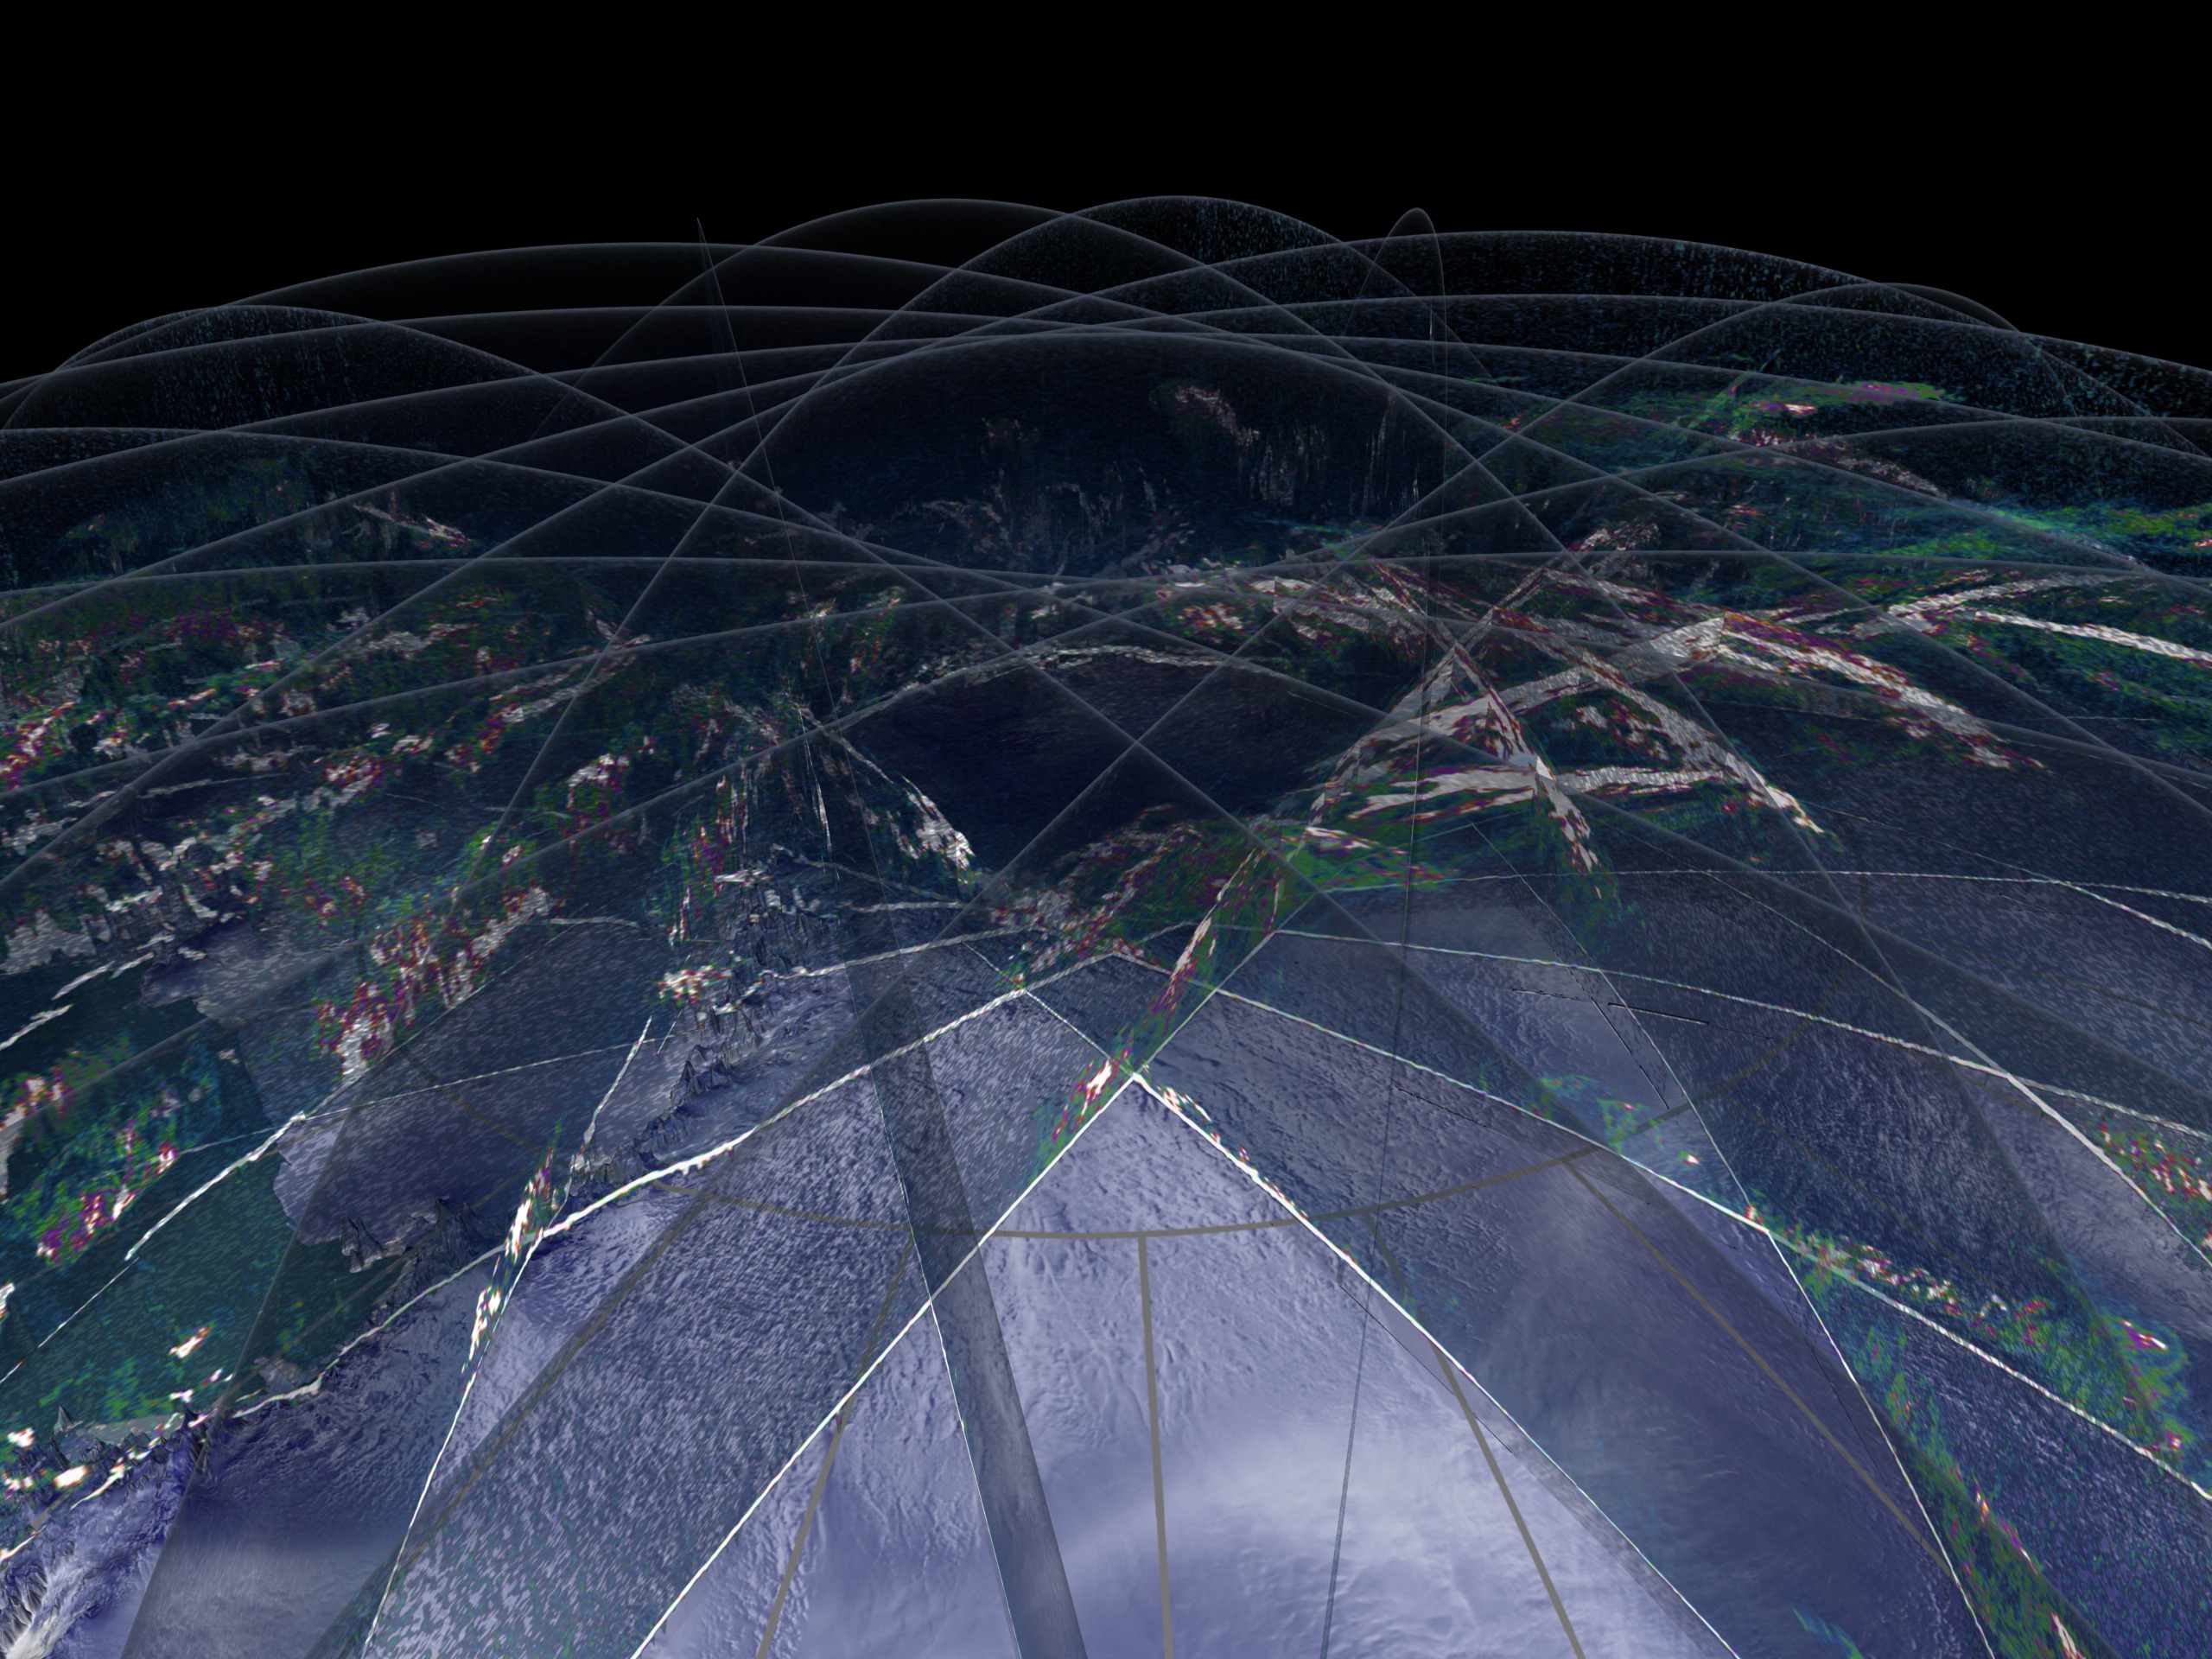
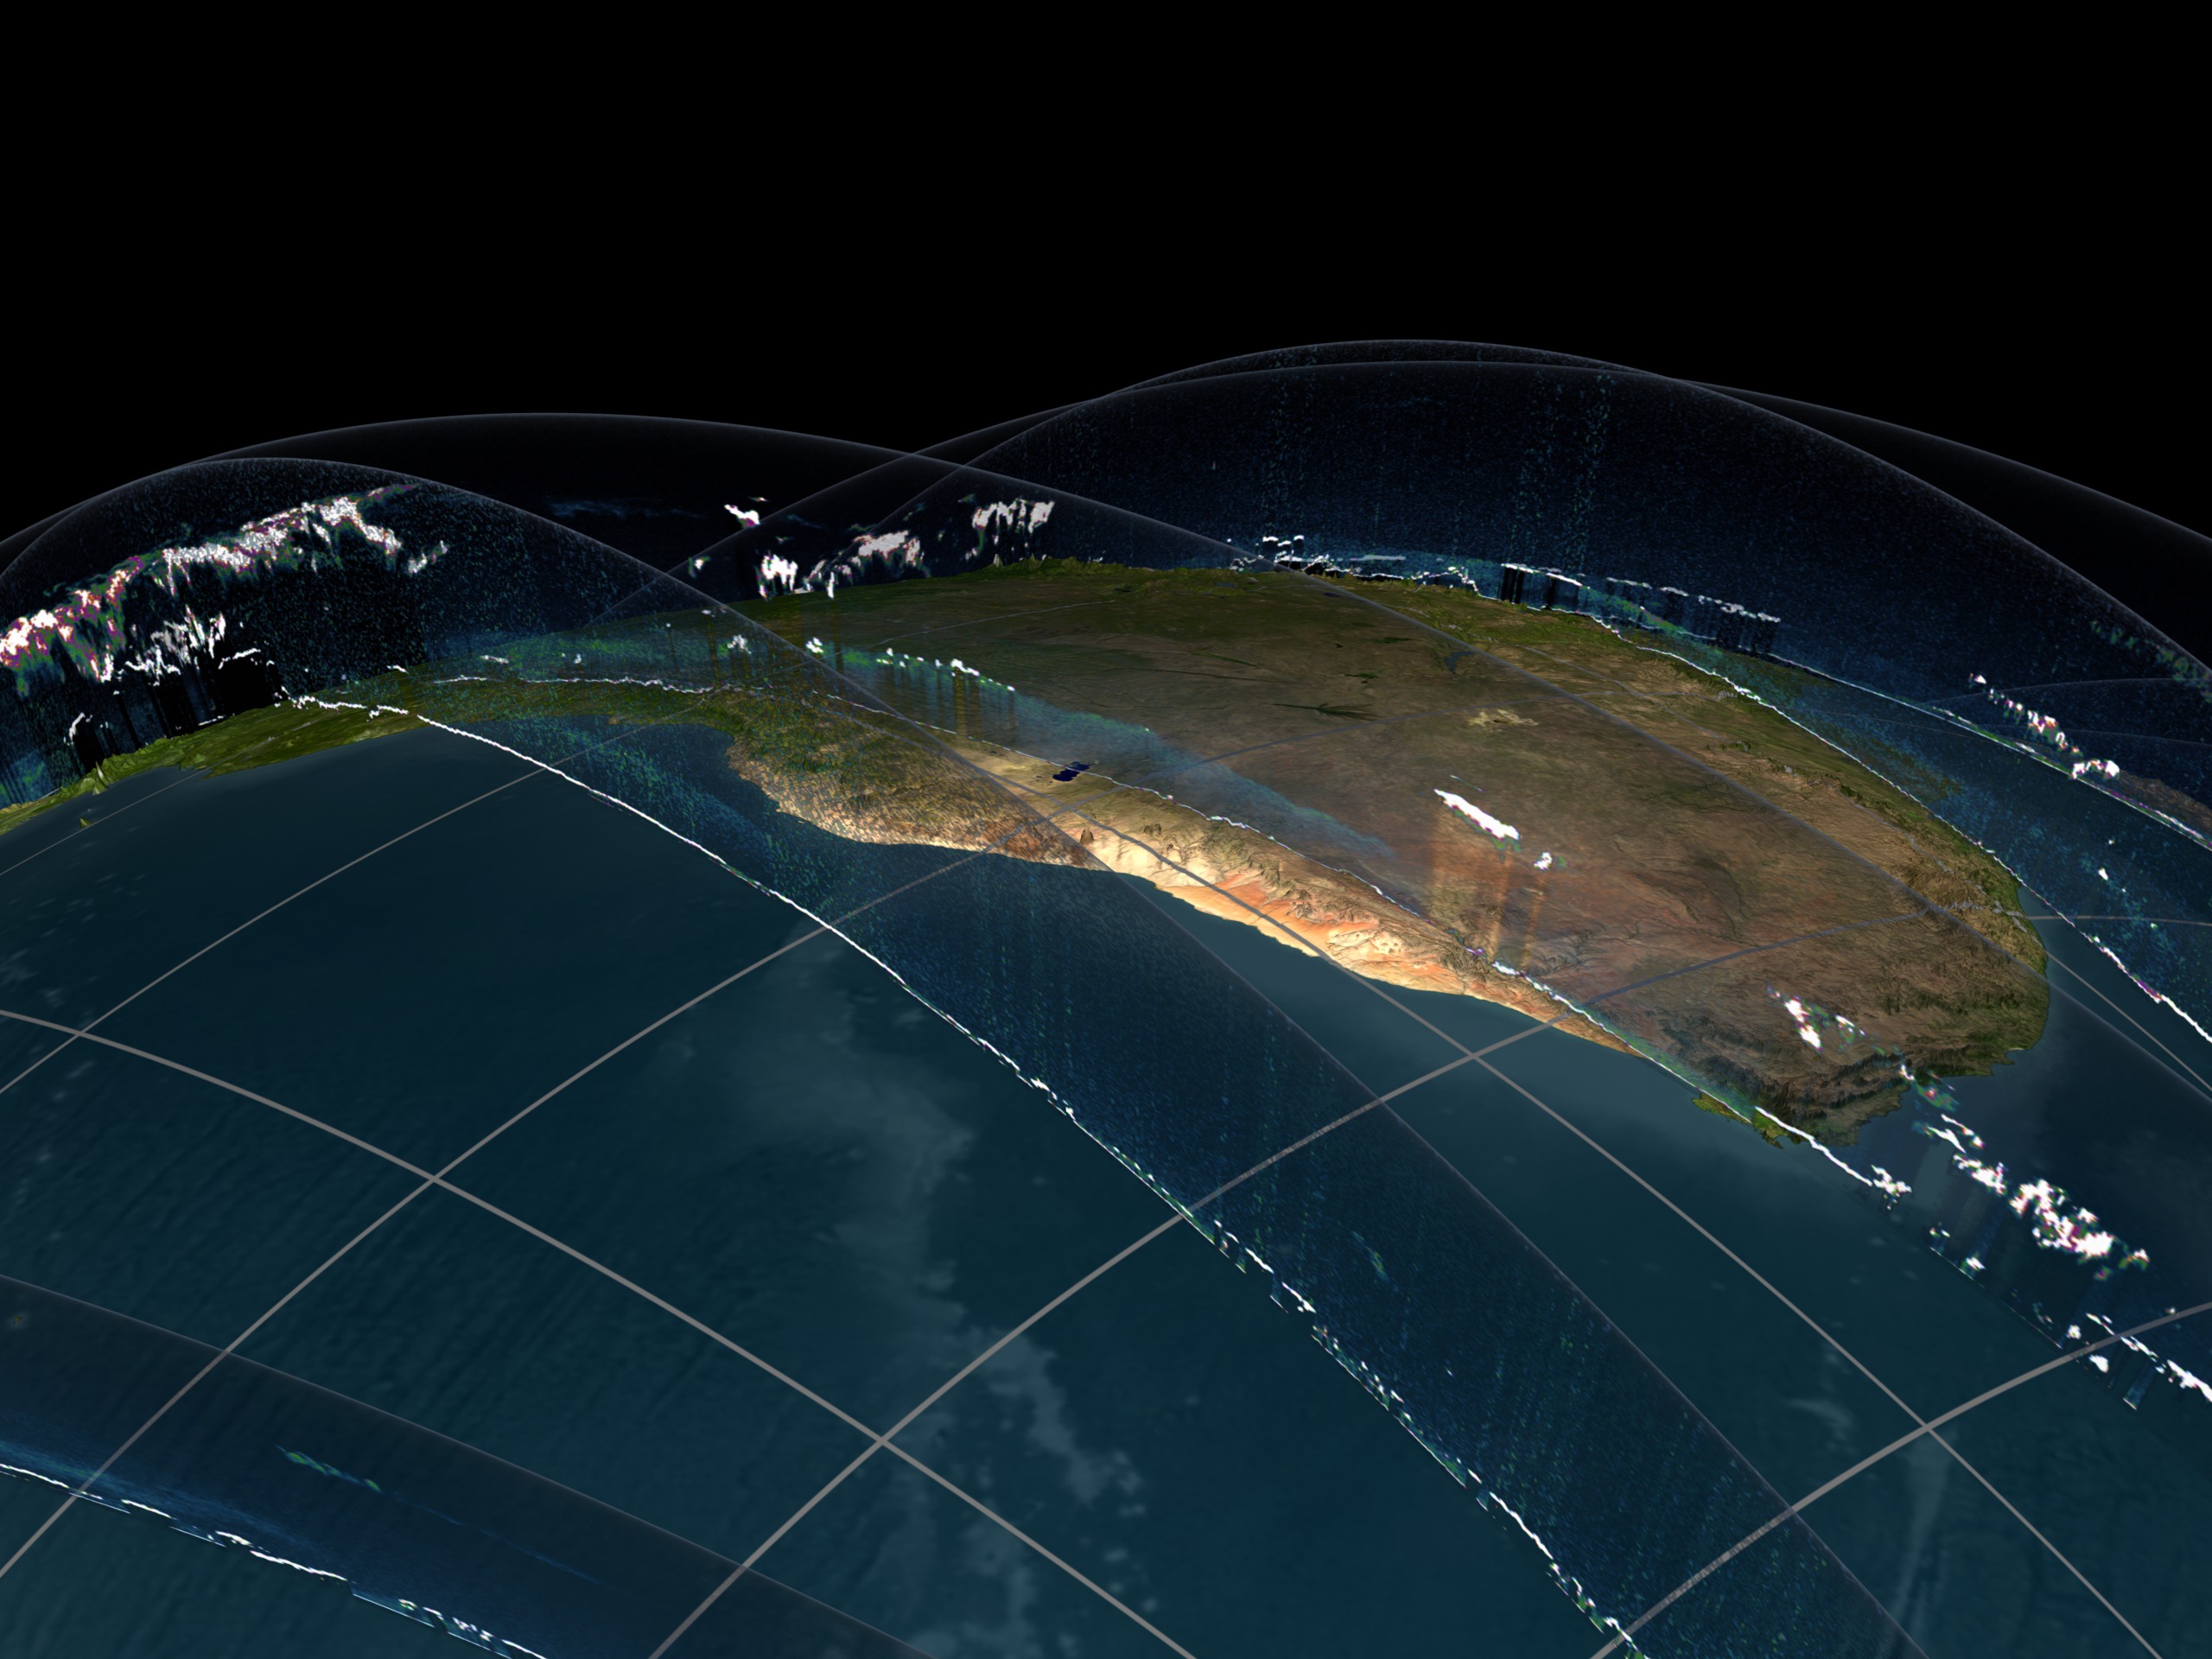
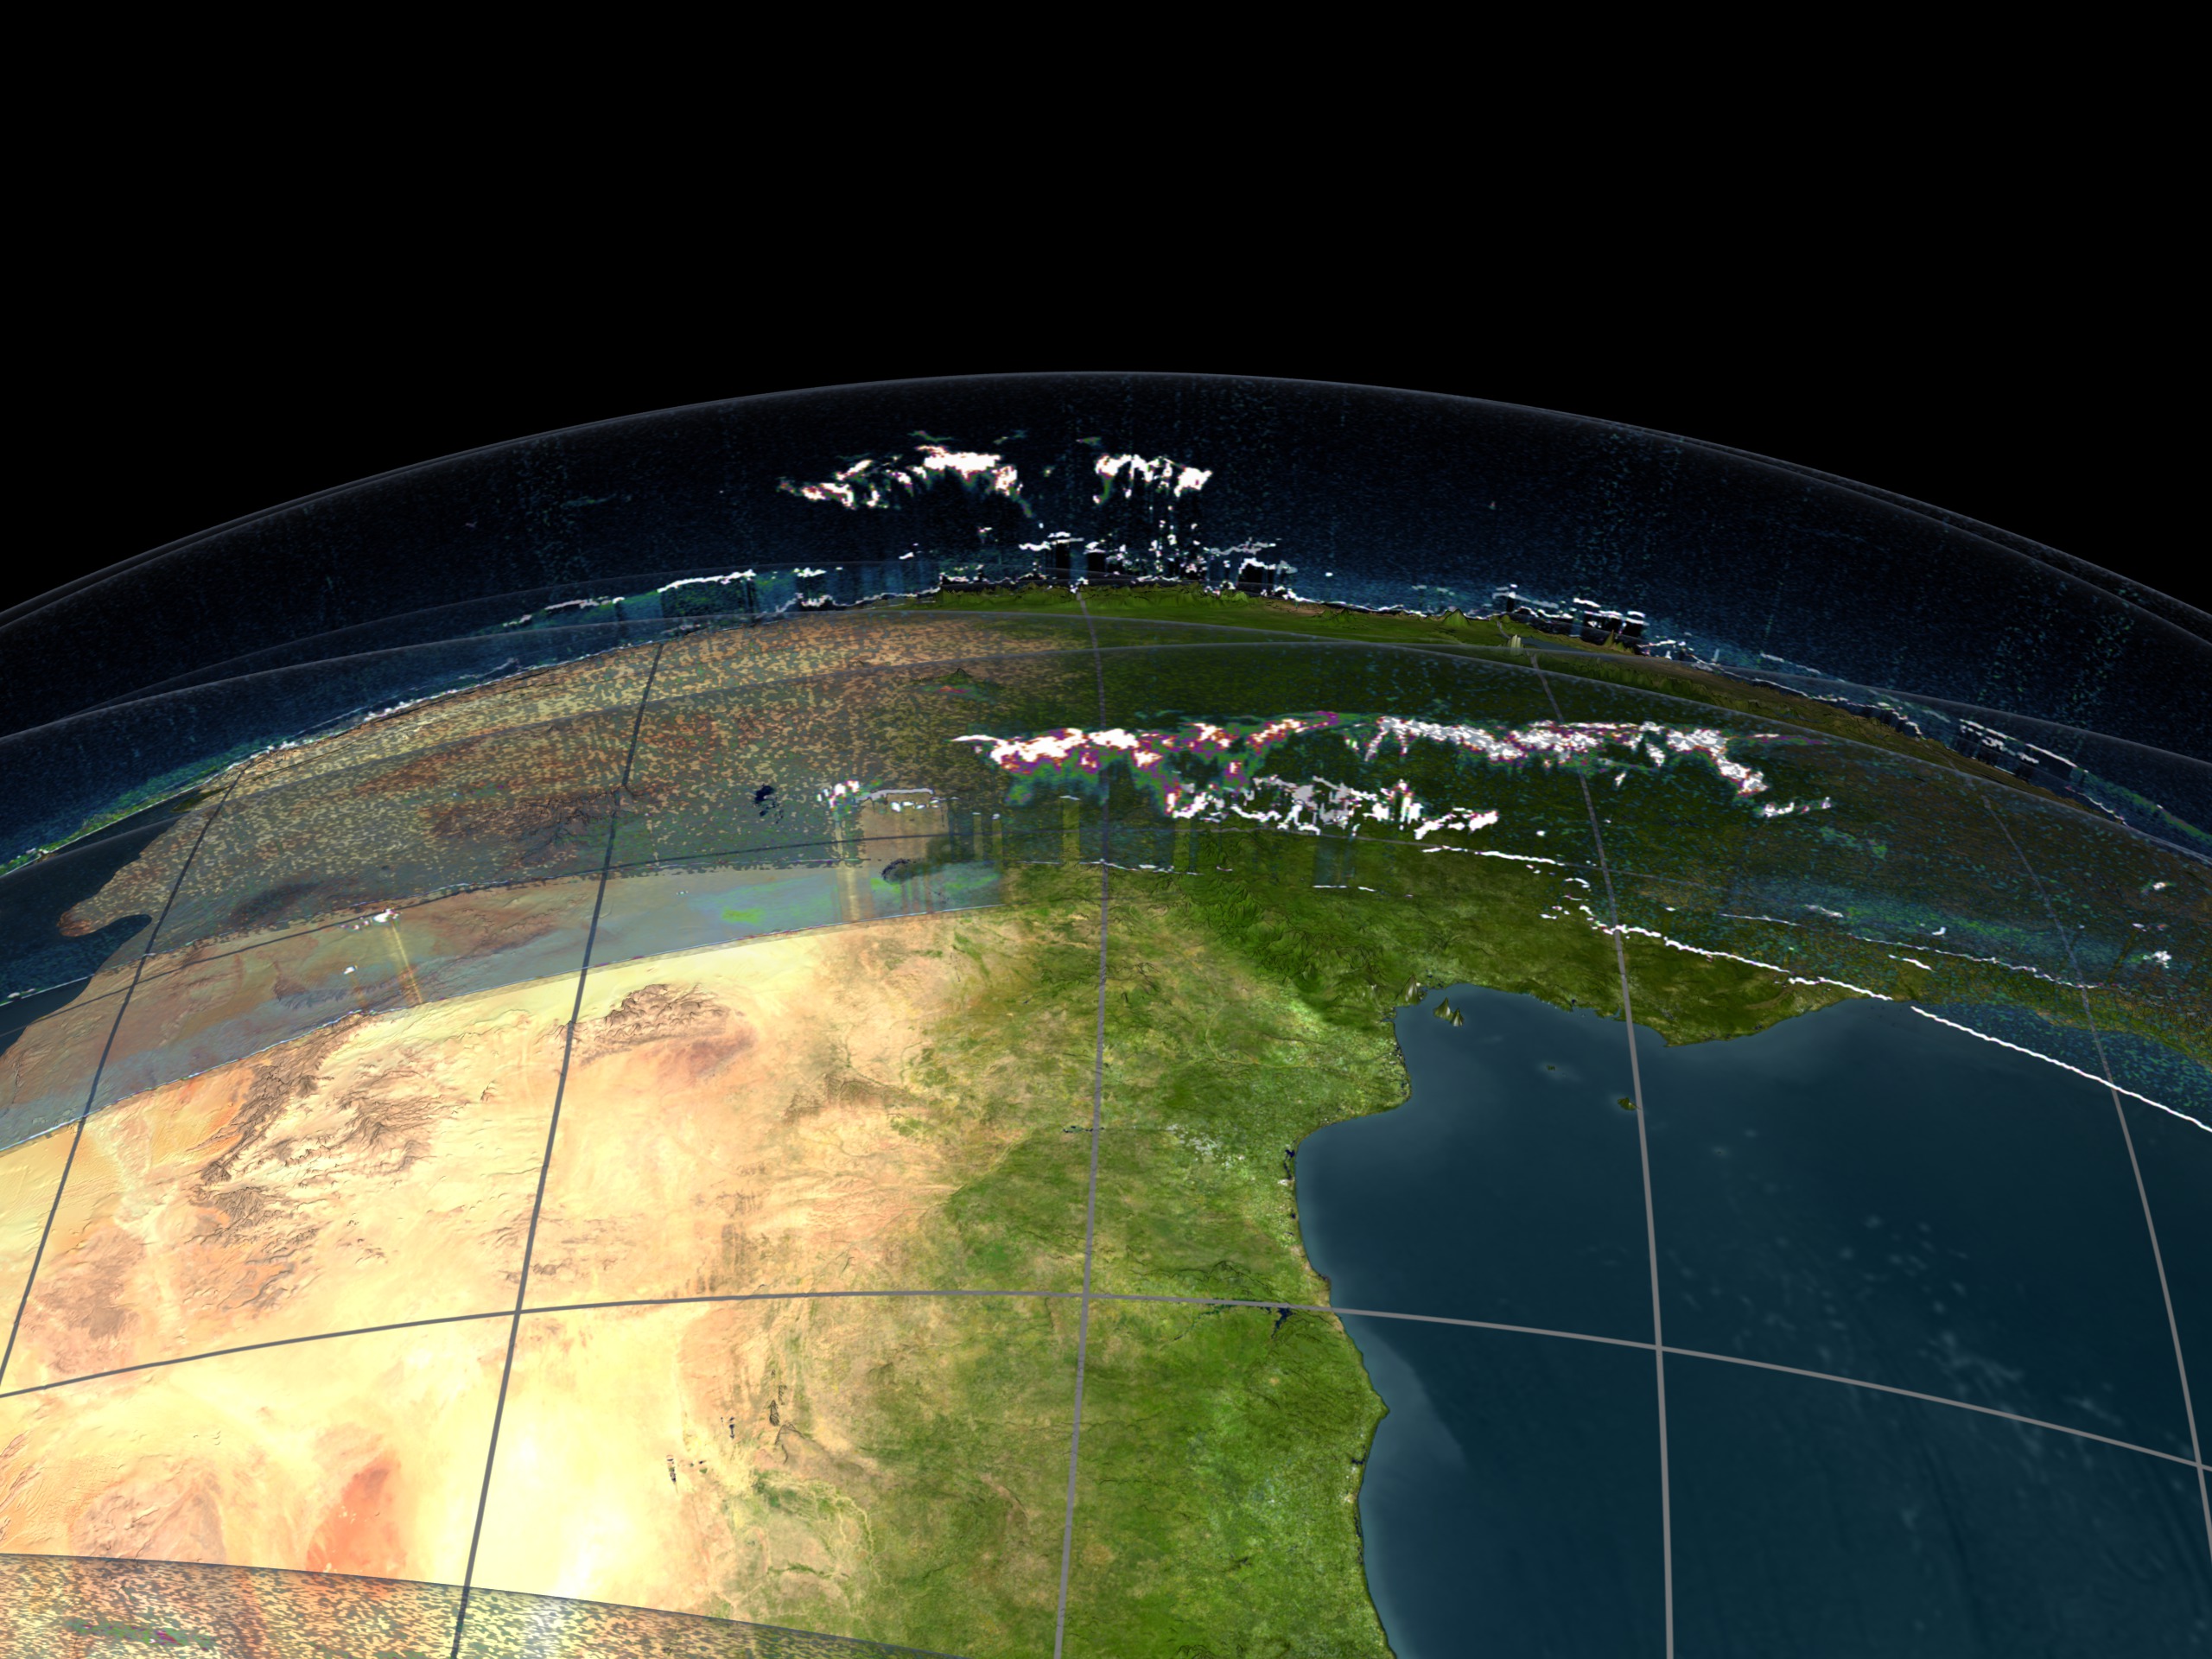

ICESat Cloud Walls (scripted camera path)
Visualization Credits
Greg Shirah (NASA/GSFC): Lead Animator
Alex Kekesi (Global Science and Technology, Inc.): Animator
Steve Palm (NASA/GSFC): Scientist
Alex Kekesi (Global Science and Technology, Inc.): Animator
Steve Palm (NASA/GSFC): Scientist
Please give credit for this item to:
NASA/Goddard Space Flight Center Scientific Visualization Studio
NASA/Goddard Space Flight Center Scientific Visualization Studio
Short URL to share this page:
https://svs.gsfc.nasa.gov/3039
Mission:
Ice, Cloud, and land Elevation Satellite (ICESat)
Data Used:
Note: While we identify the data sets used in these visualizations, we do not store any further details nor the data sets themselves on our site.
Keywords:
SVS >> Ice
GCMD >> Earth Science >> Atmosphere >> Clouds
GCMD >> Earth Science >> Land Surface >> Topography
GCMD >> Location >> Africa
SVS >> For Educators
SVS >> Atmosphere >> Winds >> Circulation
SVS >> Atmospheric Science
SVS >> Cloud Cover >> Type
SVS >> Location >> South Pole
SVS >> Location >> Equator
SVS >> Cloud Cover >> Frequency
NASA Science >> Earth
GCMD keywords can be found on the Internet with the following citation: Olsen, L.M., G. Major, K. Shein, J. Scialdone, S. Ritz, T. Stevens, M. Morahan, A. Aleman, R. Vogel, S. Leicester, H. Weir, M. Meaux, S. Grebas, C.Solomon, M. Holland, T. Northcutt, R. A. Restrepo, R. Bilodeau, 2013. NASA/Global Change Master Directory (GCMD) Earth Science Keywords. Version 8.0.0.0.0
https://svs.gsfc.nasa.gov/3039
Mission:
Ice, Cloud, and land Elevation Satellite (ICESat)
Data Used:
ICESat/GLAS
2003/10/01Keywords:
SVS >> Ice
GCMD >> Earth Science >> Atmosphere >> Clouds
GCMD >> Earth Science >> Land Surface >> Topography
GCMD >> Location >> Africa
SVS >> For Educators
SVS >> Atmosphere >> Winds >> Circulation
SVS >> Atmospheric Science
SVS >> Cloud Cover >> Type
SVS >> Location >> South Pole
SVS >> Location >> Equator
SVS >> Cloud Cover >> Frequency
NASA Science >> Earth
GCMD keywords can be found on the Internet with the following citation: Olsen, L.M., G. Major, K. Shein, J. Scialdone, S. Ritz, T. Stevens, M. Morahan, A. Aleman, R. Vogel, S. Leicester, H. Weir, M. Meaux, S. Grebas, C.Solomon, M. Holland, T. Northcutt, R. A. Restrepo, R. Bilodeau, 2013. NASA/Global Change Master Directory (GCMD) Earth Science Keywords. Version 8.0.0.0.0


