Earth
ID: 3036
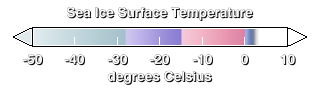
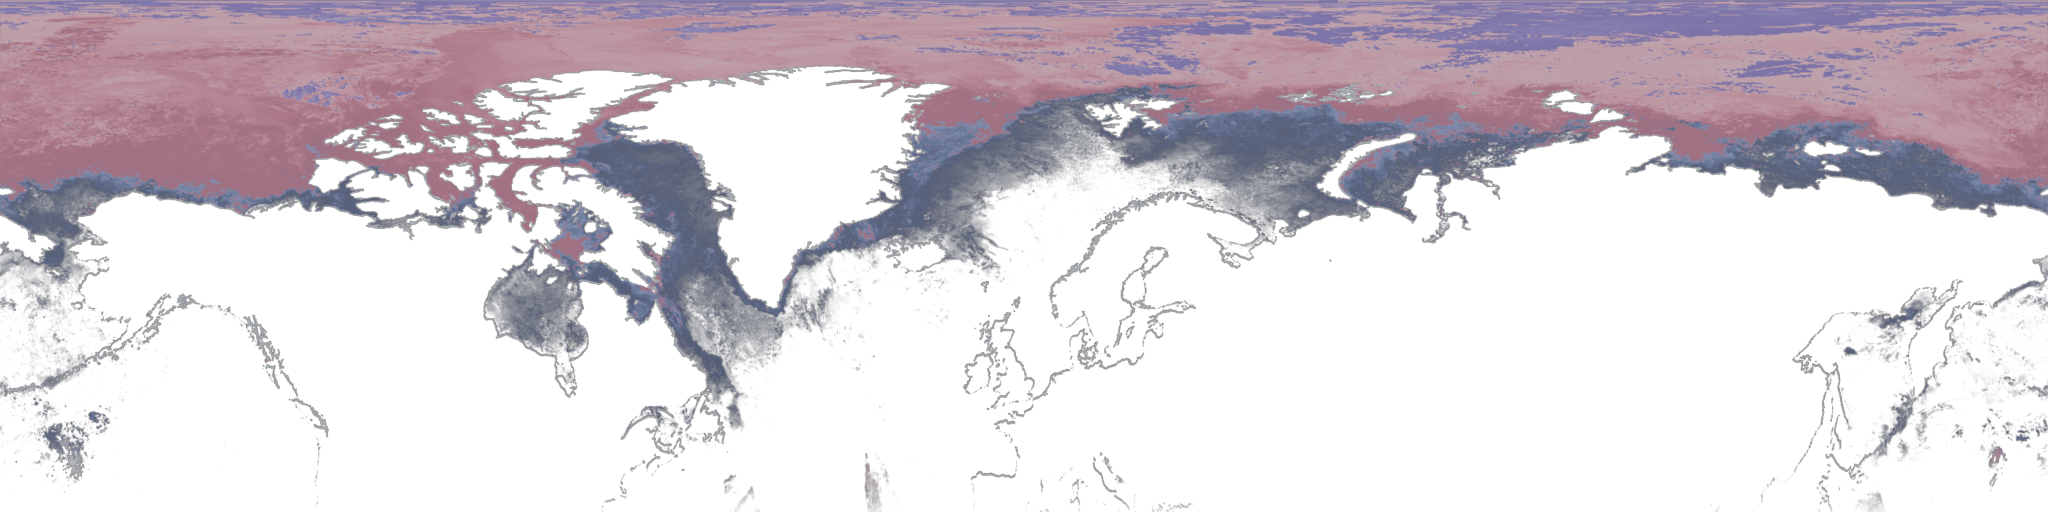
This animation shows the daily sea ice surface temperature over the northern hemisphere from September 2002 through May 2003. The sea ice surface temperature was measured by the MODIS instrument on the Aqua satellite. Since this instrument cannot take measurements through clouds or in the dark, in dark or cloud-covered regions or areas with suspect data quality, the prior day's value is retained until a valid data reading is obtained. The color of the sea ice indicates the sea ice surface temperature.
Daily Sea Ice Surface Temperature 2002-2003 (WMS)
Visualization Credits
Cindy Starr (Global Science and Technology, Inc.): Lead Visualizer
Eric Sokolowsky (GST): Animator
George Riggs (SSAI): Scientist
Eric Sokolowsky (GST): Animator
George Riggs (SSAI): Scientist
Please give credit for this item to:
NASA/Goddard Space Flight Center Scientific Visualization Studio
NASA/Goddard Space Flight Center Scientific Visualization Studio
Short URL to share this page:
https://svs.gsfc.nasa.gov/3036
Mission:
Terra
Data Used:
Note: While we identify the data sets used in these visualizations, we do not store any further details nor the data sets themselves on our site.
This item is part of this series:
WMS
Keywords:
DLESE >> Cryology
SVS >> Surface Temperature
GCMD >> Earth Science >> Cryosphere >> Sea Ice >> Ice Temperature
GCMD >> Earth Science >> Hydrosphere >> Snow/Ice >> Snow/Ice Temperature
GCMD >> Earth Science >> Oceans >> Sea Ice >> Ice Temperature
GCMD >> Location >> Arctic
SVS >> Sea Ice Surface Temperature
SVS >> For Educators
NASA Science >> Earth
GCMD keywords can be found on the Internet with the following citation: Olsen, L.M., G. Major, K. Shein, J. Scialdone, S. Ritz, T. Stevens, M. Morahan, A. Aleman, R. Vogel, S. Leicester, H. Weir, M. Meaux, S. Grebas, C.Solomon, M. Holland, T. Northcutt, R. A. Restrepo, R. Bilodeau, 2013. NASA/Global Change Master Directory (GCMD) Earth Science Keywords. Version 8.0.0.0.0
https://svs.gsfc.nasa.gov/3036
Mission:
Terra
Data Used:
Terra/MODIS
Aqua/MODIS/Sea Ice Extent and Ice Surface Temperature Daily L3 Global 4km EASE-Grid Day (MYD29E1D)
2002/09/01 - 2003/07/01This item is part of this series:
WMS
Keywords:
DLESE >> Cryology
SVS >> Surface Temperature
GCMD >> Earth Science >> Cryosphere >> Sea Ice >> Ice Temperature
GCMD >> Earth Science >> Hydrosphere >> Snow/Ice >> Snow/Ice Temperature
GCMD >> Earth Science >> Oceans >> Sea Ice >> Ice Temperature
GCMD >> Location >> Arctic
SVS >> Sea Ice Surface Temperature
SVS >> For Educators
NASA Science >> Earth
GCMD keywords can be found on the Internet with the following citation: Olsen, L.M., G. Major, K. Shein, J. Scialdone, S. Ritz, T. Stevens, M. Morahan, A. Aleman, R. Vogel, S. Leicester, H. Weir, M. Meaux, S. Grebas, C.Solomon, M. Holland, T. Northcutt, R. A. Restrepo, R. Bilodeau, 2013. NASA/Global Change Master Directory (GCMD) Earth Science Keywords. Version 8.0.0.0.0


