Earth
ID: 3026
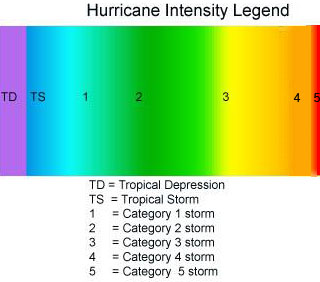
Hurricane Ivan made a very destructive path through the Caribbean and the United States. Then, a portion of the storm looped south and brought unwanted rains to an already inundated areas of Florida and Texas. This animation shows the position of the eye of Hurricane Ivan, as well as, the intensity of the storm. The intensity of the storm is depicted through color. Purple is the weakest classification, Tropical Depression, where winds are less then 39 miles per hour.Blue represents a Tropical Storm with winds between 39 and 73 miles per hour. Blue/Green shows a Class 1 Hurricane with winds between 74 and 95 miles per hour. Green displays a Class 2 Hurricane with winds between 96 and 110 miles per hour. Yellow is a Class 3 Hurricane where winds are sustained between 111 and 130 miles per hour. Orange is a Class 4 Hurricane with winds between 131 and 154 miles per hour. Red is the most deadly classification where winds are greater then 155 miles per hour.
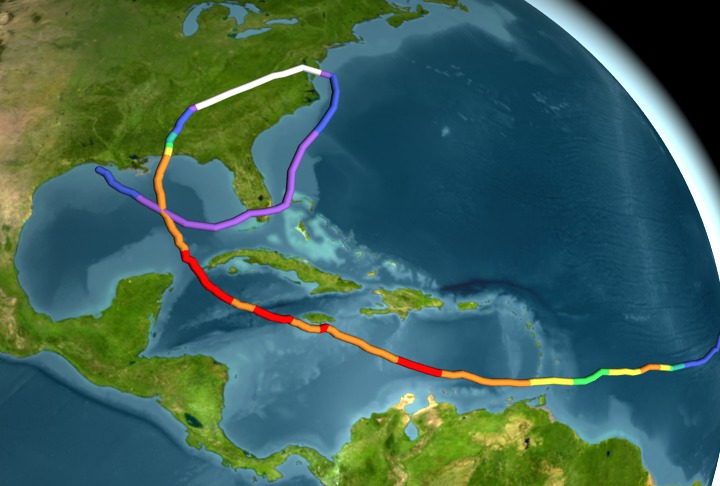
Hurricane Ivan Track and Intensity September 2-23, 2004
Visualization Credits
Please give credit for this item to:
NASA/Goddard Space Flight Center Scientific Visualization Studio
NASA/Goddard Space Flight Center Scientific Visualization Studio
Short URL to share this page:
https://svs.gsfc.nasa.gov/3026
Data Used:
Note: While we identify the data sets used in these visualizations, we do not store any further details nor the data sets themselves on our site.
This item is part of these series:
Hurricanes
Hurricane Ivan
Keywords:
DLESE >> Atmospheric science
DLESE >> Natural hazards
GCMD >> Earth Science >> Atmosphere >> Atmospheric Phenomena >> Hurricanes
GCMD >> Location >> Caribbean Sea
GCMD >> Location >> Gulf Of Mexico
SVS >> For Educators
SVS >> Hurricanes >> Ivan
SVS >> Hurricane Intensity
SVS >> Storm Rating
SVS >> Hurricane Track
NASA Science >> Earth
GCMD keywords can be found on the Internet with the following citation: Olsen, L.M., G. Major, K. Shein, J. Scialdone, S. Ritz, T. Stevens, M. Morahan, A. Aleman, R. Vogel, S. Leicester, H. Weir, M. Meaux, S. Grebas, C.Solomon, M. Holland, T. Northcutt, R. A. Restrepo, R. Bilodeau, 2013. NASA/Global Change Master Directory (GCMD) Earth Science Keywords. Version 8.0.0.0.0
https://svs.gsfc.nasa.gov/3026
Data Used:
Hurricane/Tropical Data
Database - Unisys - 2004/09/2-23This item is part of these series:
Hurricanes
Hurricane Ivan
Keywords:
DLESE >> Atmospheric science
DLESE >> Natural hazards
GCMD >> Earth Science >> Atmosphere >> Atmospheric Phenomena >> Hurricanes
GCMD >> Location >> Caribbean Sea
GCMD >> Location >> Gulf Of Mexico
SVS >> For Educators
SVS >> Hurricanes >> Ivan
SVS >> Hurricane Intensity
SVS >> Storm Rating
SVS >> Hurricane Track
NASA Science >> Earth
GCMD keywords can be found on the Internet with the following citation: Olsen, L.M., G. Major, K. Shein, J. Scialdone, S. Ritz, T. Stevens, M. Morahan, A. Aleman, R. Vogel, S. Leicester, H. Weir, M. Meaux, S. Grebas, C.Solomon, M. Holland, T. Northcutt, R. A. Restrepo, R. Bilodeau, 2013. NASA/Global Change Master Directory (GCMD) Earth Science Keywords. Version 8.0.0.0.0


