Earth
ID: 2931
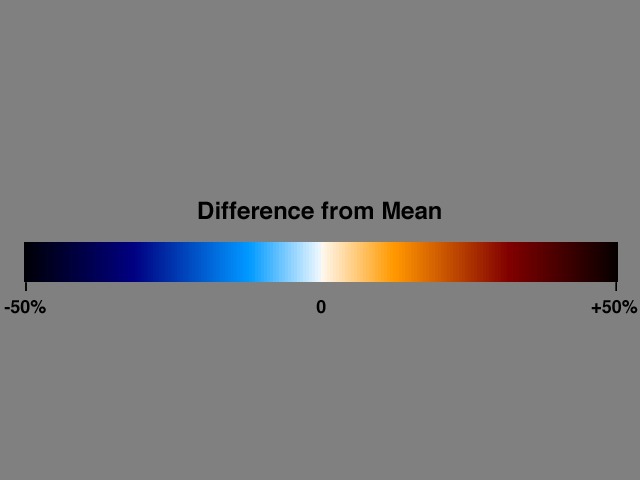
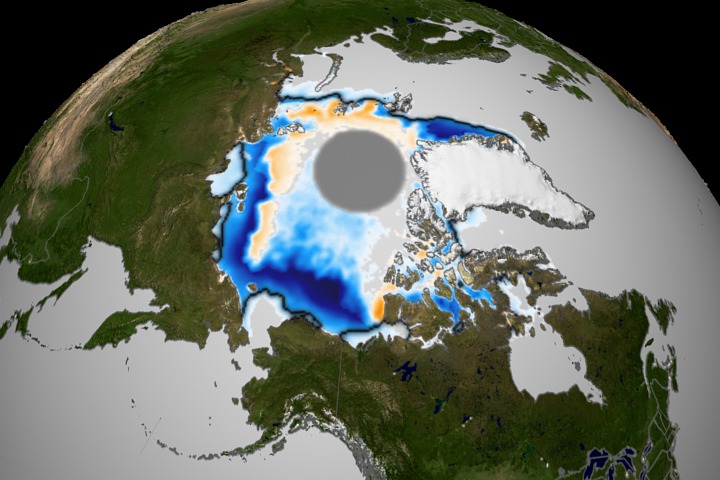
This animation fades between the September mean sea ice concentration anomaly for the years 2002 and 2003. Blue values indicate a loss in sea ice concentration while red values indicate an increase. A black line marks the average sea ice extent from 1979-2002.
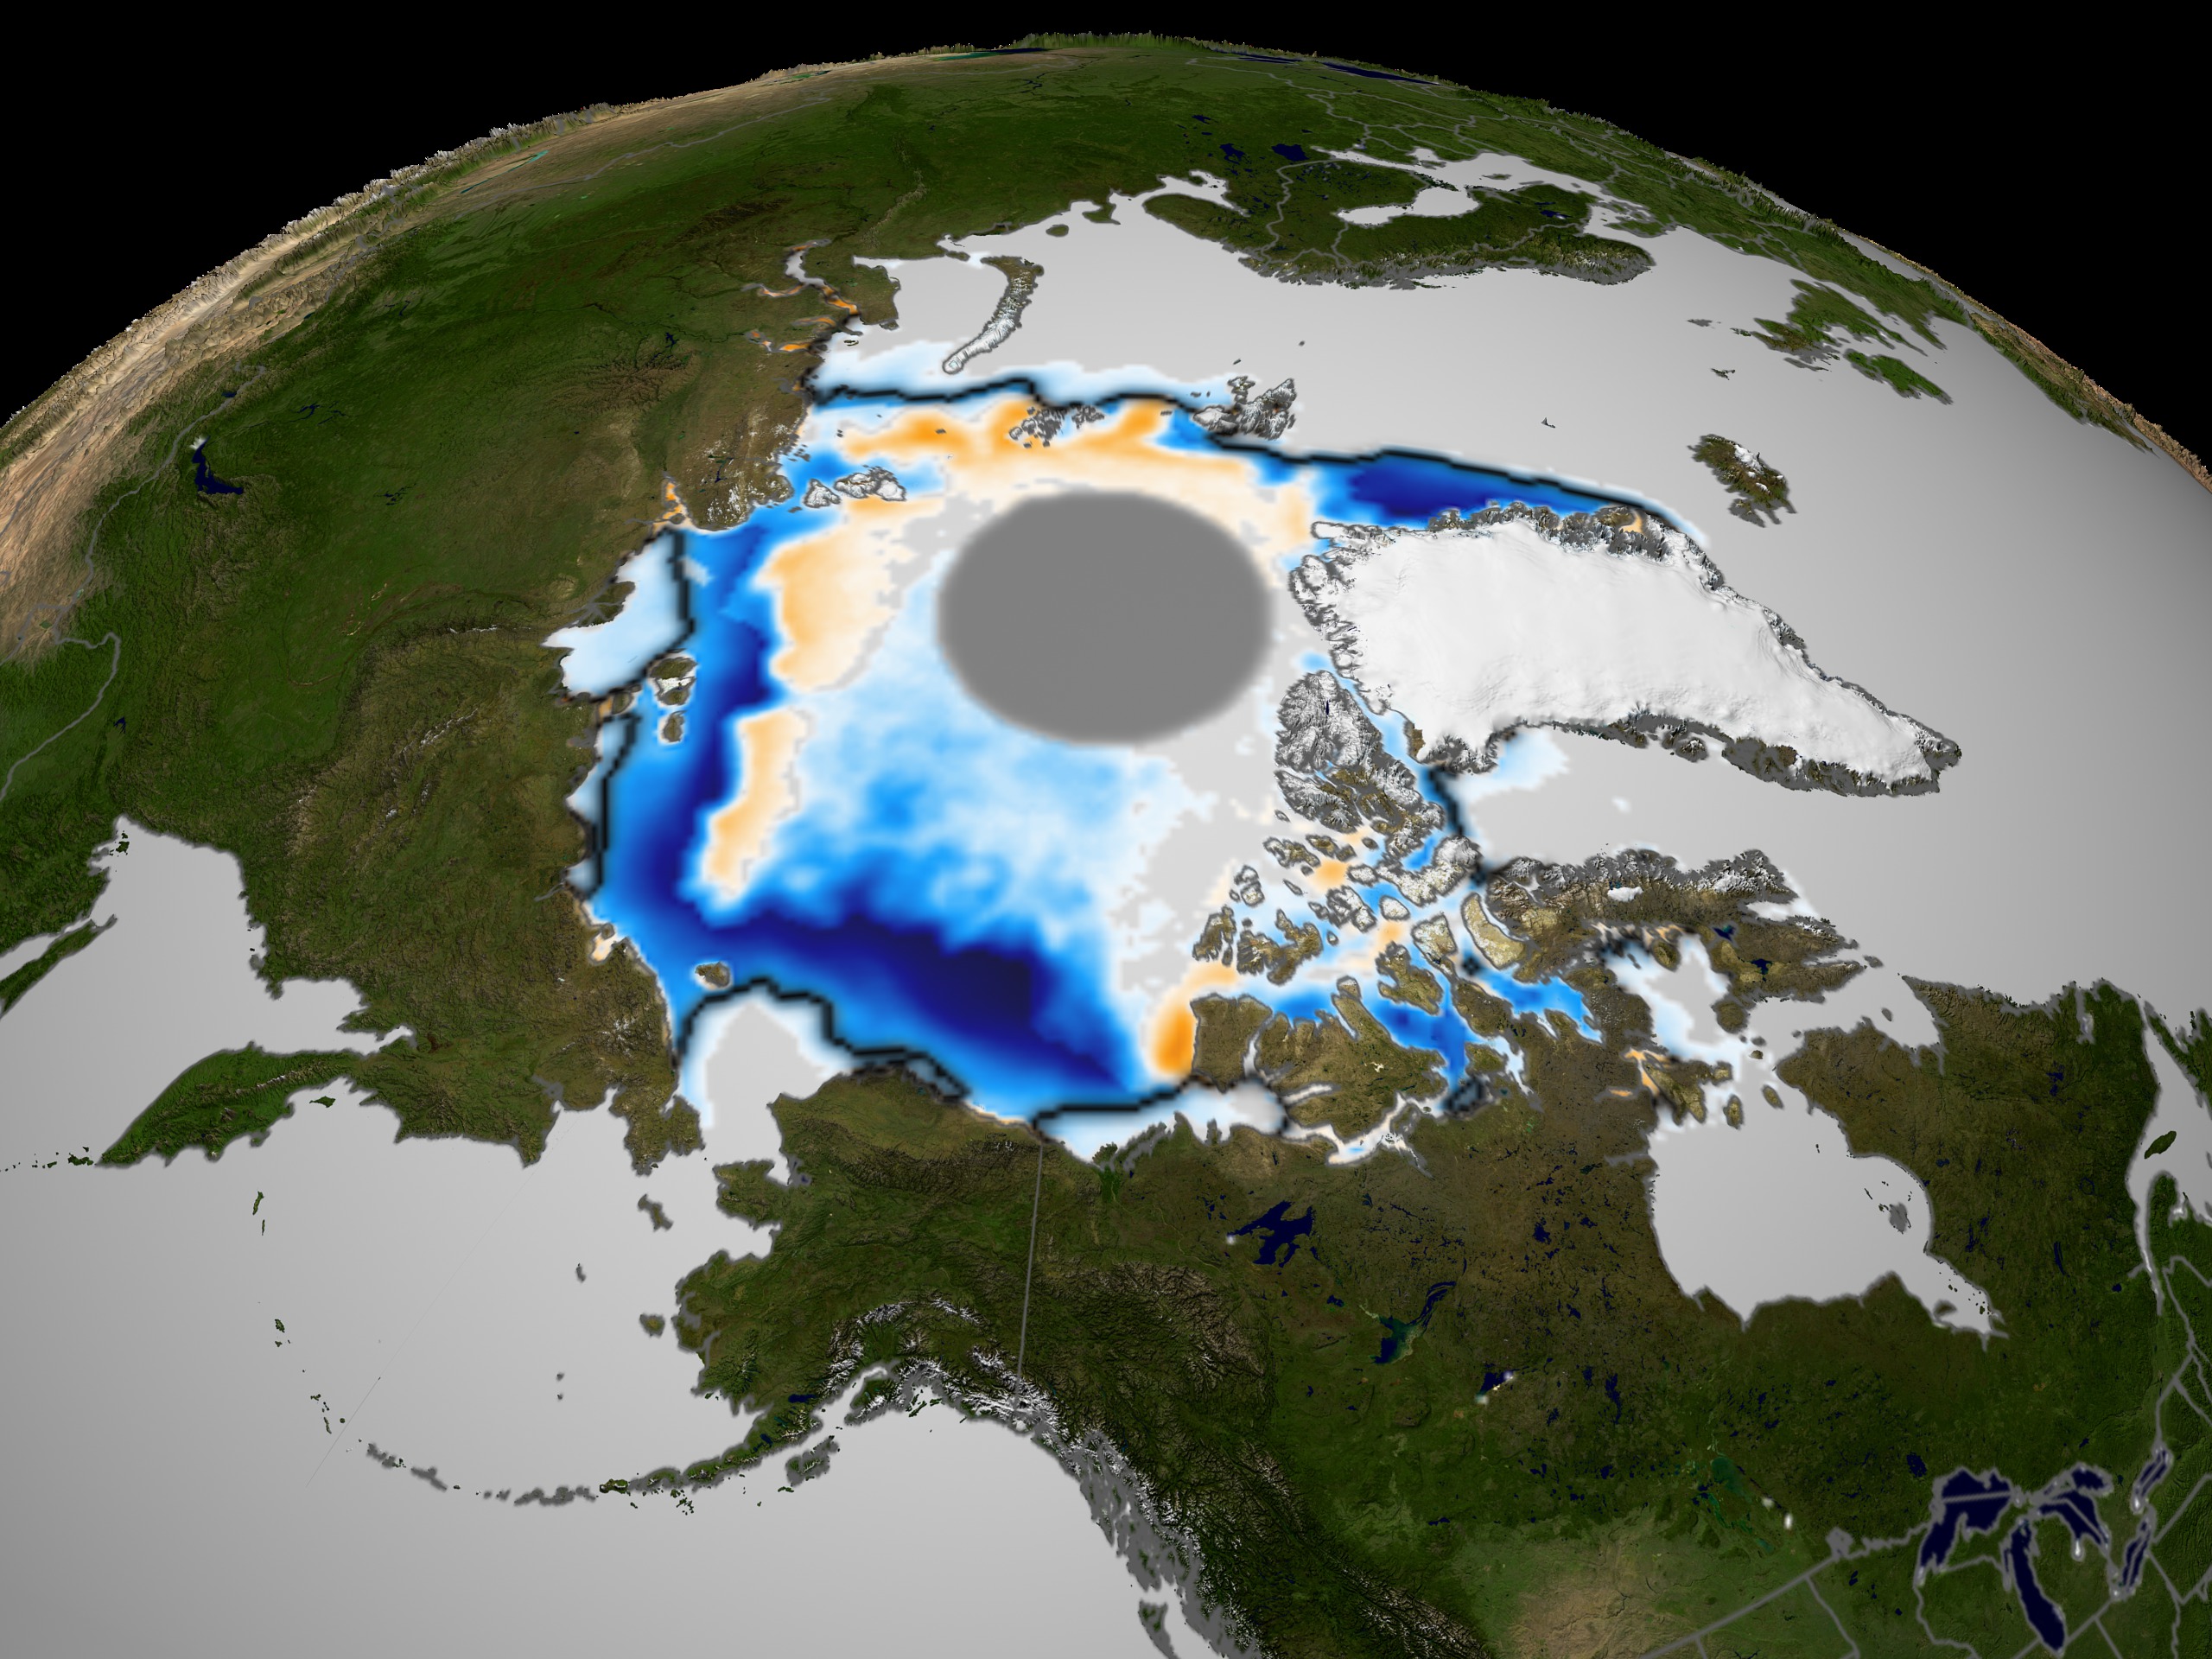
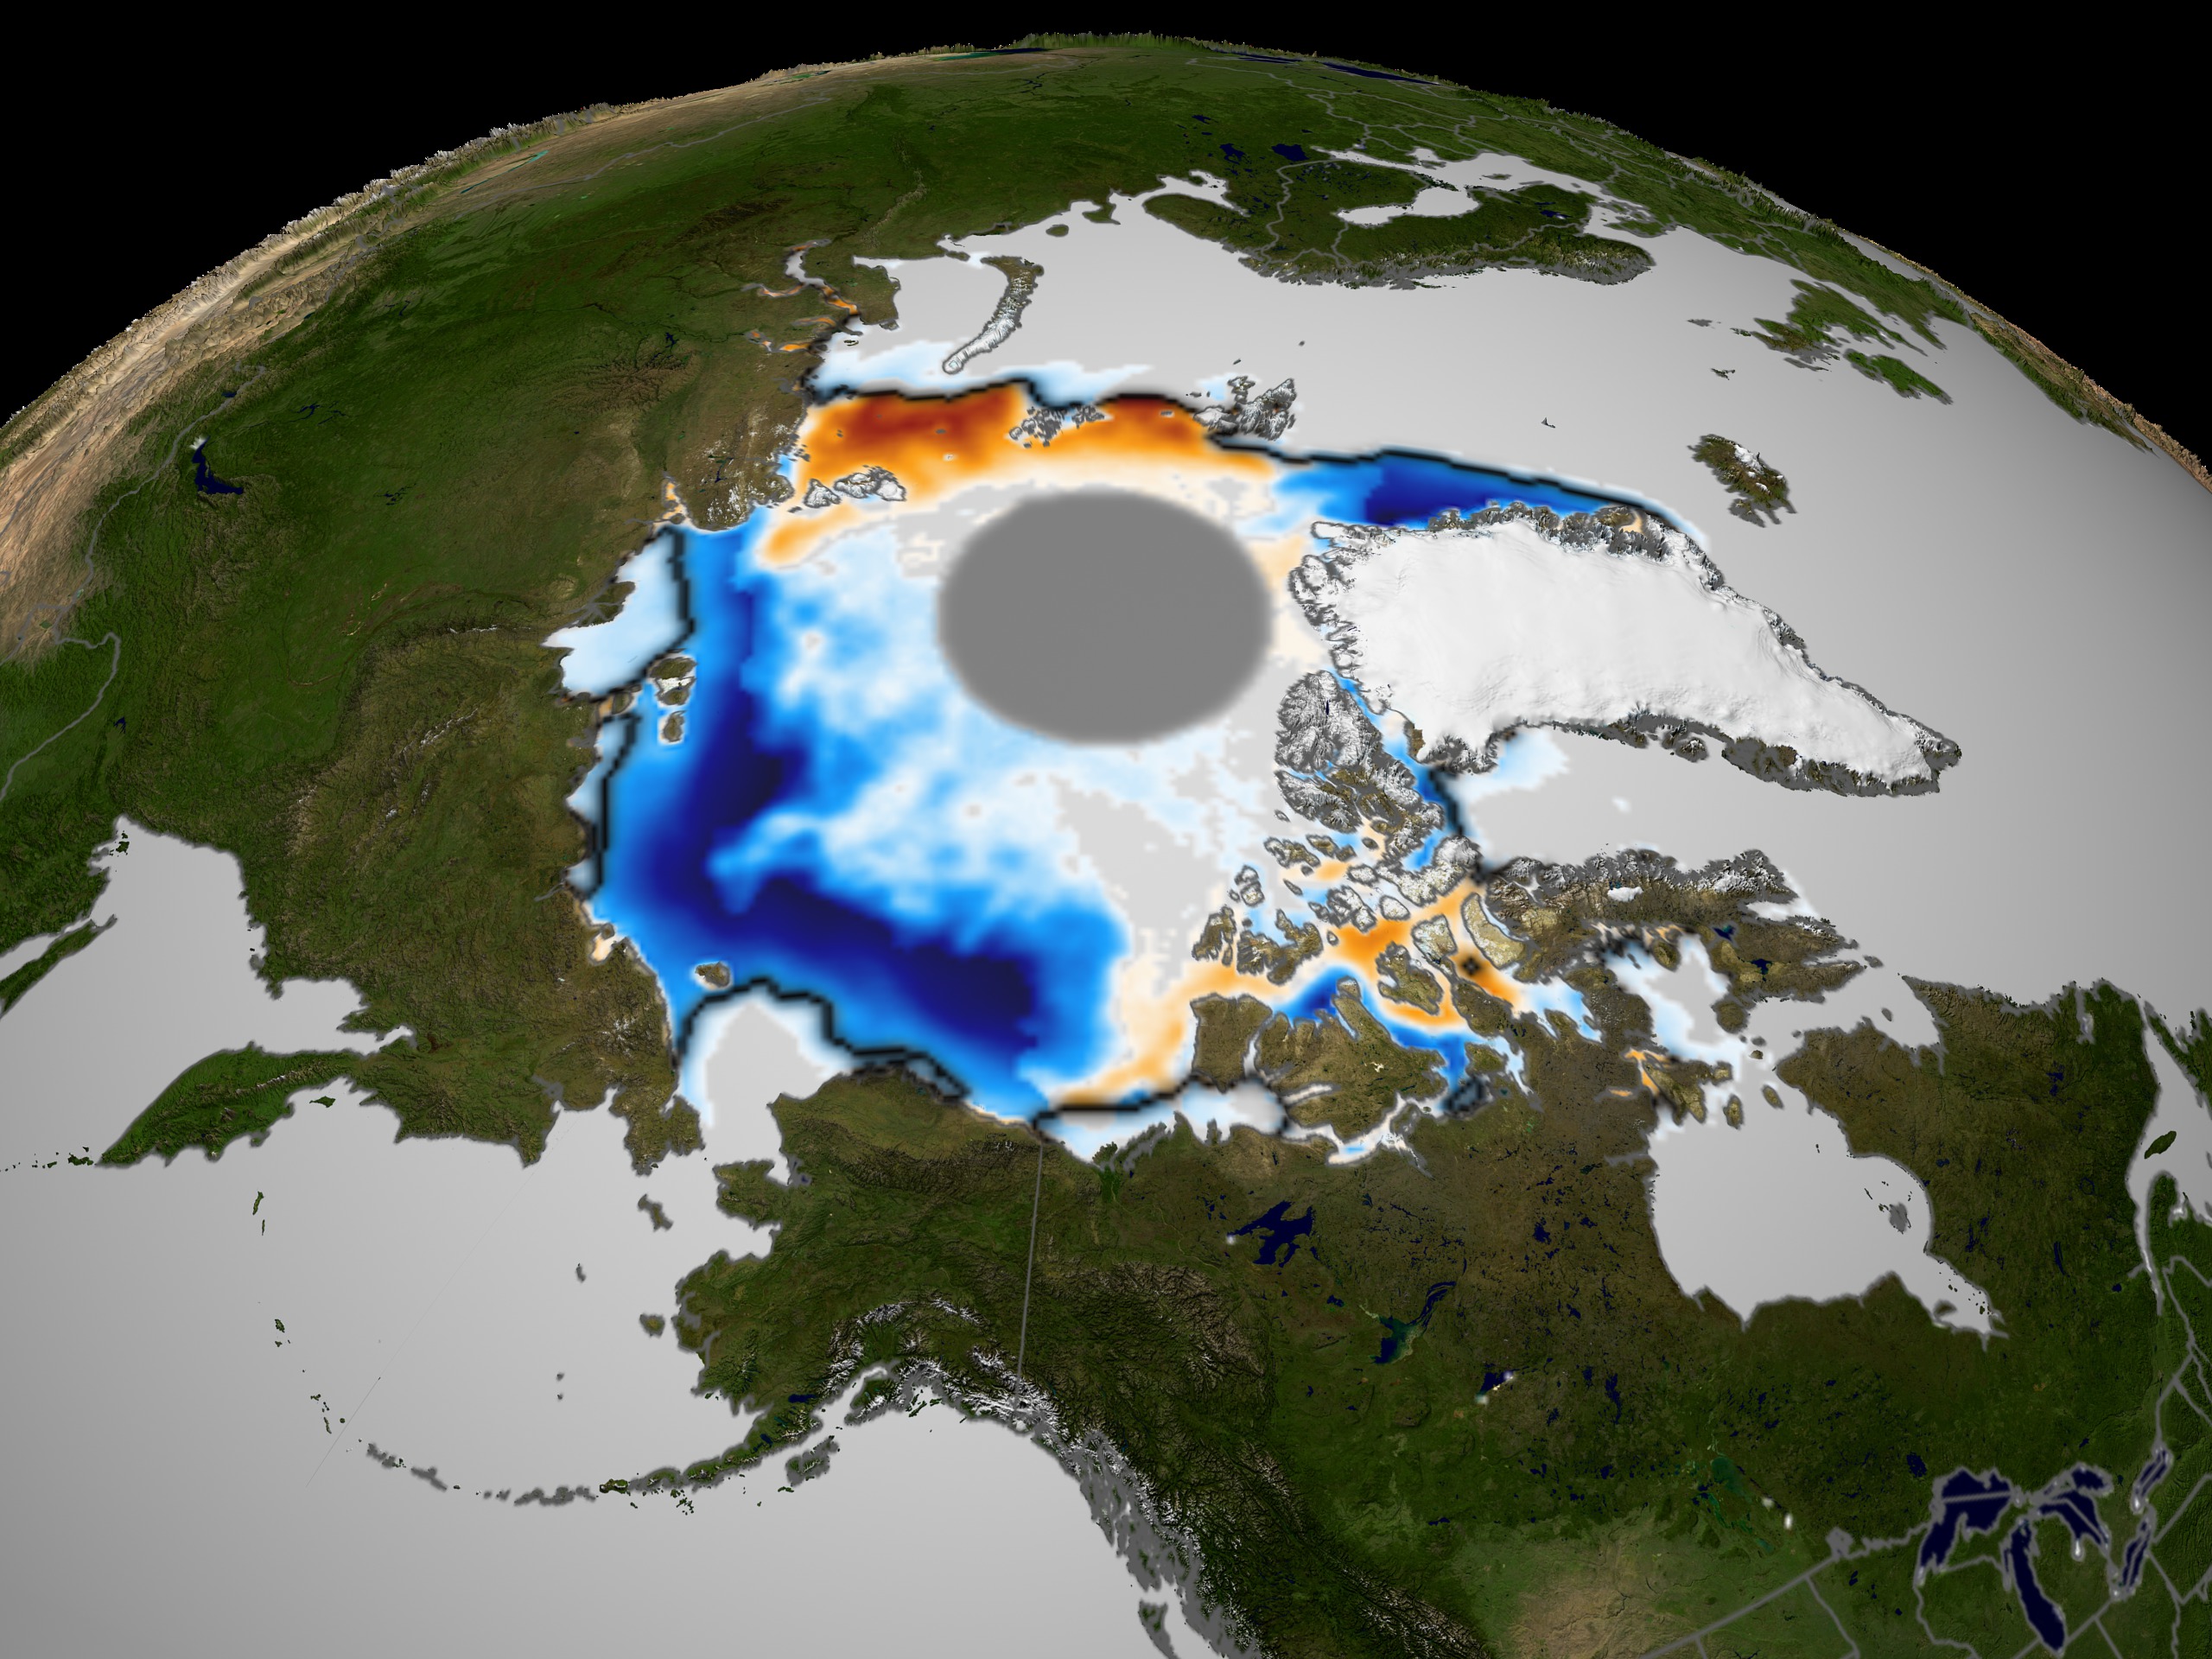
September Mean Sea Ice Concentration Anomaly fade from 2002 to 2003 with Mean Ice Extent Contour
Visualization Credits
Please give credit for this item to:
NASA/Goddard Space Flight Center Scientific Visualization Studio
NASA/Goddard Space Flight Center Scientific Visualization Studio
Short URL to share this page:
https://svs.gsfc.nasa.gov/2931
Data Used:
Note: While we identify the data sets used in these visualizations, we do not store any further details nor the data sets themselves on our site.
Dates of Data Used:
September 2002, September 2003, September 1979-2002
This item is part of this series:
Cryosphere 2004
Keywords:
SVS >> Anomaly
DLESE >> Cryology
SVS >> Sea Ice
GCMD >> Earth Science >> Hydrosphere
GCMD >> Earth Science >> Cryosphere >> Sea Ice
GCMD >> Earth Science >> Oceans >> Sea Ice >> Sea Ice Concentration
SVS >> For Educators
SVS >> Oceans >> Freeze/thaw
SVS >> Cryosphere >> Snow/ice
SVS >> Hydrosphere >> Ice
NASA Science >> Earth
GCMD keywords can be found on the Internet with the following citation: Olsen, L.M., G. Major, K. Shein, J. Scialdone, S. Ritz, T. Stevens, M. Morahan, A. Aleman, R. Vogel, S. Leicester, H. Weir, M. Meaux, S. Grebas, C.Solomon, M. Holland, T. Northcutt, R. A. Restrepo, R. Bilodeau, 2013. NASA/Global Change Master Directory (GCMD) Earth Science Keywords. Version 8.0.0.0.0
https://svs.gsfc.nasa.gov/2931
Data Used:
DMSP/SSM/I/15% Mean Sea Ice Extent Contour for September also referred to as: Passive Microwave Data
1979-2002DMSP/SSM/I/September Sea Ice Concentration Anomaly
September 2002Nimbus-7/SSMR/15% Mean Sea Ice Extent Contour for September also referred to as: Passive Microwave Data
Septembers during 1979-2002Nimbus-7/SSMR/September Sea Ice Concentration Anomaly
September 2003Dates of Data Used:
September 2002, September 2003, September 1979-2002
This item is part of this series:
Cryosphere 2004
Keywords:
SVS >> Anomaly
DLESE >> Cryology
SVS >> Sea Ice
GCMD >> Earth Science >> Hydrosphere
GCMD >> Earth Science >> Cryosphere >> Sea Ice
GCMD >> Earth Science >> Oceans >> Sea Ice >> Sea Ice Concentration
SVS >> For Educators
SVS >> Oceans >> Freeze/thaw
SVS >> Cryosphere >> Snow/ice
SVS >> Hydrosphere >> Ice
NASA Science >> Earth
GCMD keywords can be found on the Internet with the following citation: Olsen, L.M., G. Major, K. Shein, J. Scialdone, S. Ritz, T. Stevens, M. Morahan, A. Aleman, R. Vogel, S. Leicester, H. Weir, M. Meaux, S. Grebas, C.Solomon, M. Holland, T. Northcutt, R. A. Restrepo, R. Bilodeau, 2013. NASA/Global Change Master Directory (GCMD) Earth Science Keywords. Version 8.0.0.0.0


