Earth
ID: 2930
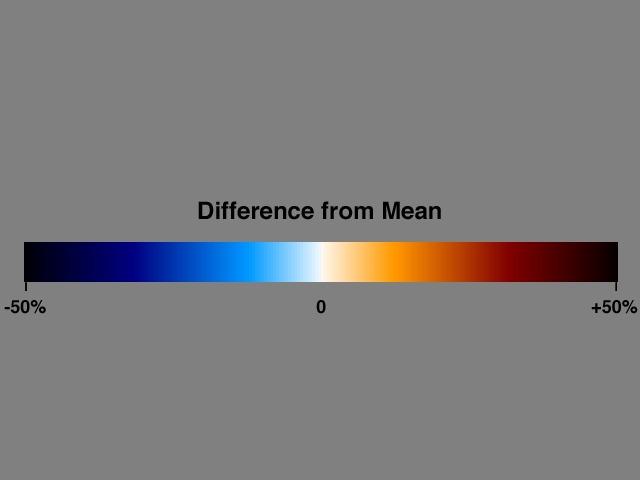
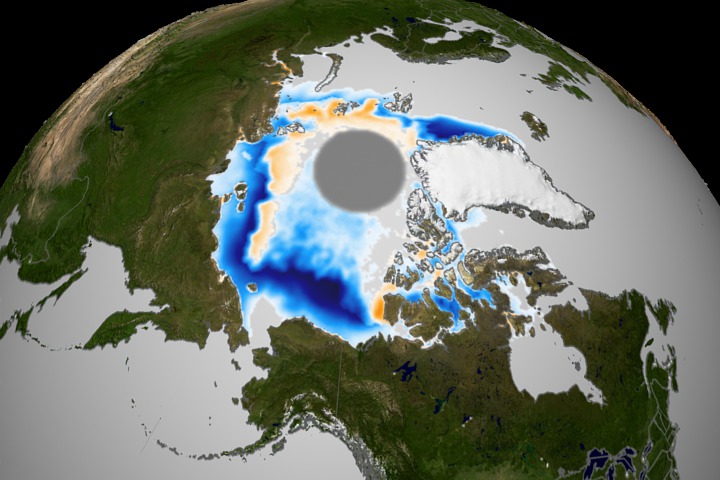
This animation fades between the September mean sea ice concentration anomaly for the years 2002 and 2003. Blue values indicate a loss in sea ice concentration while red values indicate an increase.
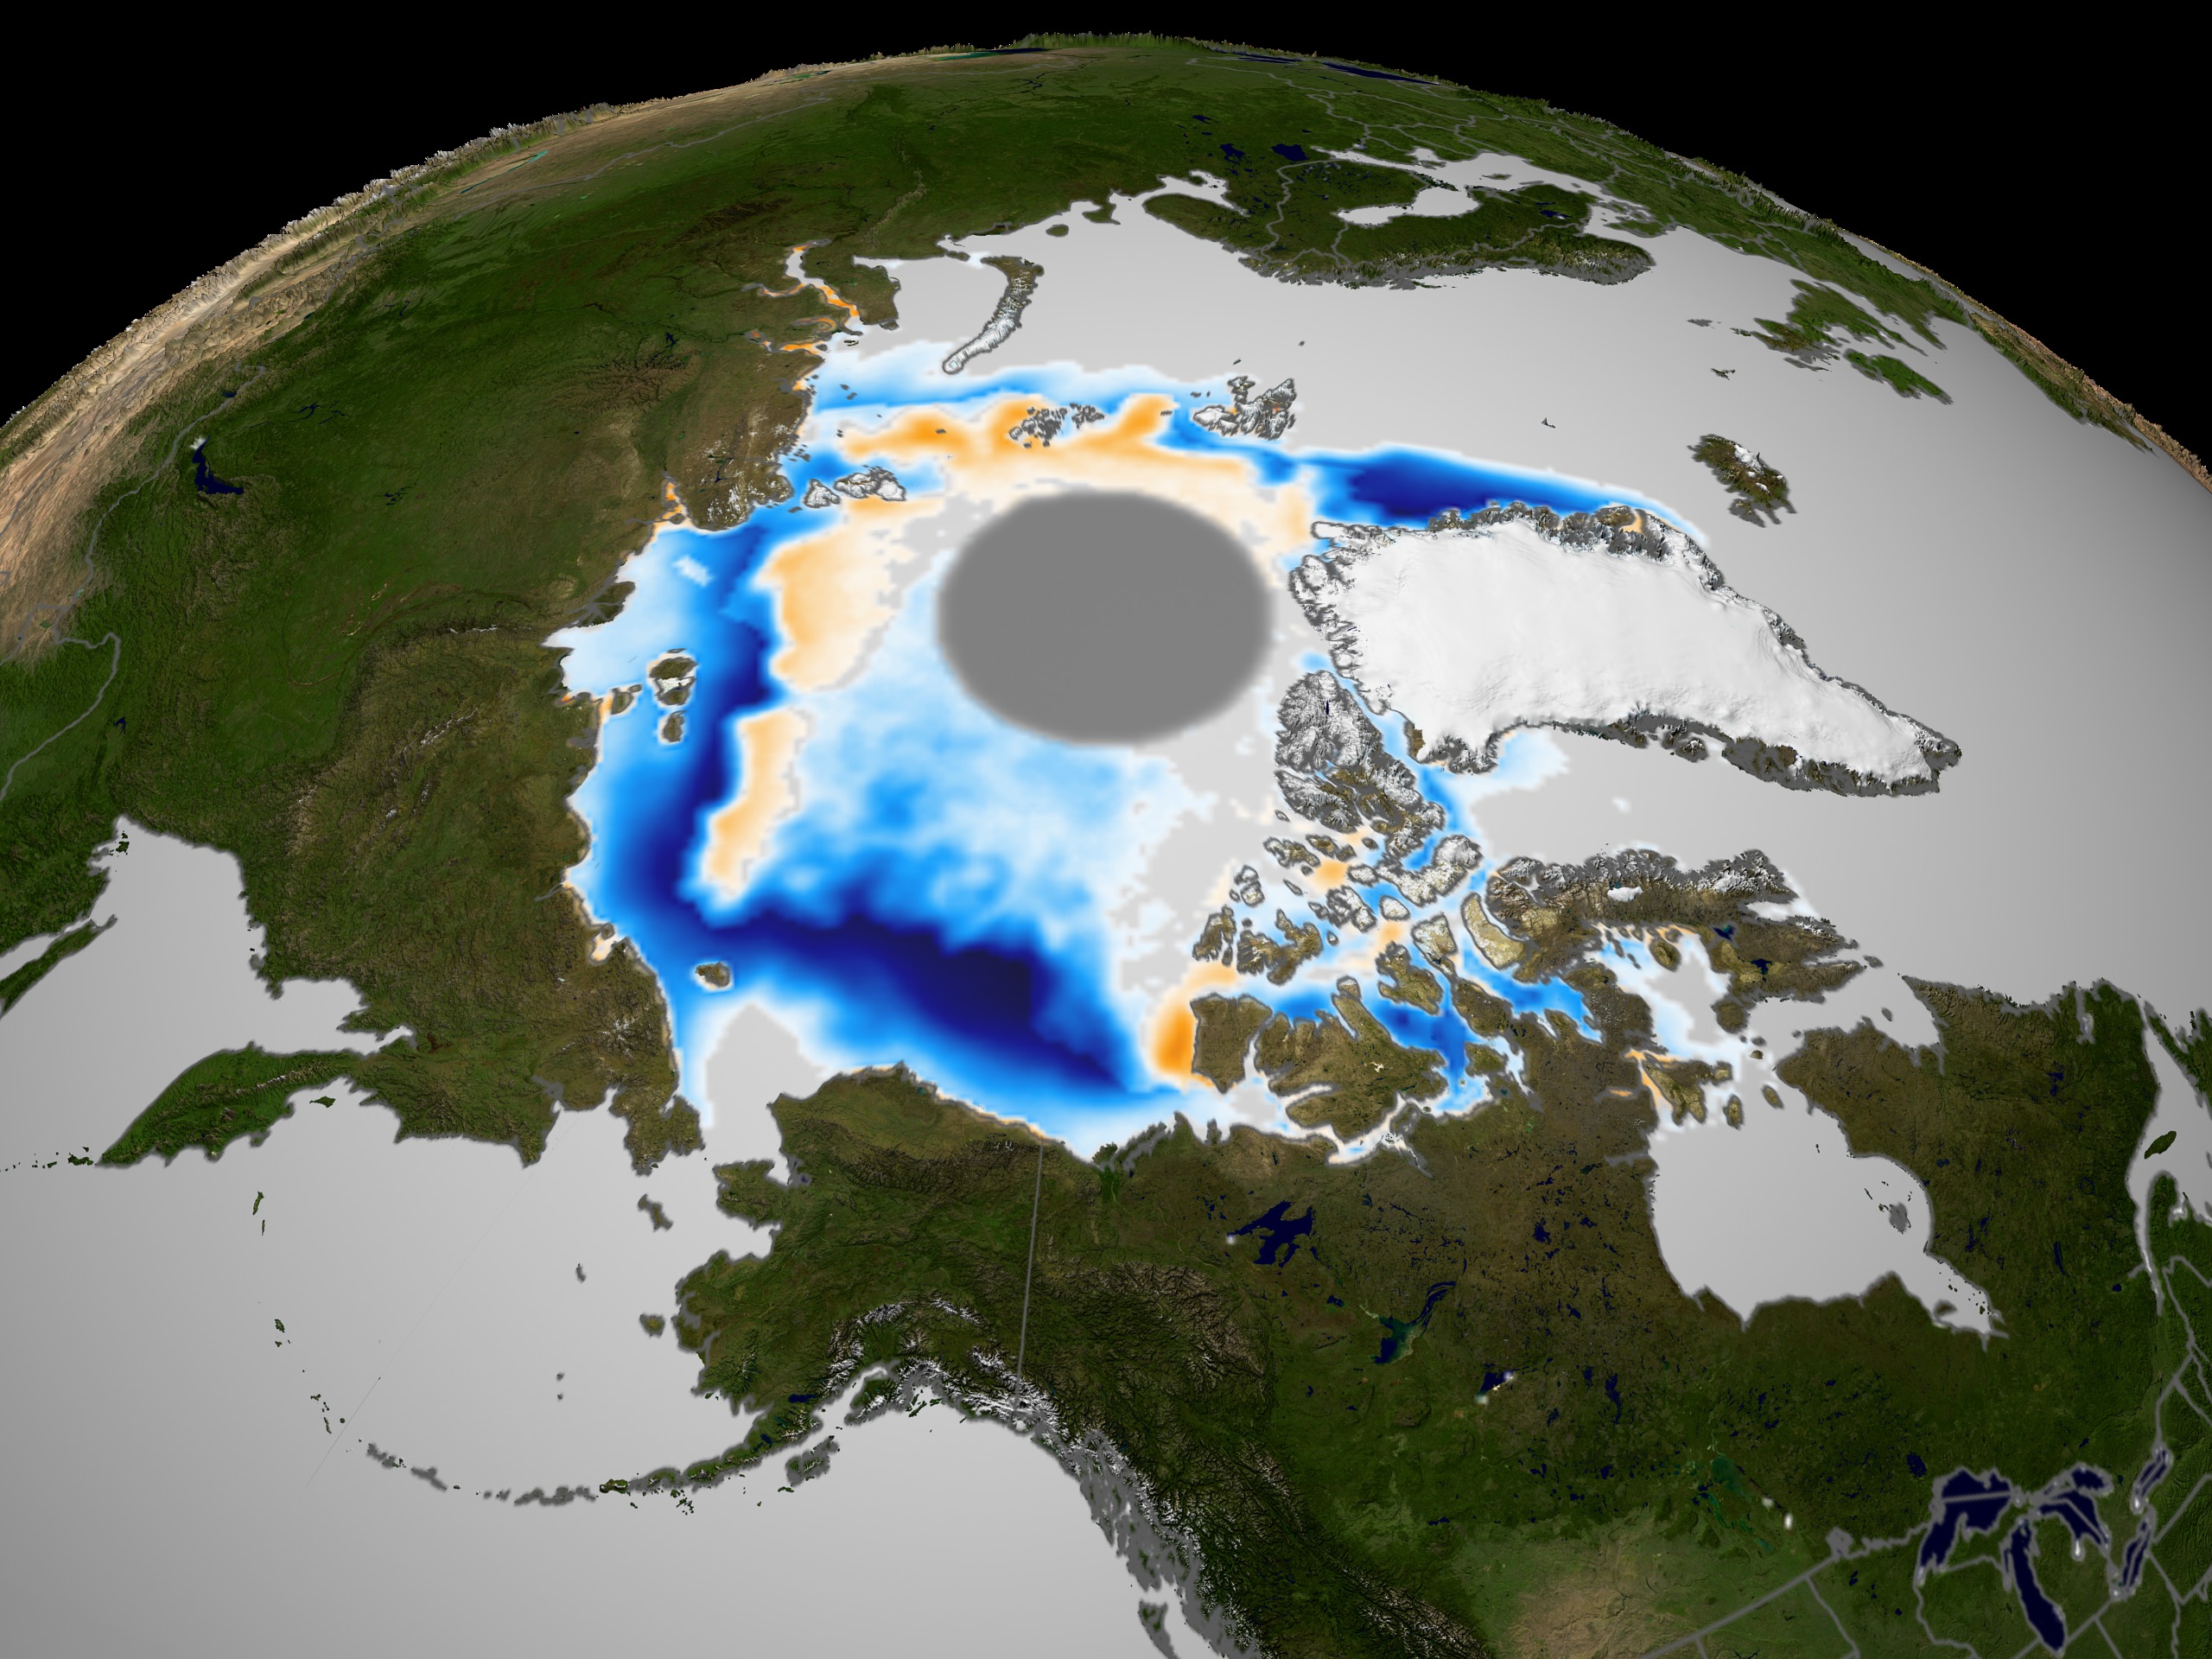
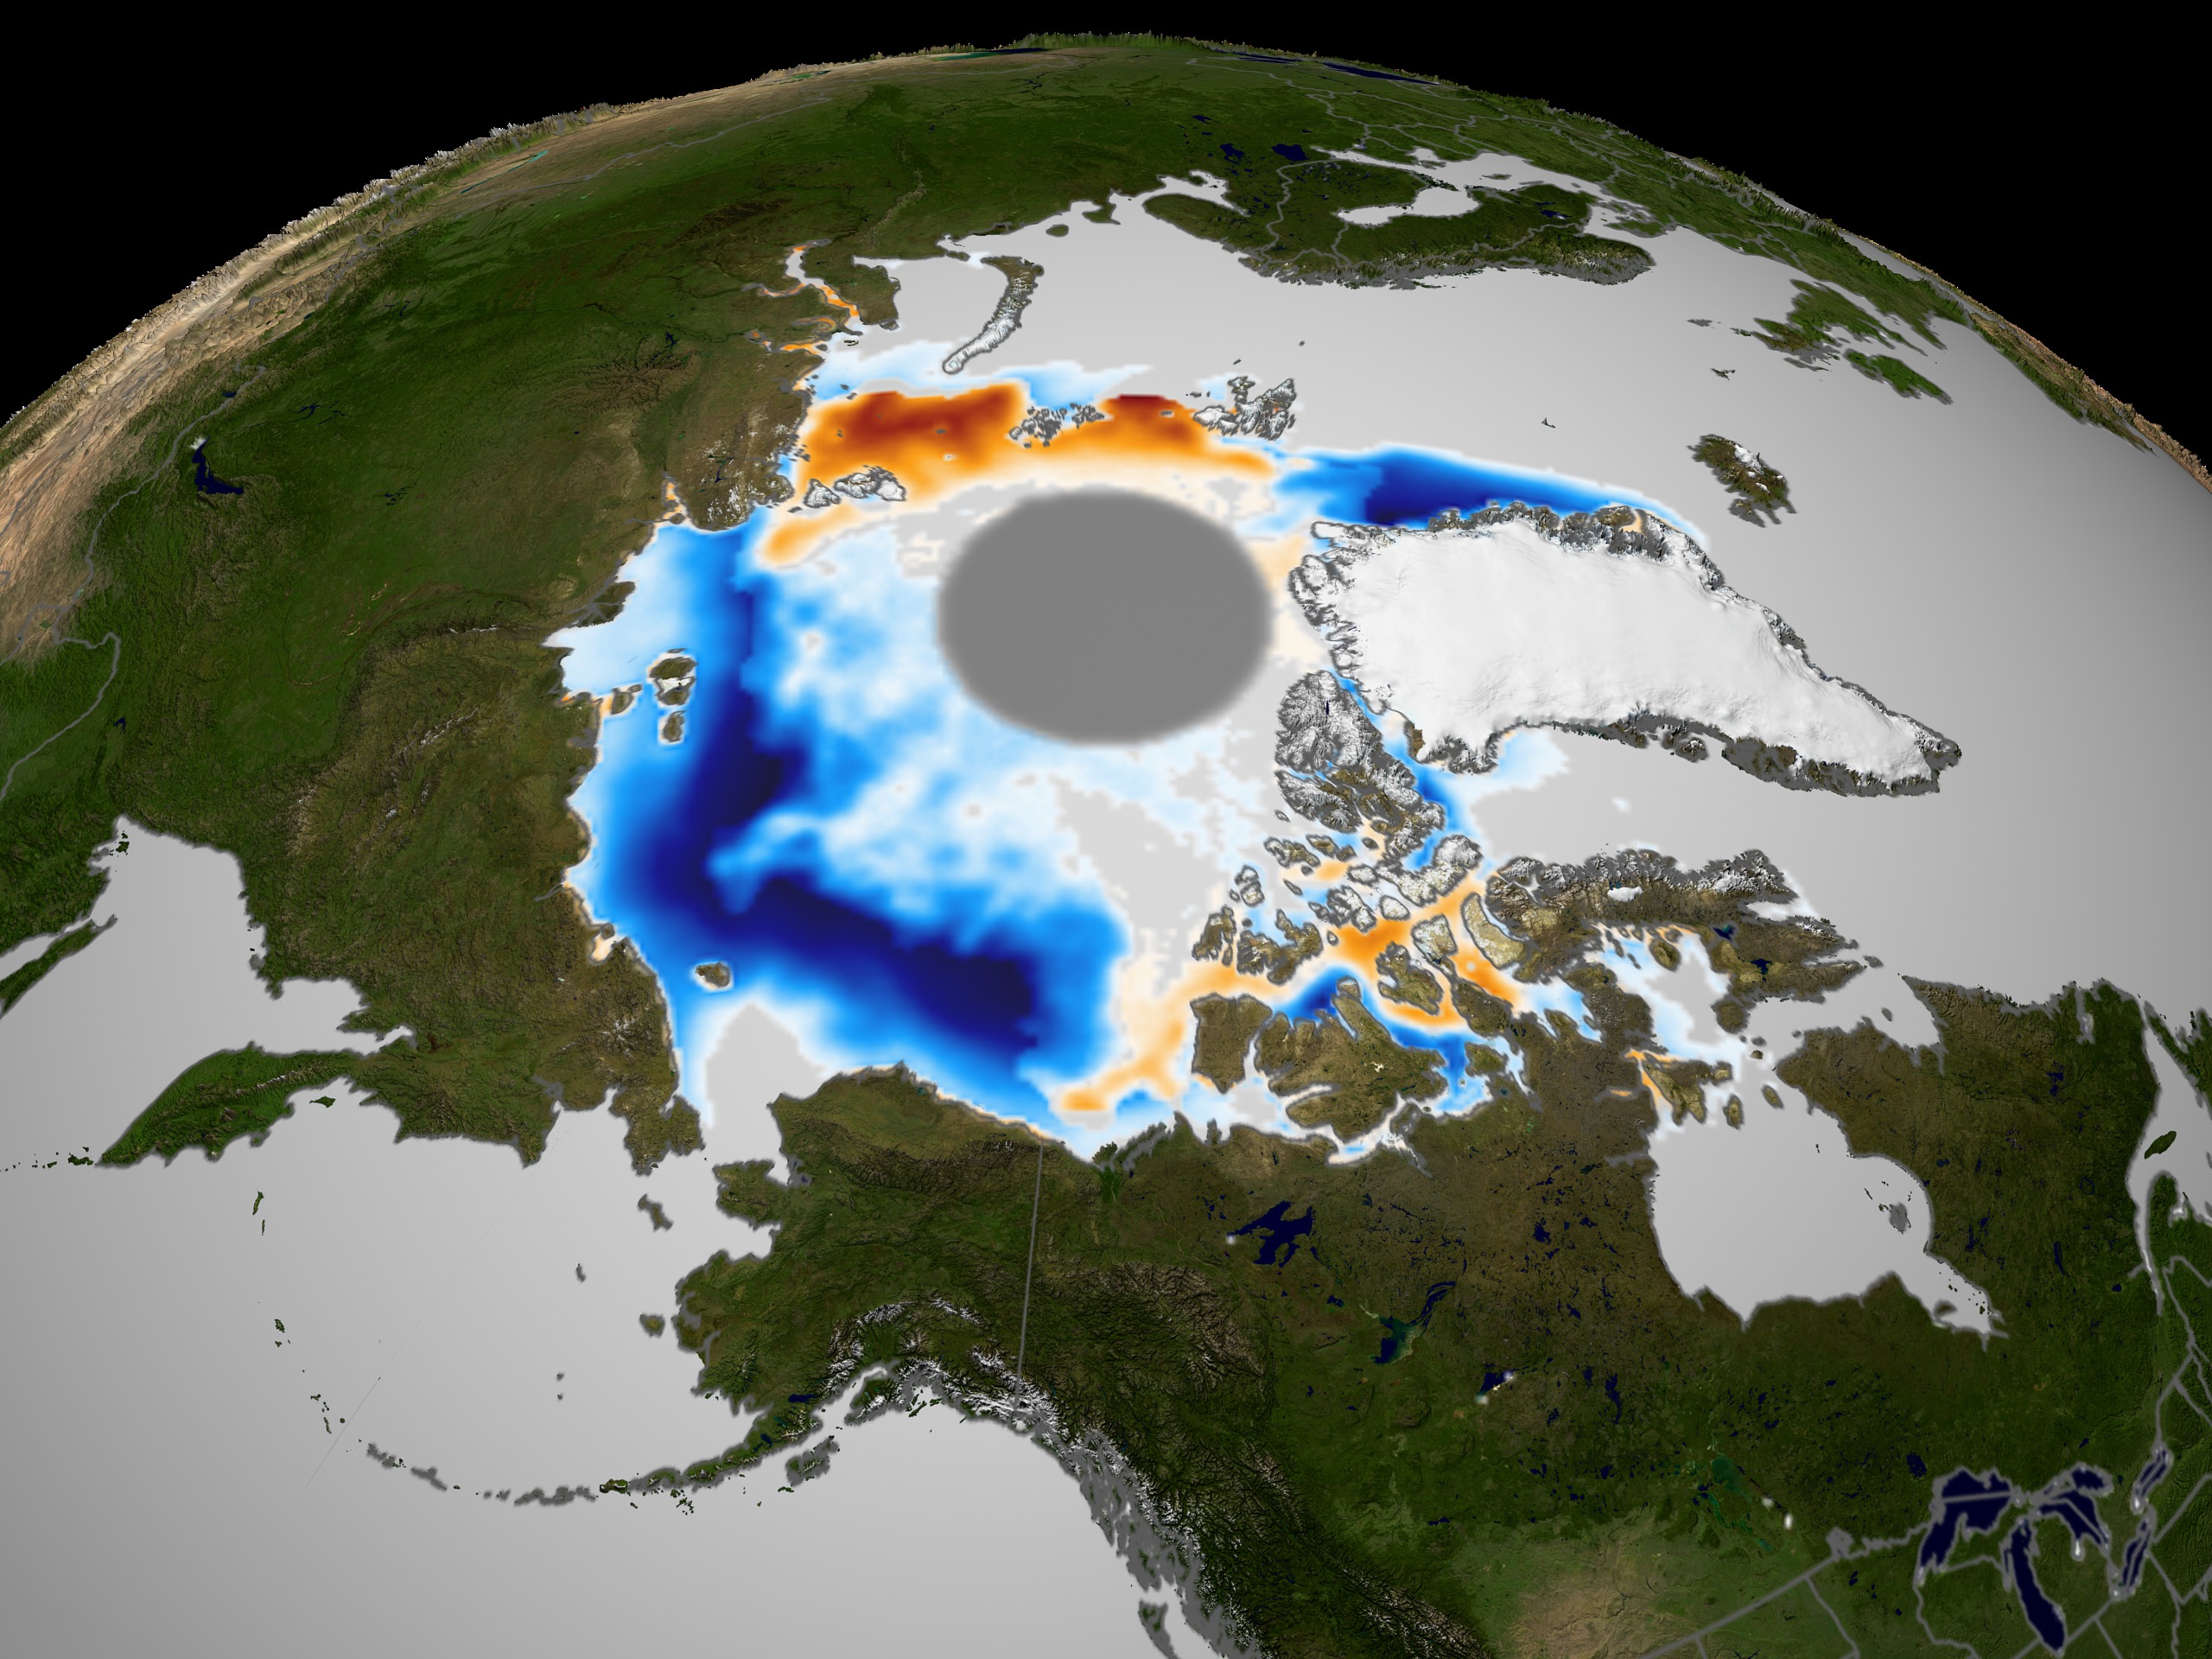
September Mean Sea Ice Concentration Anomaly fade from 2002 to 2003
Visualization Credits
Please give credit for this item to:
NASA/Goddard Space Flight Center Scientific Visualization Studio
NASA/Goddard Space Flight Center Scientific Visualization Studio
Short URL to share this page:
https://svs.gsfc.nasa.gov/2930
Data Used:
Note: While we identify the data sets used in these visualizations, we do not store any further details nor the data sets themselves on our site.
This item is part of this series:
Cryosphere 2004
Keywords:
SVS >> Anomaly
DLESE >> Cryology
SVS >> Sea Ice
GCMD >> Earth Science >> Hydrosphere
GCMD >> Earth Science >> Cryosphere >> Sea Ice
GCMD >> Earth Science >> Oceans >> Sea Ice >> Sea Ice Concentration
SVS >> For Educators
SVS >> Oceans >> Freeze/thaw
SVS >> Cryosphere >> Snow/ice
SVS >> Hydrosphere >> Ice
NASA Science >> Earth
GCMD keywords can be found on the Internet with the following citation: Olsen, L.M., G. Major, K. Shein, J. Scialdone, S. Ritz, T. Stevens, M. Morahan, A. Aleman, R. Vogel, S. Leicester, H. Weir, M. Meaux, S. Grebas, C.Solomon, M. Holland, T. Northcutt, R. A. Restrepo, R. Bilodeau, 2013. NASA/Global Change Master Directory (GCMD) Earth Science Keywords. Version 8.0.0.0.0
https://svs.gsfc.nasa.gov/2930
Data Used:
DMSP/SSM/I/September Sea Ice Concentration Anomaly
September 2002Nimbus-7/SSMR/September Sea Ice Concentration Anomaly
September 2003This item is part of this series:
Cryosphere 2004
Keywords:
SVS >> Anomaly
DLESE >> Cryology
SVS >> Sea Ice
GCMD >> Earth Science >> Hydrosphere
GCMD >> Earth Science >> Cryosphere >> Sea Ice
GCMD >> Earth Science >> Oceans >> Sea Ice >> Sea Ice Concentration
SVS >> For Educators
SVS >> Oceans >> Freeze/thaw
SVS >> Cryosphere >> Snow/ice
SVS >> Hydrosphere >> Ice
NASA Science >> Earth
GCMD keywords can be found on the Internet with the following citation: Olsen, L.M., G. Major, K. Shein, J. Scialdone, S. Ritz, T. Stevens, M. Morahan, A. Aleman, R. Vogel, S. Leicester, H. Weir, M. Meaux, S. Grebas, C.Solomon, M. Holland, T. Northcutt, R. A. Restrepo, R. Bilodeau, 2013. NASA/Global Change Master Directory (GCMD) Earth Science Keywords. Version 8.0.0.0.0


