Earth
ID: 2925
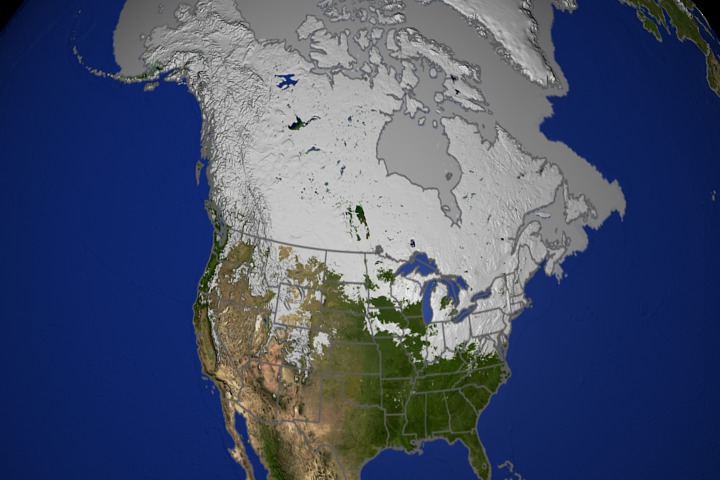
This animation shows daily snow cover over North America from September 1, 2002 through June 30, 2003. A permafrost map shown in frost-green indicates where the ground is frozen throughout the year. The sea ice climatology indicates the average extent of the sea ice during each month.
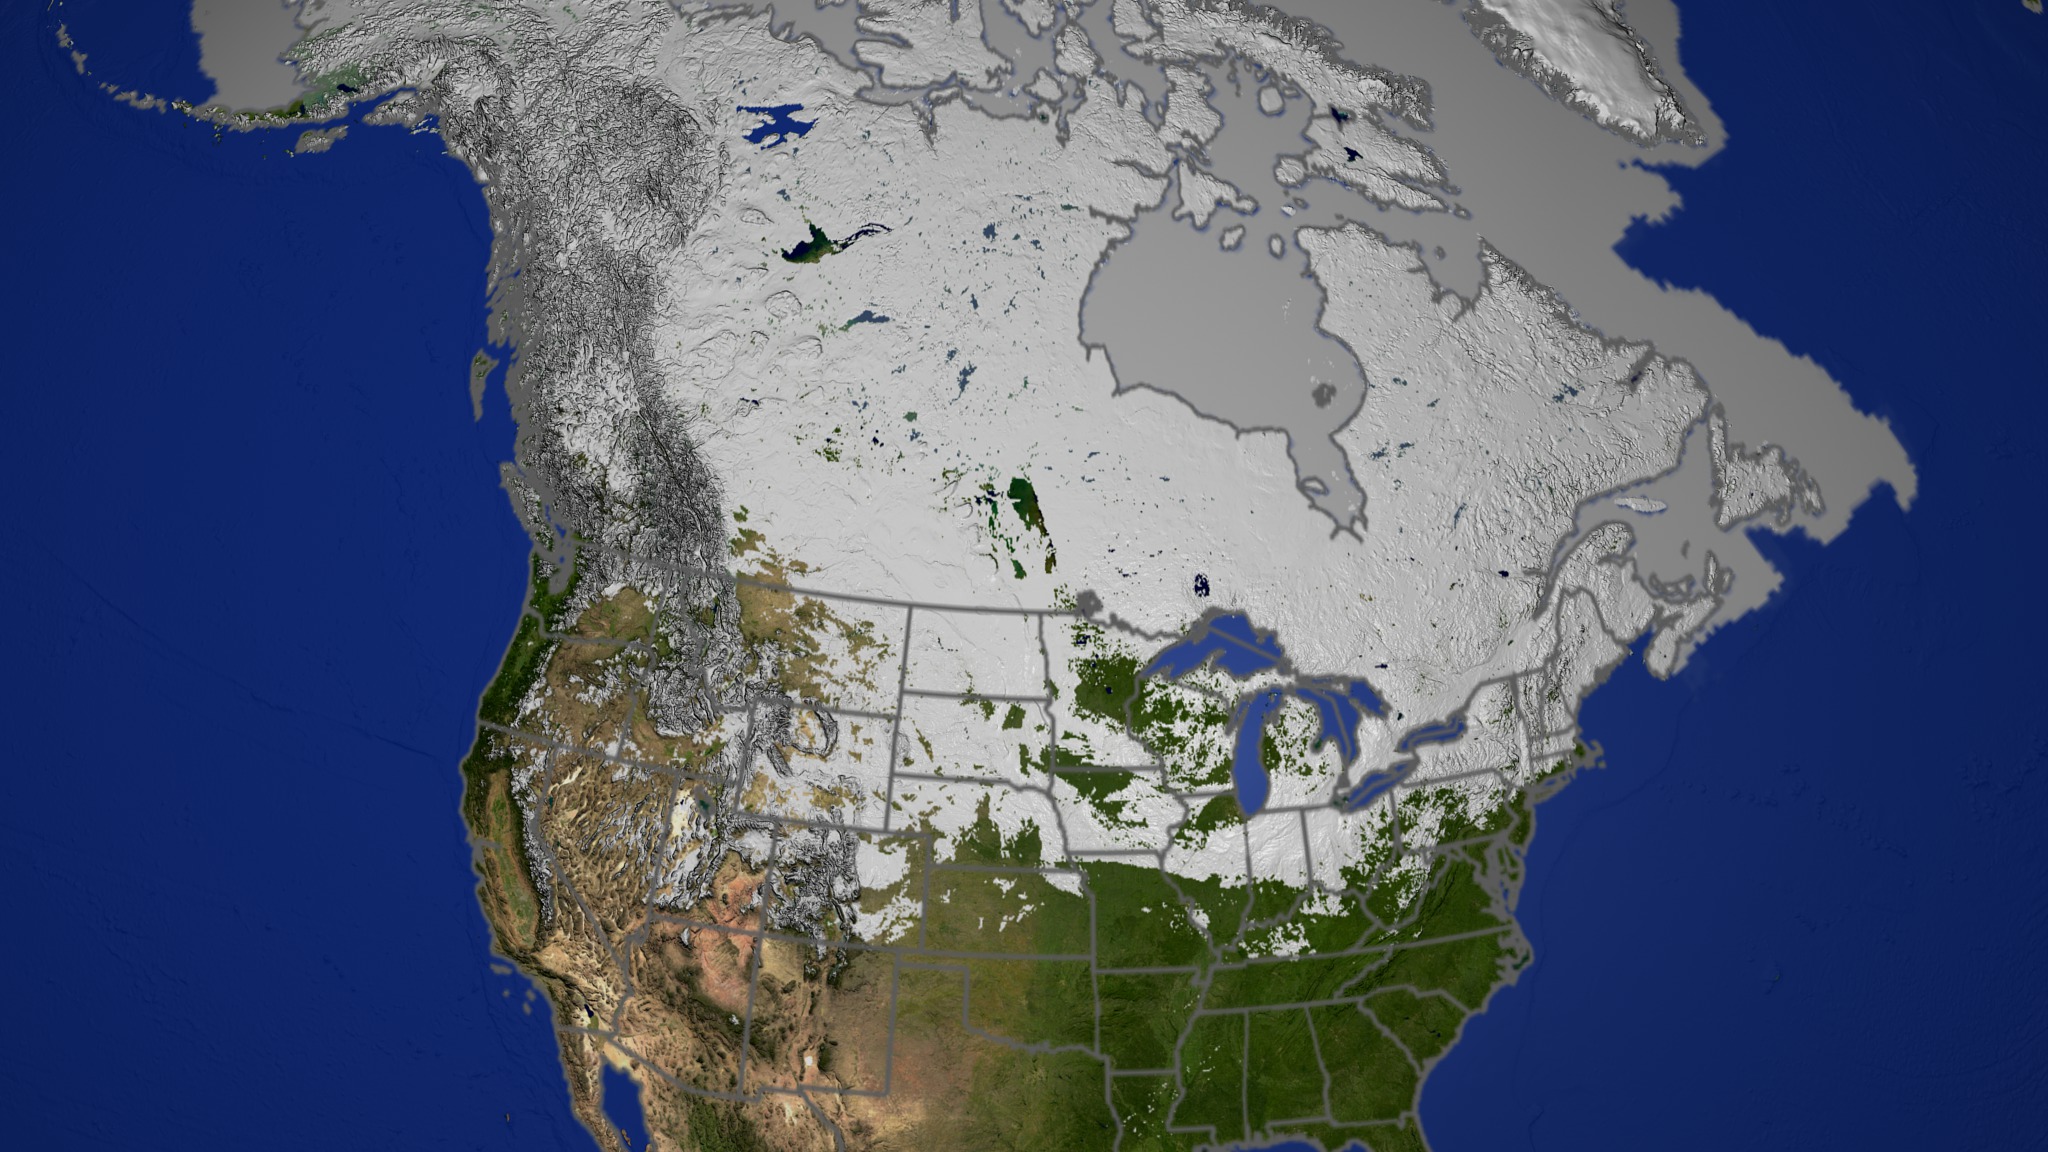
Daily Snow over North America 2002-2003 with Permafrost Map
Visualization Credits
Cindy Starr (Global Science and Technology, Inc.): Lead Visualizer
Dorothy Hall (NASA/GSFC): Scientist
Dorothy Hall (NASA/GSFC): Scientist
Please give credit for this item to:
NASA/Goddard Space Flight Center Scientific Visualization Studio, and Mary Jo Brodzik (NSIDC)
NASA/Goddard Space Flight Center Scientific Visualization Studio, and Mary Jo Brodzik (NSIDC)
Short URL to share this page:
https://svs.gsfc.nasa.gov/2925
Mission:
Terra
Data Used:
Note: While we identify the data sets used in these visualizations, we do not store any further details nor the data sets themselves on our site.
Keywords:
DLESE >> Cryology
SVS >> Seasons
SVS >> Snow Cover
GCMD >> Earth Science >> Atmosphere >> Precipitation >> Snow
GCMD >> Earth Science >> Cryosphere >> Snow/Ice >> Permafrost
GCMD >> Location >> North America
SVS >> For Educators
SVS >> Seasons >> Vegetation
NASA Science >> Earth
GCMD keywords can be found on the Internet with the following citation: Olsen, L.M., G. Major, K. Shein, J. Scialdone, S. Ritz, T. Stevens, M. Morahan, A. Aleman, R. Vogel, S. Leicester, H. Weir, M. Meaux, S. Grebas, C.Solomon, M. Holland, T. Northcutt, R. A. Restrepo, R. Bilodeau, 2013. NASA/Global Change Master Directory (GCMD) Earth Science Keywords. Version 8.0.0.0.0
https://svs.gsfc.nasa.gov/2925
Mission:
Terra
Data Used:
Circum-Arctic Map of Permafrost and Ground-Ice Conditions
Data Compilation - NSIDCDMSP/SSM/I/Monthly Sea Ice Concentration Climatology
Terra/MODIS/Snow Cover Daily L3 Global 0.05Deg CMG (MOD10C1)
2002/09/01 - 2003/06/30Keywords:
DLESE >> Cryology
SVS >> Seasons
SVS >> Snow Cover
GCMD >> Earth Science >> Atmosphere >> Precipitation >> Snow
GCMD >> Earth Science >> Cryosphere >> Snow/Ice >> Permafrost
GCMD >> Location >> North America
SVS >> For Educators
SVS >> Seasons >> Vegetation
NASA Science >> Earth
GCMD keywords can be found on the Internet with the following citation: Olsen, L.M., G. Major, K. Shein, J. Scialdone, S. Ritz, T. Stevens, M. Morahan, A. Aleman, R. Vogel, S. Leicester, H. Weir, M. Meaux, S. Grebas, C.Solomon, M. Holland, T. Northcutt, R. A. Restrepo, R. Bilodeau, 2013. NASA/Global Change Master Directory (GCMD) Earth Science Keywords. Version 8.0.0.0.0


