Earth
ID: 2907
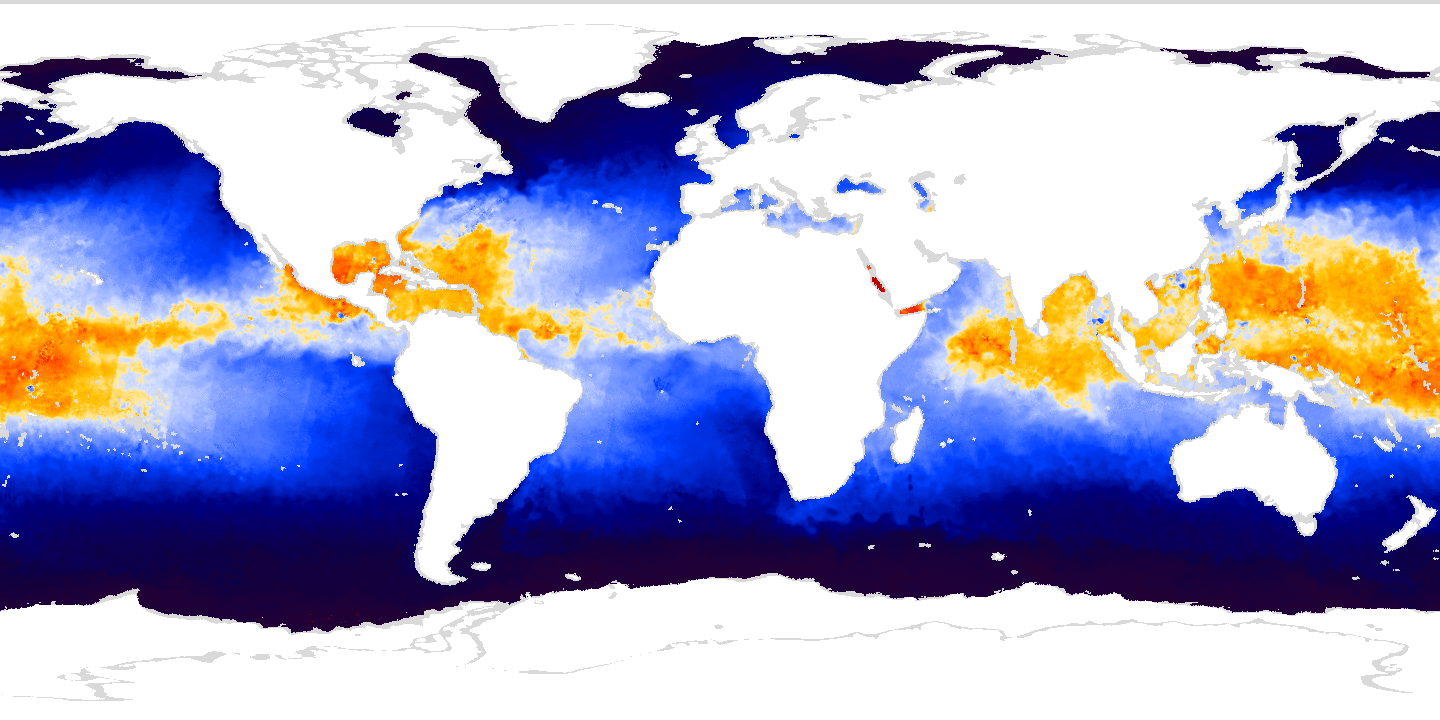
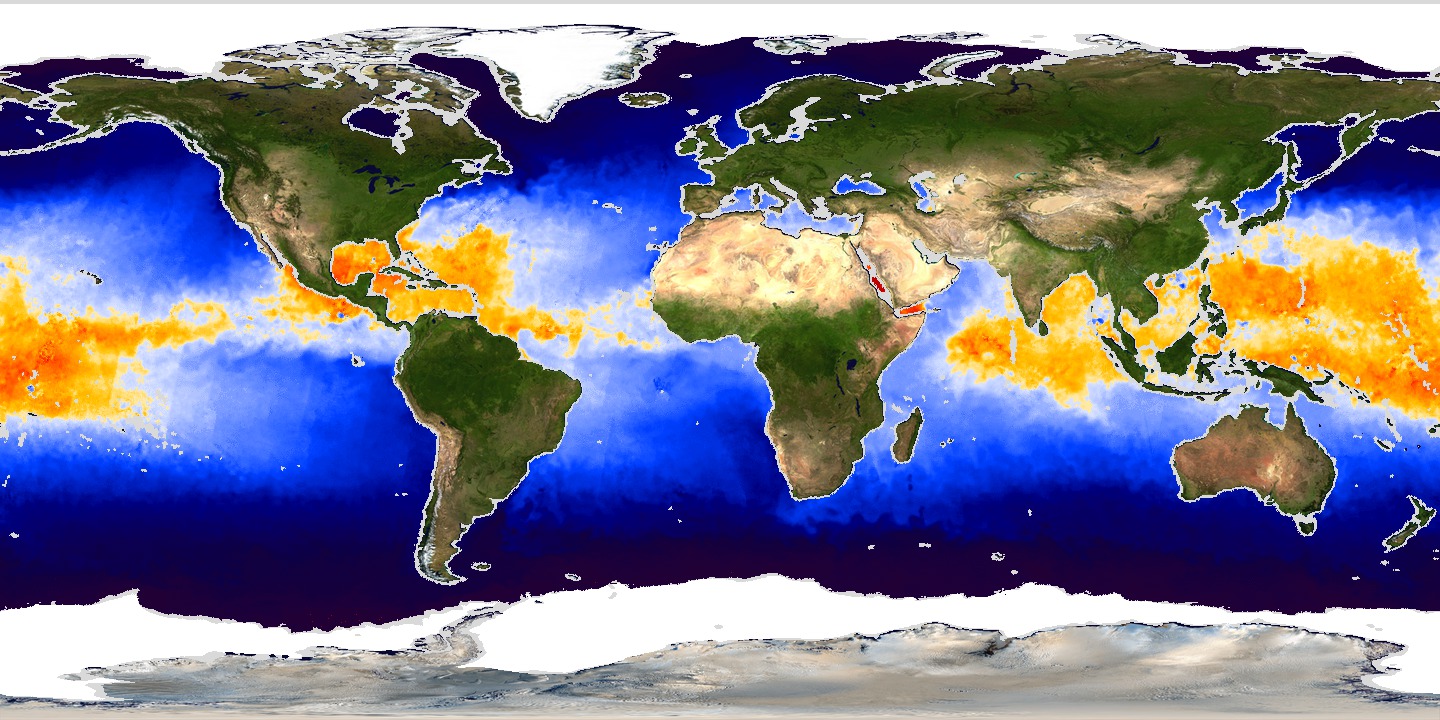
The temperature of the world's ocean surface provides a clear indication of the regions where hurricanes and typhoons form, since they can only form when the sea surface temperature exceeds 82 degrees F (27.8 degrees C). The AMSR-E instrument on the Aqua satellite measures the temperature of the top 1 millimeter of the ocean every day, even through the clouds. In this visualization of AMSR-E data covering the period from June, 2002, to September, 2003, areas with surface temperatures greater than 82 degrees F are shown in yellow and orange, while sea surface temperatures below 82 degrees F are shown in blue. The region in the Atlantic from the Caribbean to the equator only exceeds the critical temperature during late summer and early fall in the Northern Hemisphere, the period known as Hurricane Season. It is also possible to see the Gulf Stream, the warm river of water that parallels the east coast of the United States before heading towards northern Europe, in this data. Around January 1, 2003, a cooler than normal region of the ocean appears just to the west of Peru as part of an La Niña and flows westward, driven by the trade winds. The waves that appear on the edges of this cooler area are called tropical instability waves and can also be seen in the equatorial Atlantic Ocean about the same time.
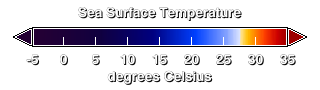
Hurricane Regions Indicated by Sea Surface Temperature from June 2002 to September 2003 (WMS)
For More Information
Visualization Credits
Eric Sokolowsky (GST): Lead Animator
Greg Shirah (NASA/GSFC): Animator
Jesse Allen (Raytheon): Animator
Frank J. Wentz (Remote Sensing Systems): Scientist
Chelle Gentemann (Remote Sensing Systems): Scientist
Greg Shirah (NASA/GSFC): Animator
Jesse Allen (Raytheon): Animator
Frank J. Wentz (Remote Sensing Systems): Scientist
Chelle Gentemann (Remote Sensing Systems): Scientist
Please give credit for this item to:
NASA/Goddard Space Flight Center Scientific Visualization Studio
NASA/Goddard Space Flight Center Scientific Visualization Studio
Short URL to share this page:
https://svs.gsfc.nasa.gov/2907
Data Used:
Note: While we identify the data sets used in these visualizations, we do not store any further details nor the data sets themselves on our site.
This item is part of this series:
WMS
Keywords:
SVS >> HDTV
DLESE >> Natural hazards
DLESE >> Physical oceanography
GCMD >> Earth Science >> Hydrosphere
GCMD >> Earth Science >> Atmosphere >> Atmospheric Phenomena >> Hurricanes
GCMD >> Earth Science >> Oceans >> Ocean Temperature >> Sea Surface Temperature
SVS >> For Educators
SVS >> Hydrosphere >> Ice
NASA Science >> Earth
GCMD keywords can be found on the Internet with the following citation: Olsen, L.M., G. Major, K. Shein, J. Scialdone, S. Ritz, T. Stevens, M. Morahan, A. Aleman, R. Vogel, S. Leicester, H. Weir, M. Meaux, S. Grebas, C.Solomon, M. Holland, T. Northcutt, R. A. Restrepo, R. Bilodeau, 2013. NASA/Global Change Master Directory (GCMD) Earth Science Keywords. Version 8.0.0.0.0
https://svs.gsfc.nasa.gov/2907
Data Used:
Aqua/AMSR-E
2002/06/02 - 2003/09/07
For more information, please click http://wwwghcc.msfc.nasa.gov/AMSR/
This item is part of this series:
WMS
Keywords:
SVS >> HDTV
DLESE >> Natural hazards
DLESE >> Physical oceanography
GCMD >> Earth Science >> Hydrosphere
GCMD >> Earth Science >> Atmosphere >> Atmospheric Phenomena >> Hurricanes
GCMD >> Earth Science >> Oceans >> Ocean Temperature >> Sea Surface Temperature
SVS >> For Educators
SVS >> Hydrosphere >> Ice
NASA Science >> Earth
GCMD keywords can be found on the Internet with the following citation: Olsen, L.M., G. Major, K. Shein, J. Scialdone, S. Ritz, T. Stevens, M. Morahan, A. Aleman, R. Vogel, S. Leicester, H. Weir, M. Meaux, S. Grebas, C.Solomon, M. Holland, T. Northcutt, R. A. Restrepo, R. Bilodeau, 2013. NASA/Global Change Master Directory (GCMD) Earth Science Keywords. Version 8.0.0.0.0


