Earth
ID: 2896
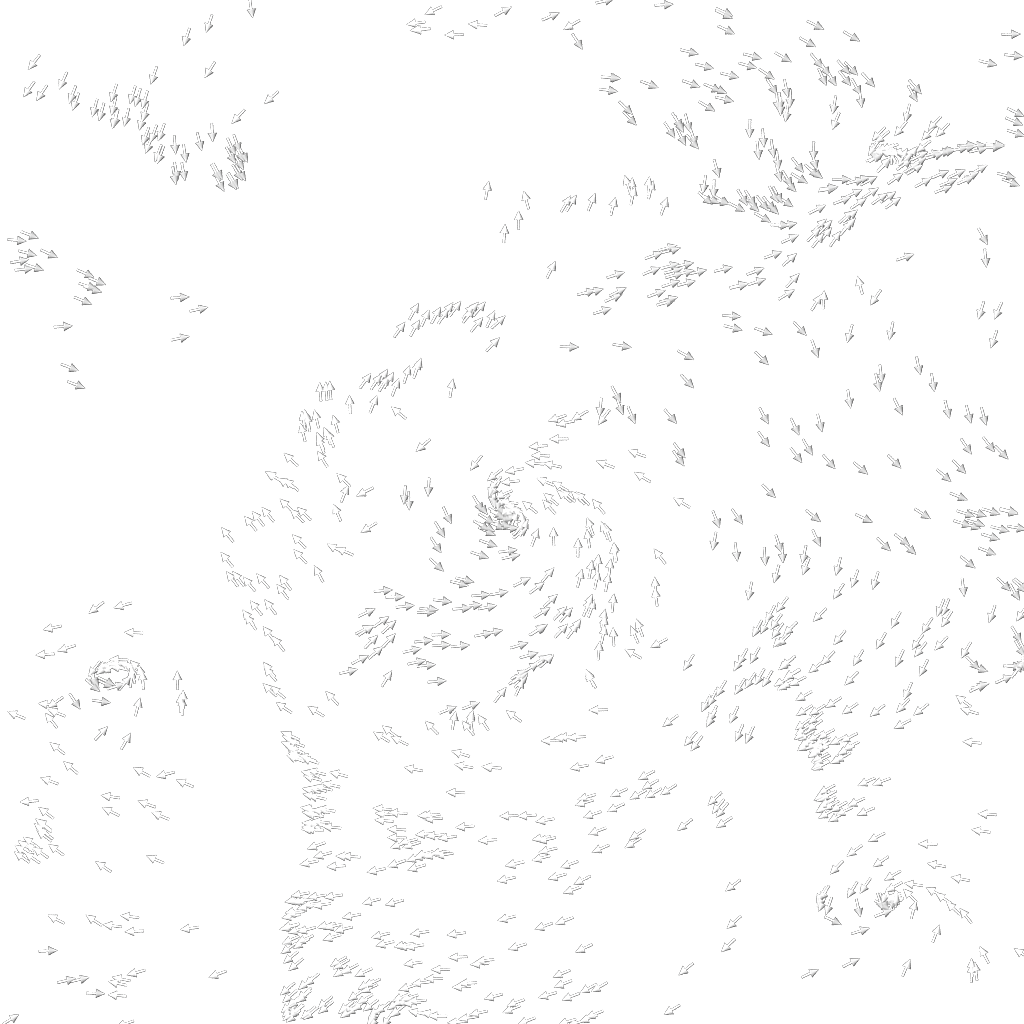
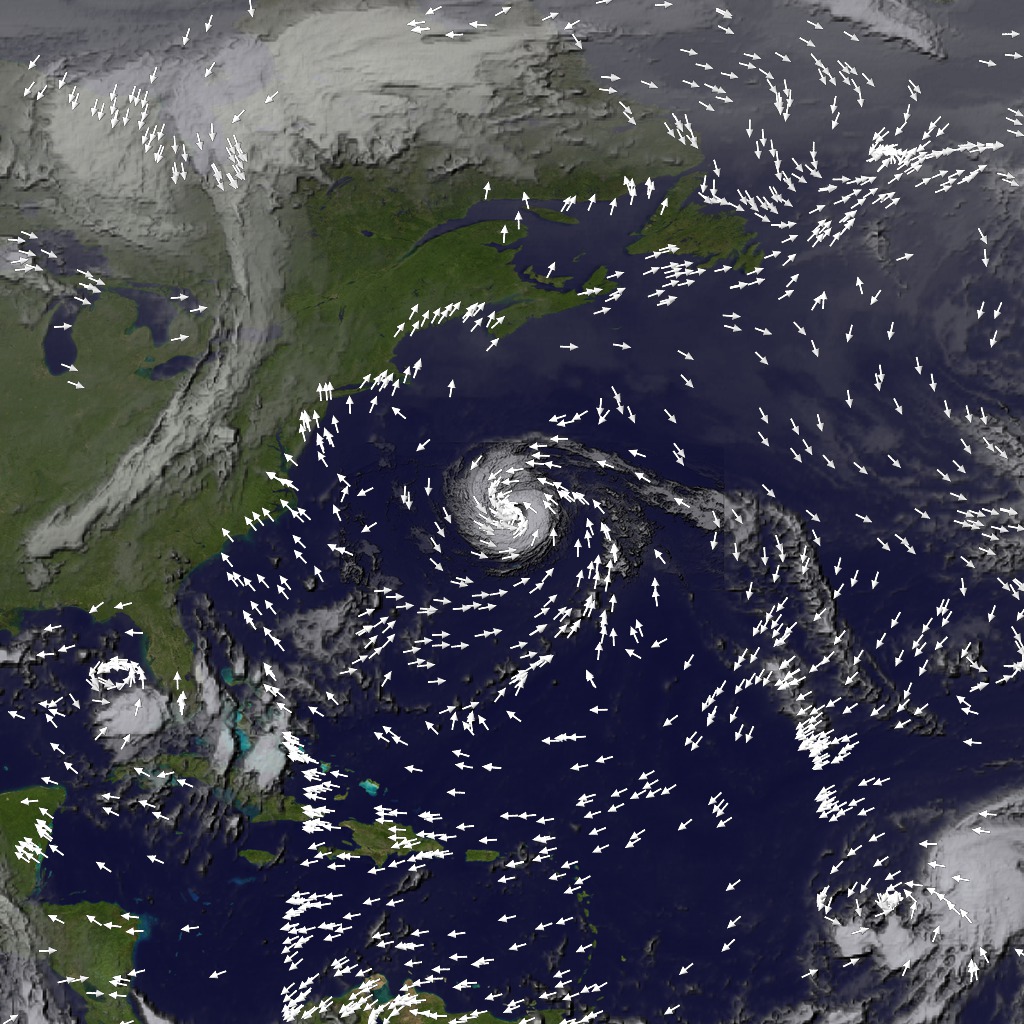
This visualization shows wind vectors for Hurricane Erin on September 10, 2001. Wind direction and speed are represented by the direction and speed of moving arrows, respectively. This visualization represents a single measurement taken by the SeaWinds instrument on the QuikSCAT satellite, taken at 14:27:00 UTC on September 10, 2001. The WMS version of this visualization which is available through the SVS Image Server presents this visualization with a different timestamp for each frame in order to more easily present the images as a moving series of images. It should be noted that each frame really has a time stamp of 2001-09-10 14:27:00 UTC.
Wind Vectors for Hurricane Erin (WMS)
Visualization Credits
Eric Sokolowsky (GST): Lead Animator
Greg Shirah (NASA/GSFC): Animator
Jeff Halverson (JCET UMBC): Scientist
Greg Shirah (NASA/GSFC): Animator
Jeff Halverson (JCET UMBC): Scientist
Please give credit for this item to:
NASA/Goddard Space Flight Center Scientific Visualization Studio
NASA/Goddard Space Flight Center Scientific Visualization Studio
Short URL to share this page:
https://svs.gsfc.nasa.gov/2896
Mission:
QuikSCAT
Data Used:
Note: While we identify the data sets used in these visualizations, we do not store any further details nor the data sets themselves on our site.
This item is part of this series:
WMS
Keywords:
DLESE >> Atmospheric science
SVS >> HDTV
DLESE >> Natural hazards
GCMD >> Earth Science >> Atmosphere >> Atmospheric Phenomena >> Hurricanes
GCMD >> Earth Science >> Atmosphere >> Atmospheric Winds >> Surface Winds
GCMD >> Earth Science >> Human Dimensions >> Natural Hazards >> Meteorological Hazards
GCMD >> Earth Science >> Oceans >> Ocean Winds >> Surface Winds
SVS >> Hurricane Erin
SVS >> For Educators
SVS >> Atmosphere >> Winds >> Circulation
SVS >> Atmospheric Circulation
SVS >> Wind Patterns
SVS >> Air Currents
NASA Science >> Earth
GCMD keywords can be found on the Internet with the following citation: Olsen, L.M., G. Major, K. Shein, J. Scialdone, S. Ritz, T. Stevens, M. Morahan, A. Aleman, R. Vogel, S. Leicester, H. Weir, M. Meaux, S. Grebas, C.Solomon, M. Holland, T. Northcutt, R. A. Restrepo, R. Bilodeau, 2013. NASA/Global Change Master Directory (GCMD) Earth Science Keywords. Version 8.0.0.0.0
https://svs.gsfc.nasa.gov/2896
Mission:
QuikSCAT
Data Used:
QuikSCAT/SeaWinds
2001/09/10 14:27:00 UTC
SeaWinds is a scanning dual pencil-beam Ku-band scatterometer.
This item is part of this series:
WMS
Keywords:
DLESE >> Atmospheric science
SVS >> HDTV
DLESE >> Natural hazards
GCMD >> Earth Science >> Atmosphere >> Atmospheric Phenomena >> Hurricanes
GCMD >> Earth Science >> Atmosphere >> Atmospheric Winds >> Surface Winds
GCMD >> Earth Science >> Human Dimensions >> Natural Hazards >> Meteorological Hazards
GCMD >> Earth Science >> Oceans >> Ocean Winds >> Surface Winds
SVS >> Hurricane Erin
SVS >> For Educators
SVS >> Atmosphere >> Winds >> Circulation
SVS >> Atmospheric Circulation
SVS >> Wind Patterns
SVS >> Air Currents
NASA Science >> Earth
GCMD keywords can be found on the Internet with the following citation: Olsen, L.M., G. Major, K. Shein, J. Scialdone, S. Ritz, T. Stevens, M. Morahan, A. Aleman, R. Vogel, S. Leicester, H. Weir, M. Meaux, S. Grebas, C.Solomon, M. Holland, T. Northcutt, R. A. Restrepo, R. Bilodeau, 2013. NASA/Global Change Master Directory (GCMD) Earth Science Keywords. Version 8.0.0.0.0


