Earth
ID: 2893
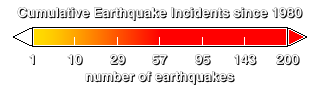
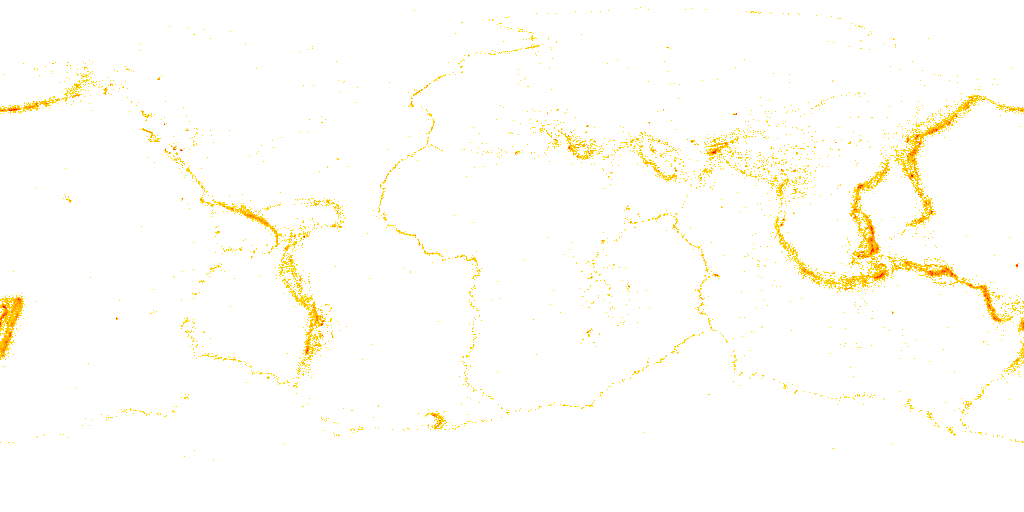
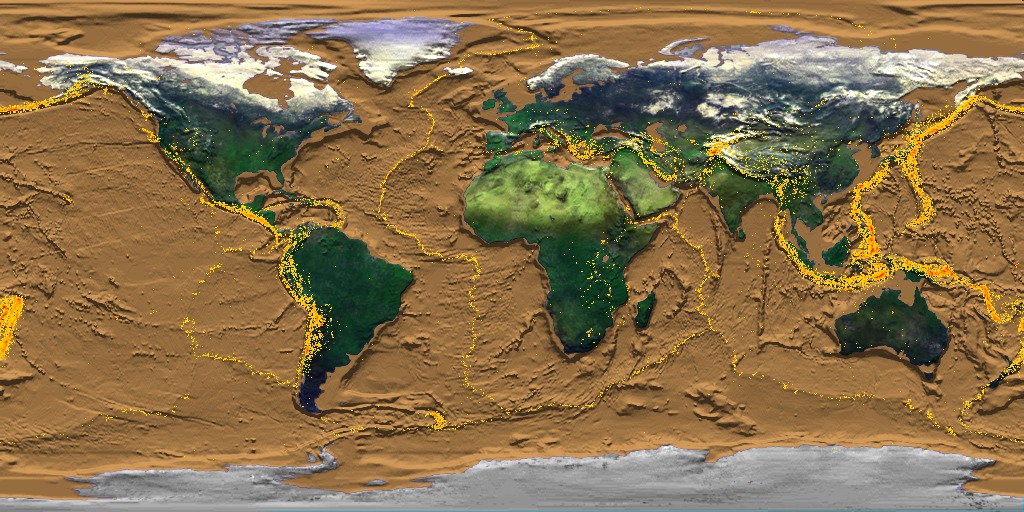
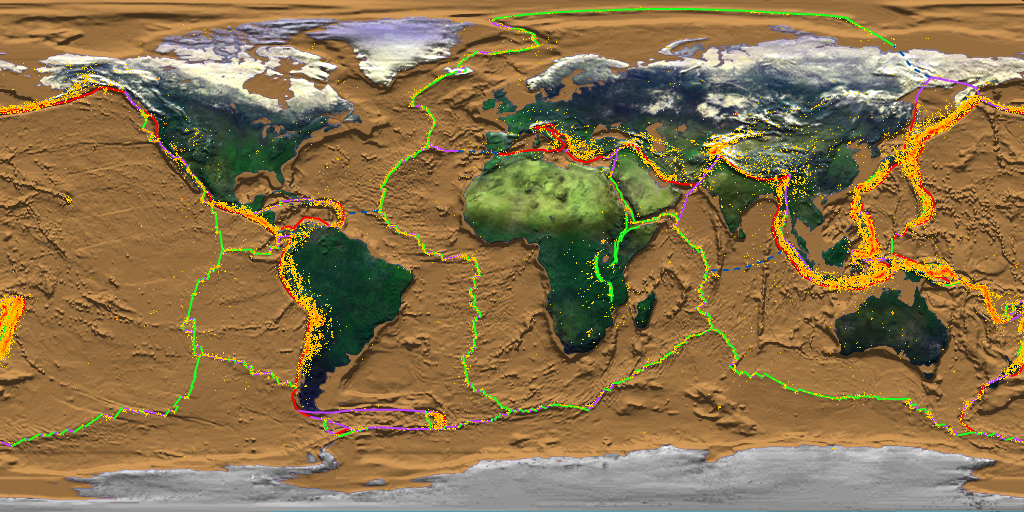
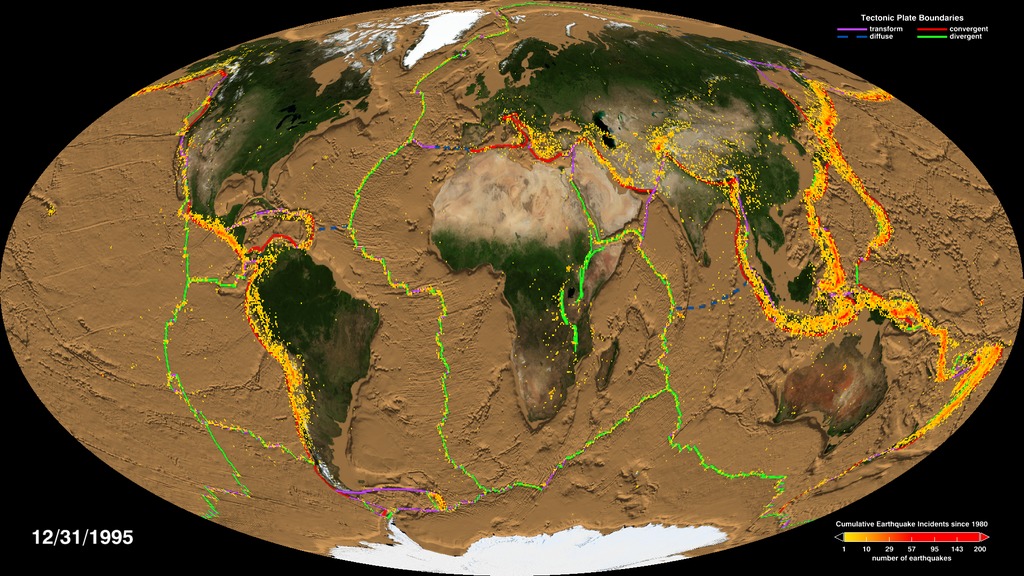
This animation shows a cumulative view of earthquake activity for the whole world from 1980 through 1995. Each dot on the image represents the number of earthquakes with magnitude greater than 4.2 that have occurred in a 0.35 by 0.35 degree area of the globe since January 1, 1980. A yellow dot represents 1 or 2 earthquakes, an orange dot represents about 10 earthquakes, and a red dot represents 50 to 200 earthquakes. The background image, if present, shows the topography of the ocean floor. As the animation proceeds, the earthquakes clearly accumulate around the topographic features that represent the boundaries of the Earth's crustal plates. This animation is based on data from world-wide seismic networks and was obtained from the National Earthquake Center of the United States Geological Survey.
Cumulative Earthquake Activity from 1980 through 1995 (WMS)
For More Information
Visualization Credits
Horace Mitchell (NASA/GSFC): Lead Visualizer
Eric Sokolowsky (GST): Lead Animator
Jim Strong (NASA/GSFC): Visualizer
Eric Sokolowsky (Global Science and Technology, Inc.): Visualizer
Tom Watters (Smithsonian/Air and Space): Scientist
Eric Sokolowsky (GST): Lead Animator
Jim Strong (NASA/GSFC): Visualizer
Eric Sokolowsky (Global Science and Technology, Inc.): Visualizer
Tom Watters (Smithsonian/Air and Space): Scientist
Please give credit for this item to:
NASA/Goddard Space Flight Center Scientific Visualization Studio
NASA/Goddard Space Flight Center Scientific Visualization Studio
Short URL to share this page:
https://svs.gsfc.nasa.gov/2893
Data Used:
Note: While we identify the data sets used in these visualizations, we do not store any further details nor the data sets themselves on our site.
This item is part of this series:
WMS
Keywords:
SVS >> Continental Drift
SVS >> Earthquake
DLESE >> Geology
DLESE >> Natural hazards
GCMD >> Earth Science >> Human Dimensions >> Natural Hazards >> Geological Hazards
GCMD >> Earth Science >> Solid Earth >> Seismology >> Earthquake Occurrences
SVS >> For Educators
SVS >> Seismic Activity
SVS >> Fault Boundaries
NASA Science >> Earth
GCMD keywords can be found on the Internet with the following citation: Olsen, L.M., G. Major, K. Shein, J. Scialdone, S. Ritz, T. Stevens, M. Morahan, A. Aleman, R. Vogel, S. Leicester, H. Weir, M. Meaux, S. Grebas, C.Solomon, M. Holland, T. Northcutt, R. A. Restrepo, R. Bilodeau, 2013. NASA/Global Change Master Directory (GCMD) Earth Science Keywords. Version 8.0.0.0.0
https://svs.gsfc.nasa.gov/2893
Data Used:
Earthquake Activity
Data Compilation - USGS National Earthquake Center - 1980/01/01 - 1995/12/31This item is part of this series:
WMS
Keywords:
SVS >> Continental Drift
SVS >> Earthquake
DLESE >> Geology
DLESE >> Natural hazards
GCMD >> Earth Science >> Human Dimensions >> Natural Hazards >> Geological Hazards
GCMD >> Earth Science >> Solid Earth >> Seismology >> Earthquake Occurrences
SVS >> For Educators
SVS >> Seismic Activity
SVS >> Fault Boundaries
NASA Science >> Earth
GCMD keywords can be found on the Internet with the following citation: Olsen, L.M., G. Major, K. Shein, J. Scialdone, S. Ritz, T. Stevens, M. Morahan, A. Aleman, R. Vogel, S. Leicester, H. Weir, M. Meaux, S. Grebas, C.Solomon, M. Holland, T. Northcutt, R. A. Restrepo, R. Bilodeau, 2013. NASA/Global Change Master Directory (GCMD) Earth Science Keywords. Version 8.0.0.0.0


