Earth
ID: 2889
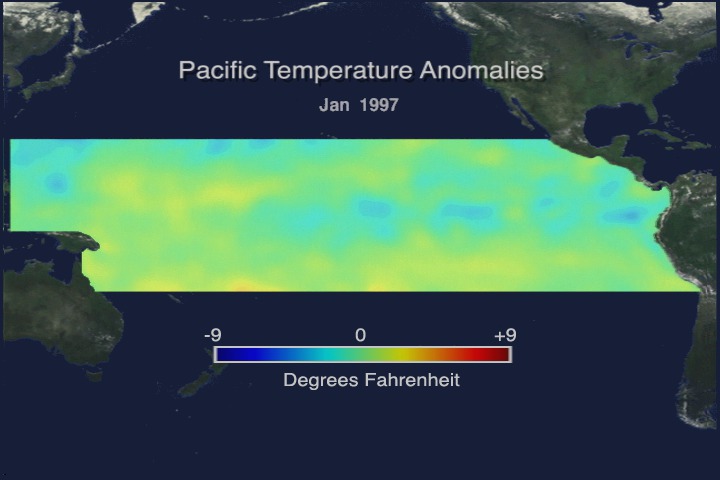
This animation shows the El Niño-La Niña Sea Surface Temperature Anomaly from January 1997 through July 1999. A color bar is displayed below the data. This animation is a minor revision of animation ID 2793.
Pacific Temperature Anomalies with Color Key
Visualization Credits
Greg Shirah (NASA/GSFC): Lead Animator
Cindy Starr (Global Science and Technology, Inc.): Visualizer
Antonio Busalacchi (NASA/GSFC): Scientist
Peter Schultz (National Academy of Sciences): Scientist
Cindy Starr (Global Science and Technology, Inc.): Visualizer
Antonio Busalacchi (NASA/GSFC): Scientist
Peter Schultz (National Academy of Sciences): Scientist
Please give credit for this item to:
NASA/Goddard Space Flight Center Scientific Visualization Studio
NASA/Goddard Space Flight Center Scientific Visualization Studio
Short URL to share this page:
https://svs.gsfc.nasa.gov/2889
Data Used:
Note: While we identify the data sets used in these visualizations, we do not store any further details nor the data sets themselves on our site.
Keywords:
SVS >> El Nino
SVS >> La Nina
DLESE >> Physical oceanography
GCMD >> Earth Science >> Oceans >> Ocean Temperature >> Sea Surface Temperature
GCMD >> Location >> Pacific Ocean
SVS >> For Educators
NASA Science >> Earth
GCMD keywords can be found on the Internet with the following citation: Olsen, L.M., G. Major, K. Shein, J. Scialdone, S. Ritz, T. Stevens, M. Morahan, A. Aleman, R. Vogel, S. Leicester, H. Weir, M. Meaux, S. Grebas, C.Solomon, M. Holland, T. Northcutt, R. A. Restrepo, R. Bilodeau, 2013. NASA/Global Change Master Directory (GCMD) Earth Science Keywords. Version 8.0.0.0.0
https://svs.gsfc.nasa.gov/2889
Data Used:
NOAA-14/AVHRR/Sea Surface Temperature
1997/01/01 - 1999/07/31NOAA-7, 9, 11, 14, 16/AVHRR/Arctic Seasonal Temperature Trends
1982-2002Keywords:
SVS >> El Nino
SVS >> La Nina
DLESE >> Physical oceanography
GCMD >> Earth Science >> Oceans >> Ocean Temperature >> Sea Surface Temperature
GCMD >> Location >> Pacific Ocean
SVS >> For Educators
NASA Science >> Earth
GCMD keywords can be found on the Internet with the following citation: Olsen, L.M., G. Major, K. Shein, J. Scialdone, S. Ritz, T. Stevens, M. Morahan, A. Aleman, R. Vogel, S. Leicester, H. Weir, M. Meaux, S. Grebas, C.Solomon, M. Holland, T. Northcutt, R. A. Restrepo, R. Bilodeau, 2013. NASA/Global Change Master Directory (GCMD) Earth Science Keywords. Version 8.0.0.0.0


