Earth
ID: 2830
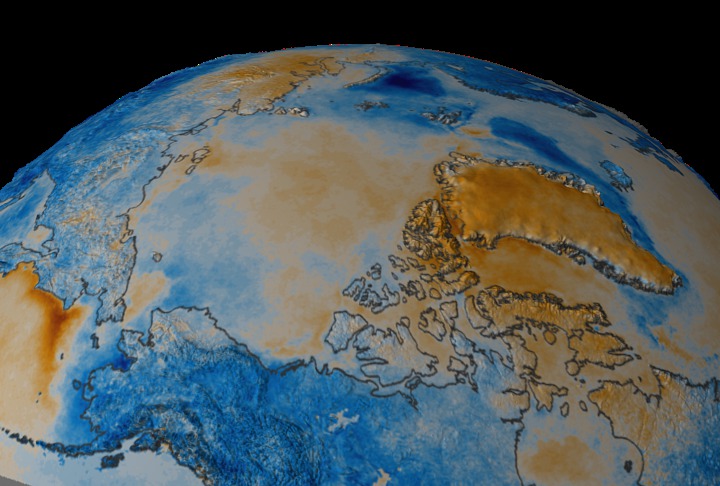
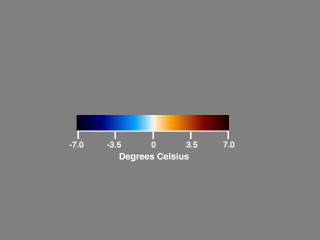
This animation shows the yearly temperature anomaly over the Arctic region from 1981-82 through 2002-03. Years run from August 1 through July 31. Blue hues indicate cooling regions; red hues depict warming. Light regions indicate less change while darker regions indicate more. The temperature scale used ranges from -7.0 to +7.0 degrees Celsius in increments of .25 degrees (see color bar below).
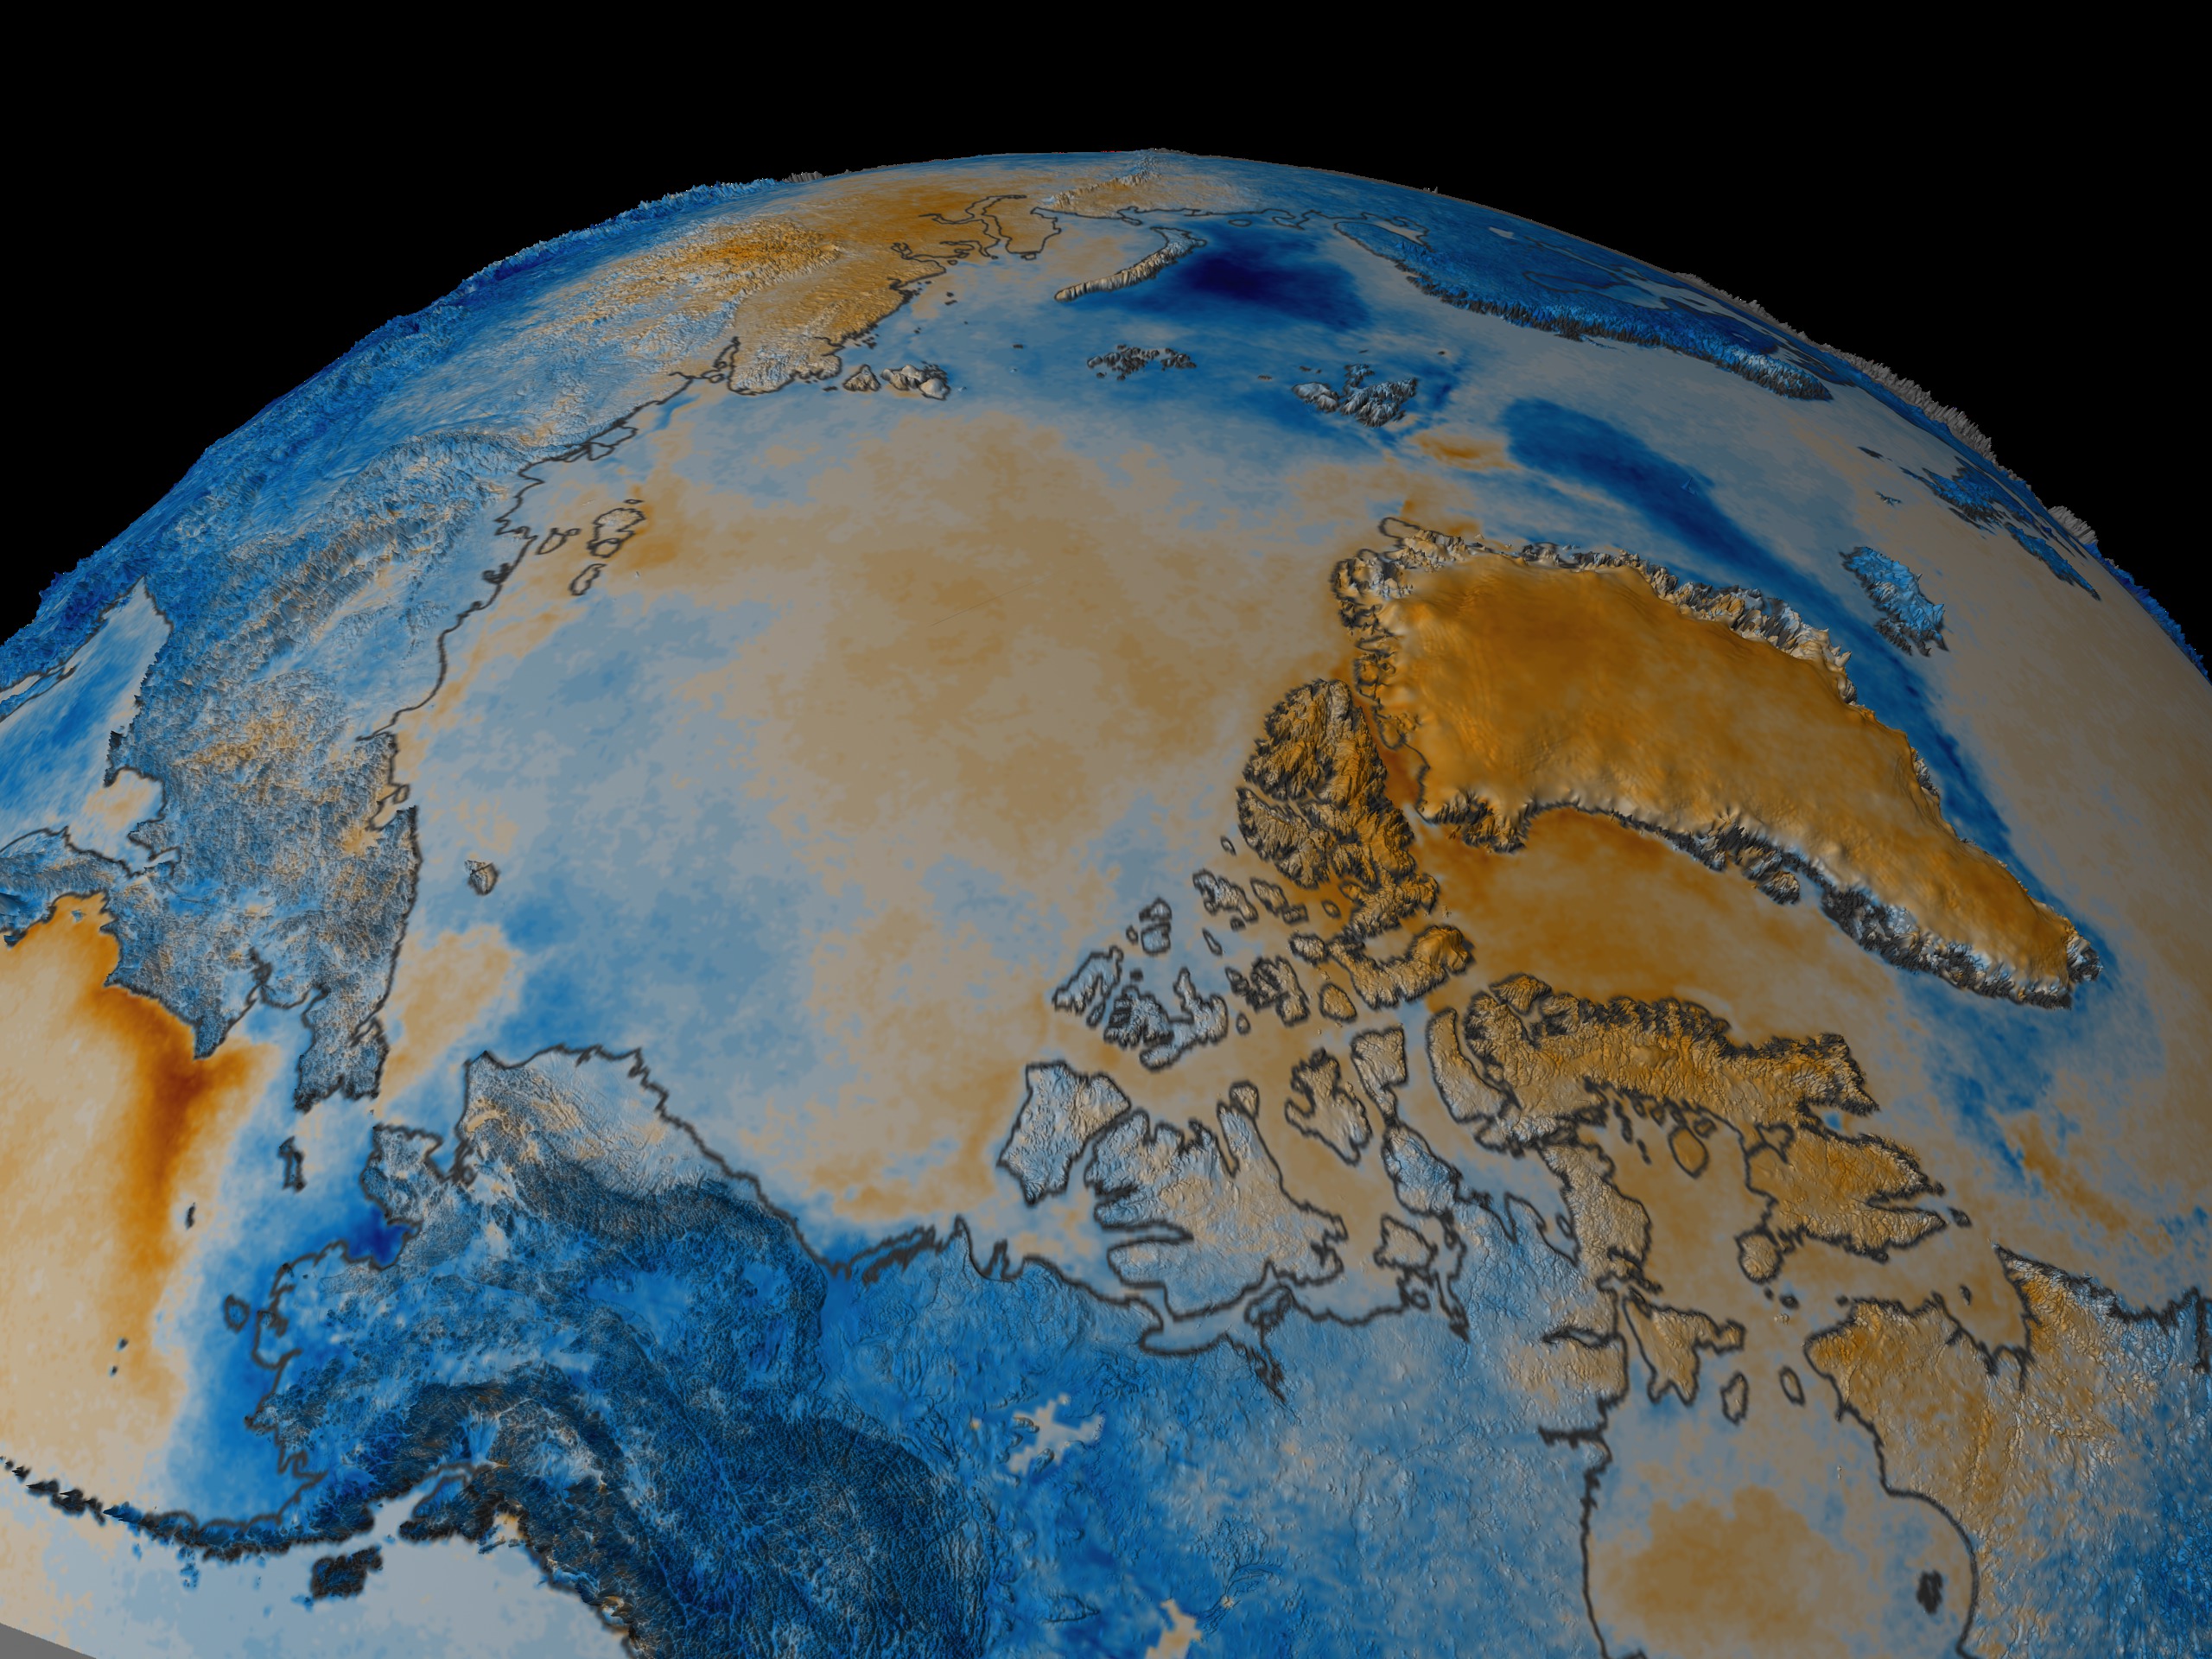
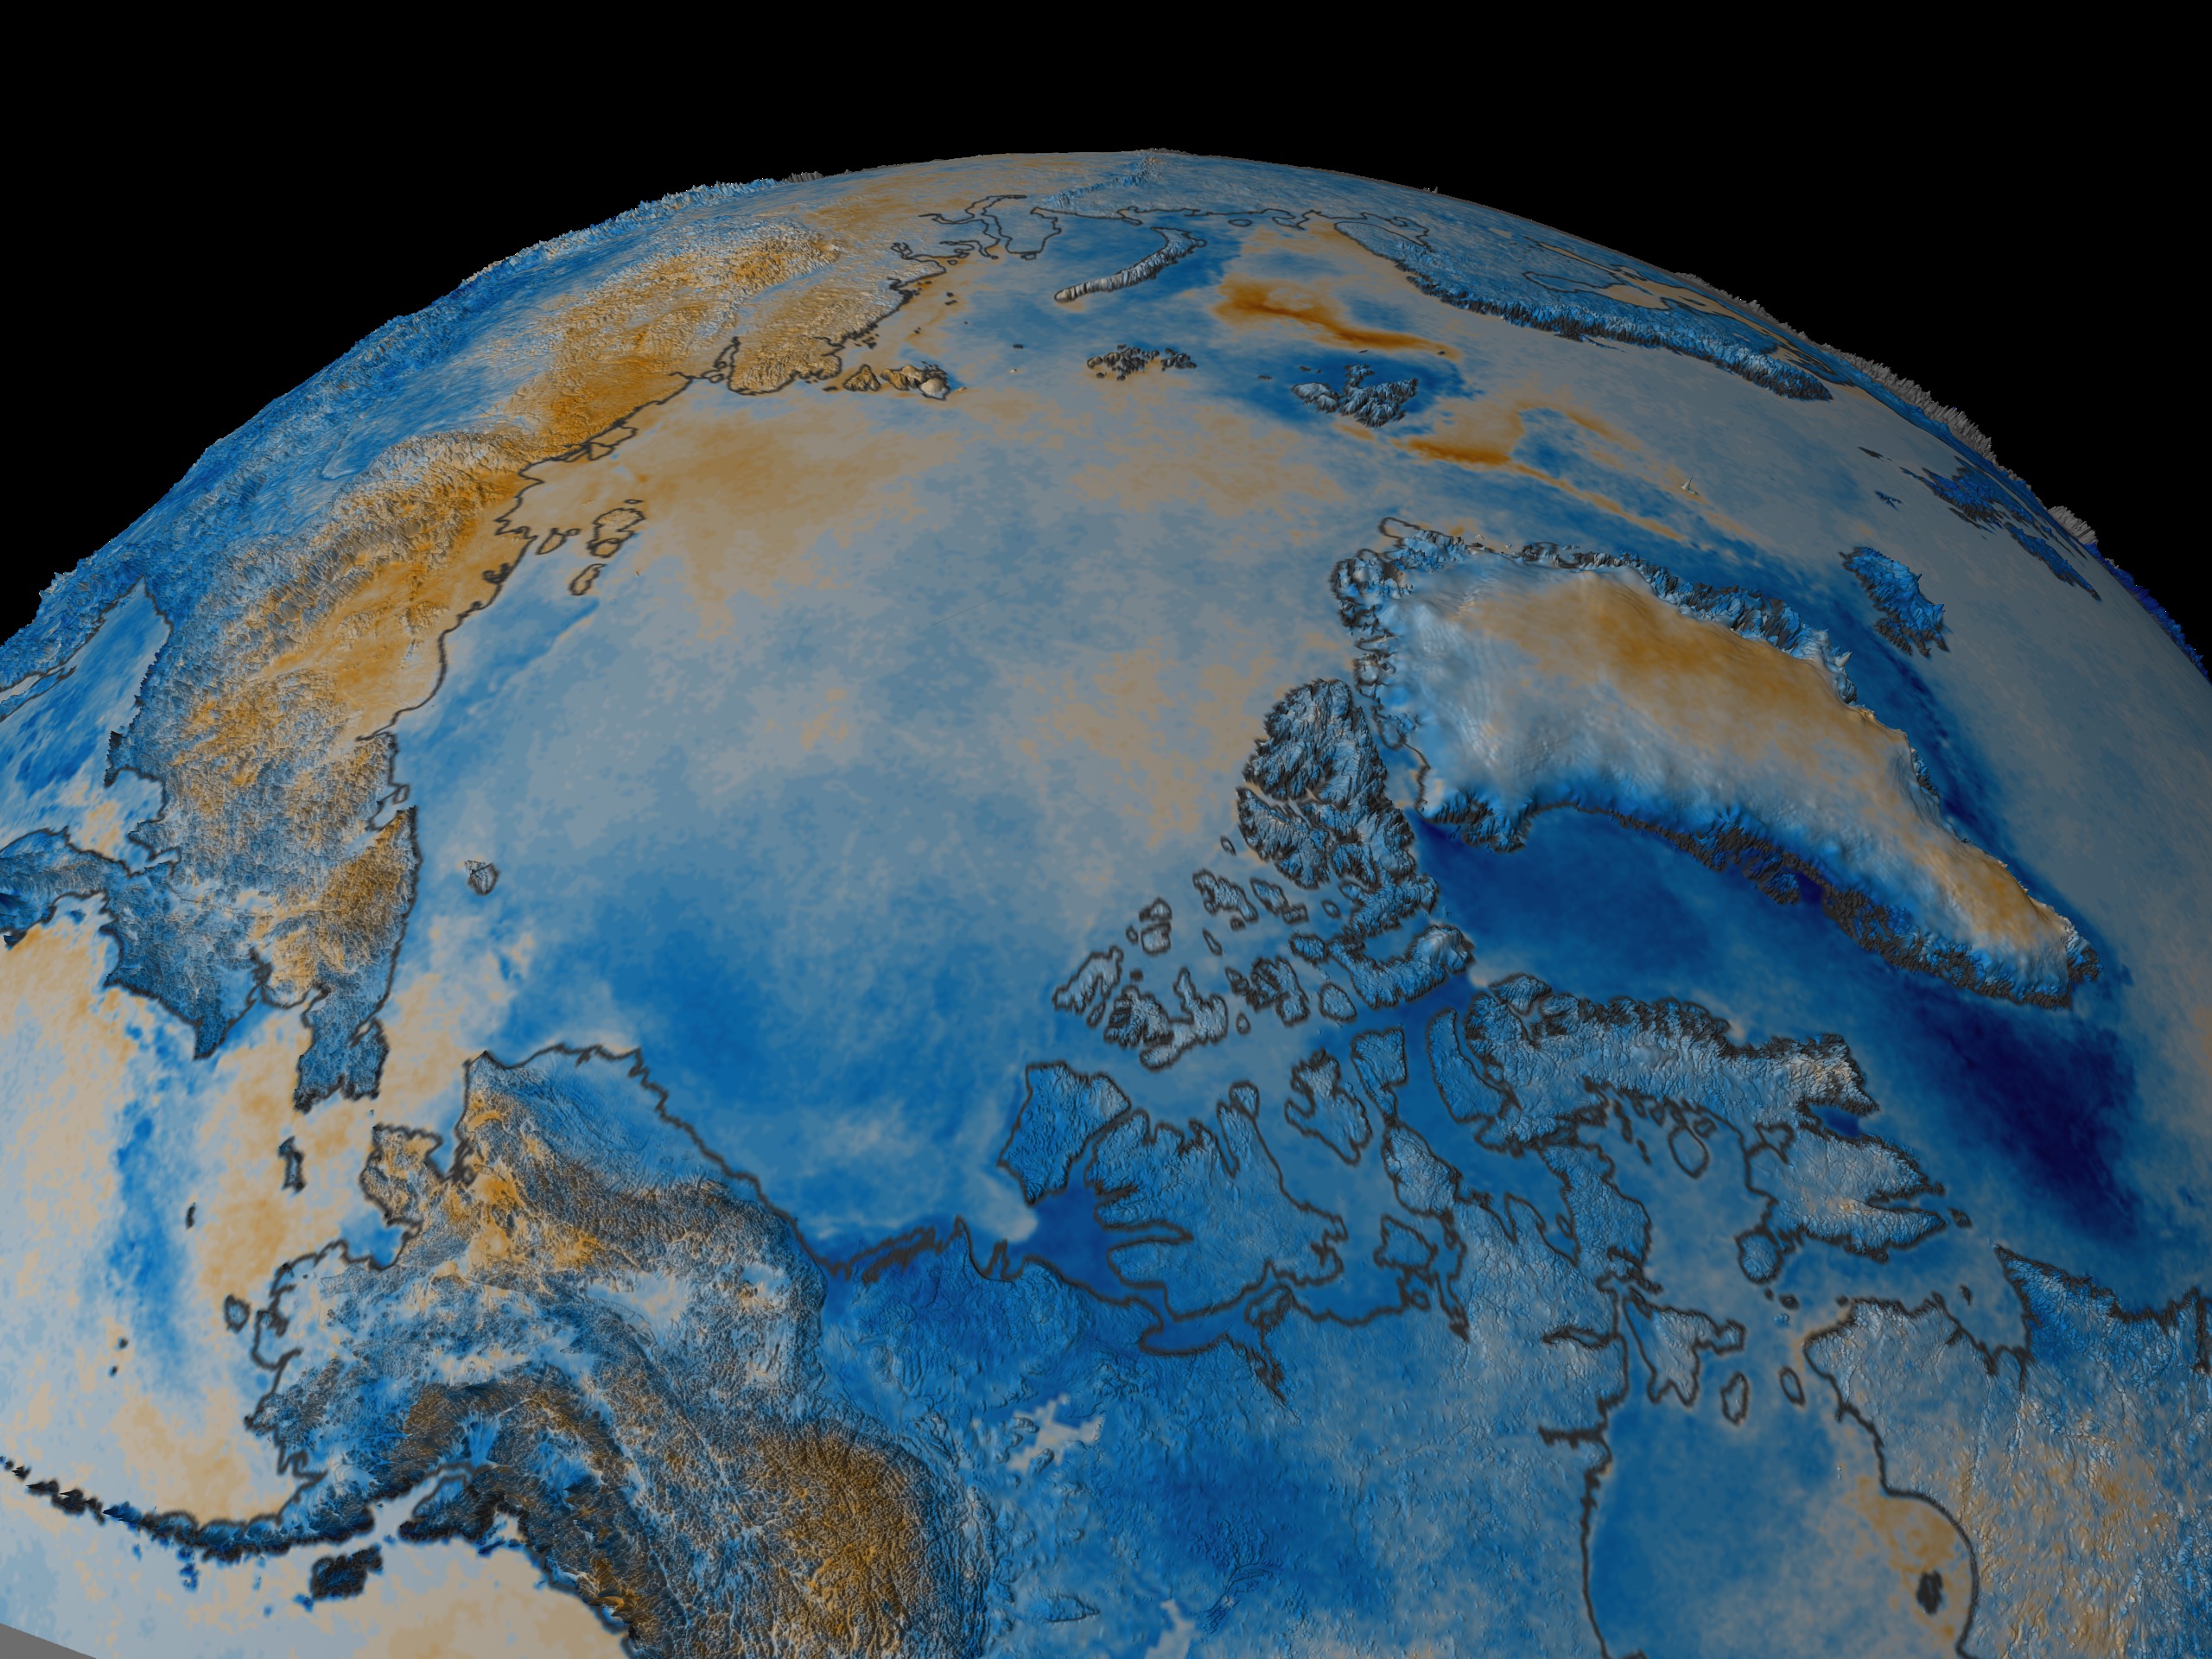
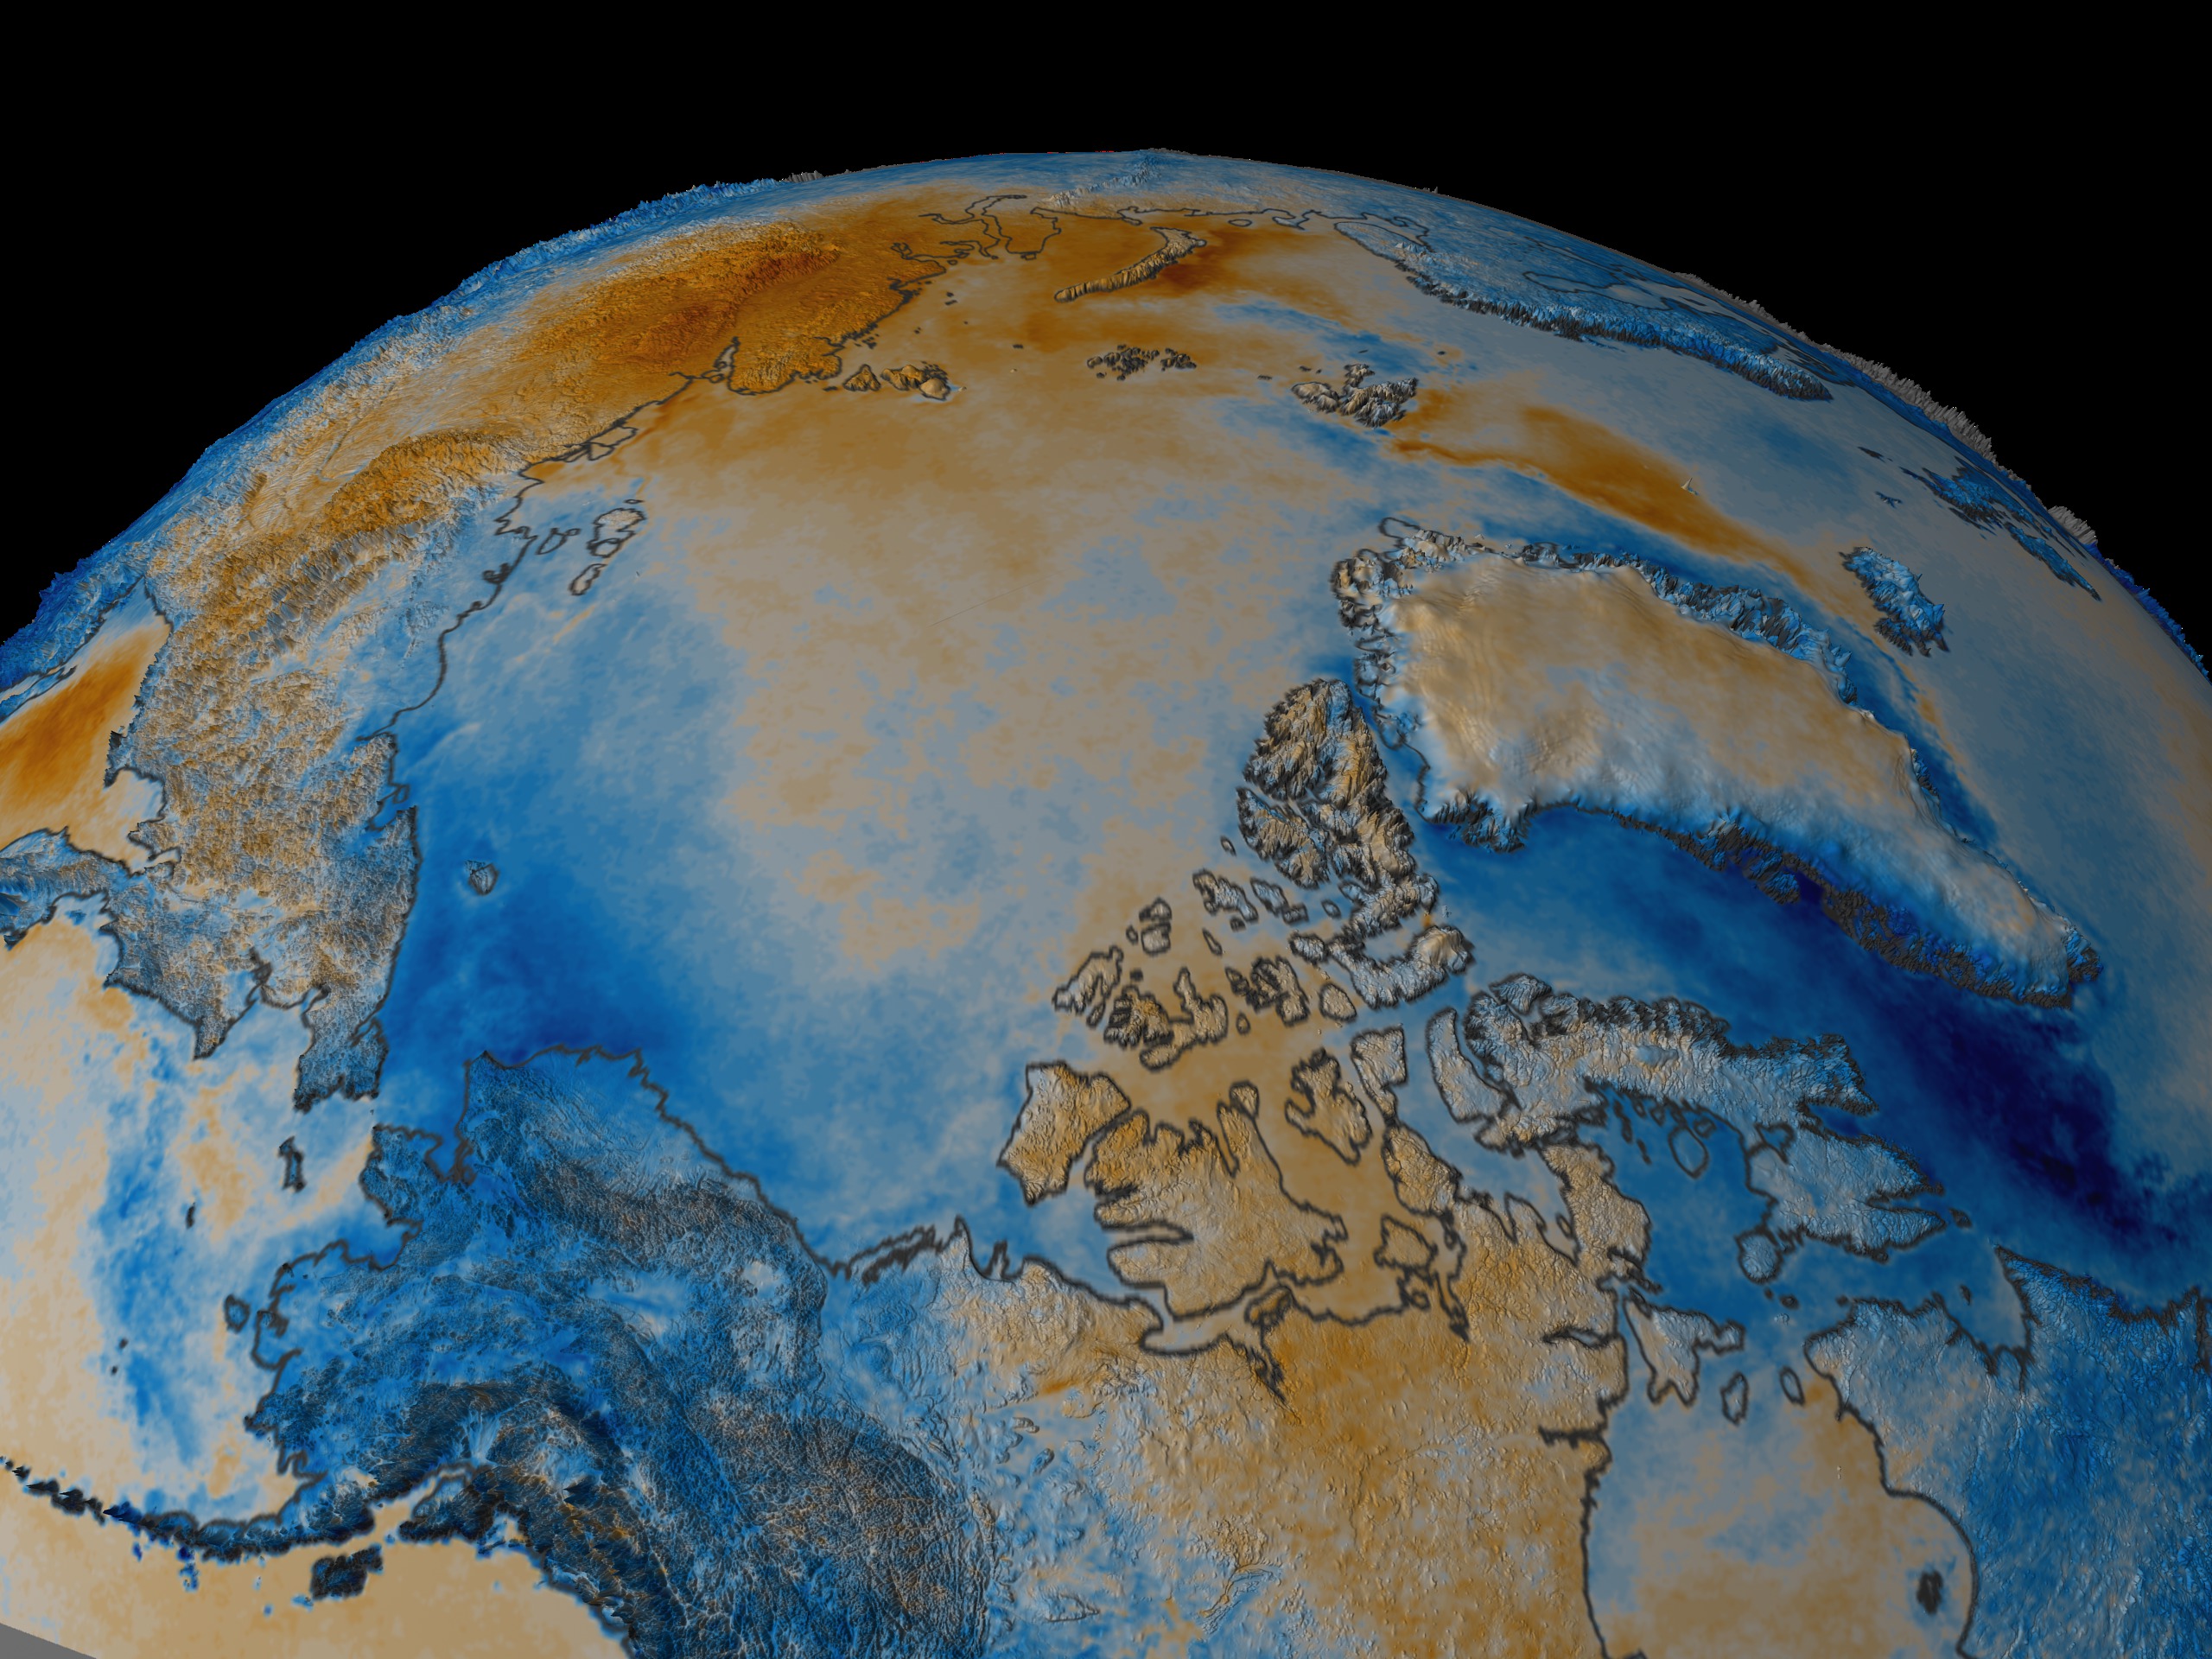
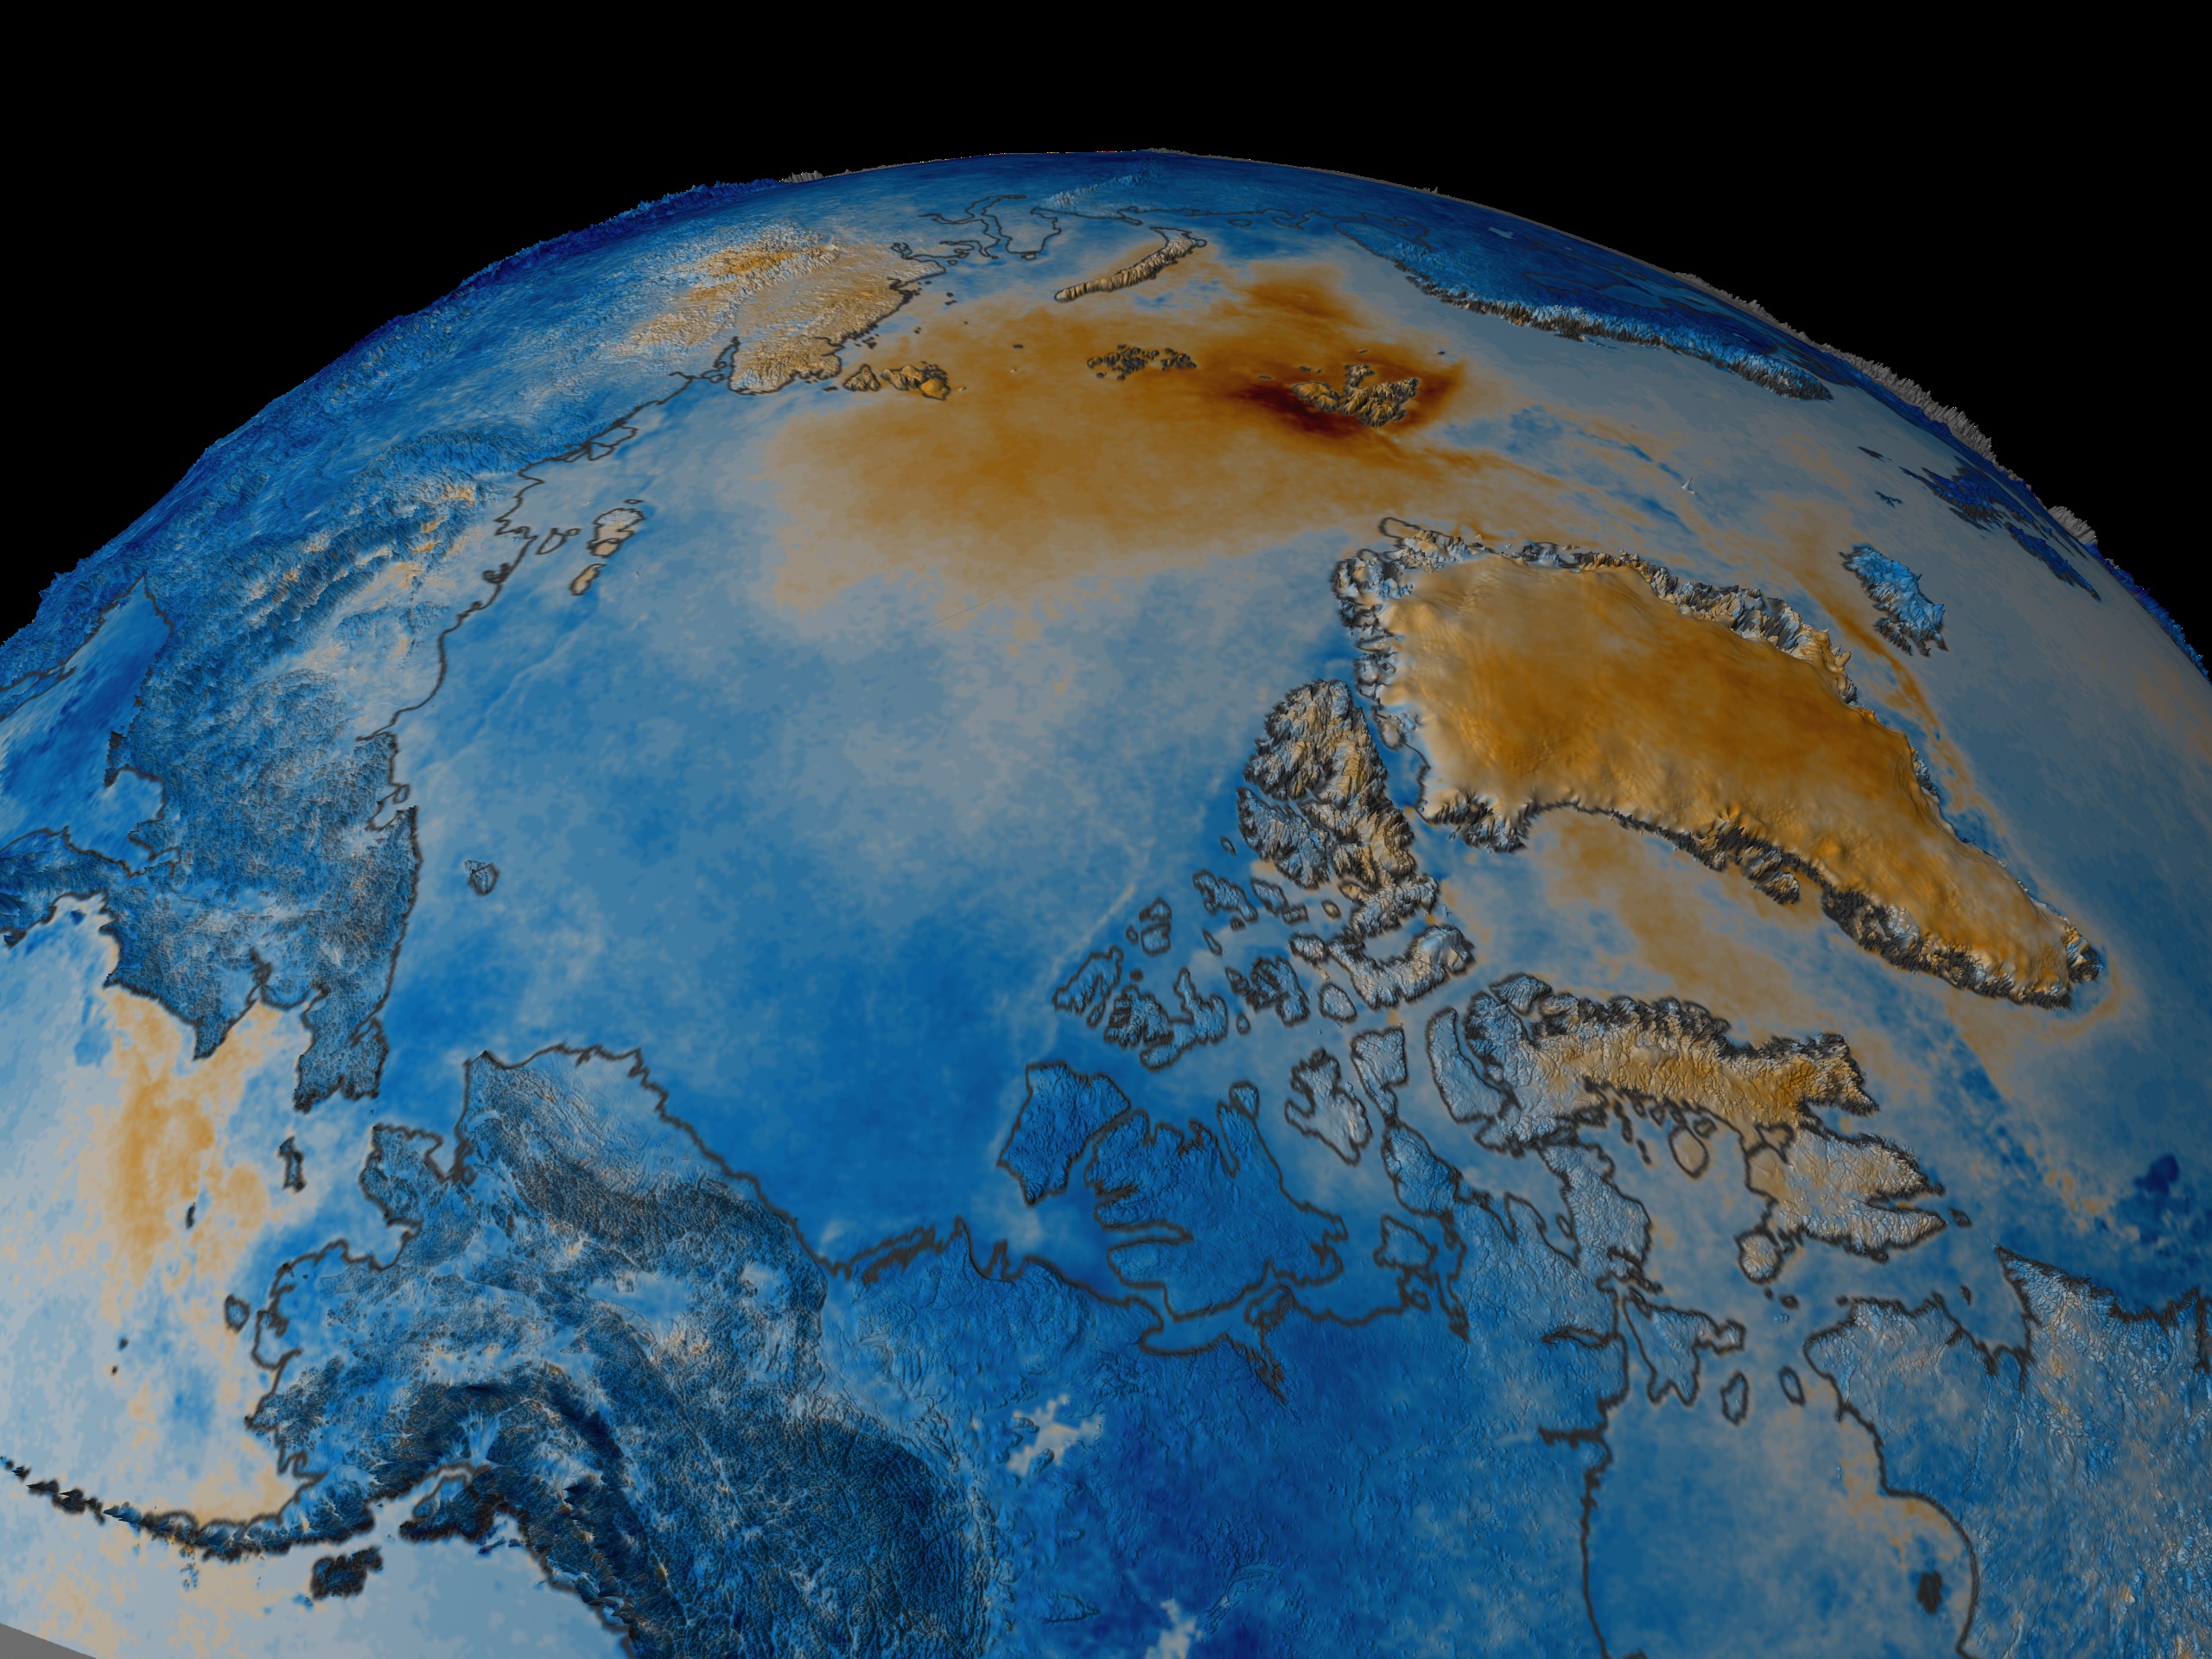
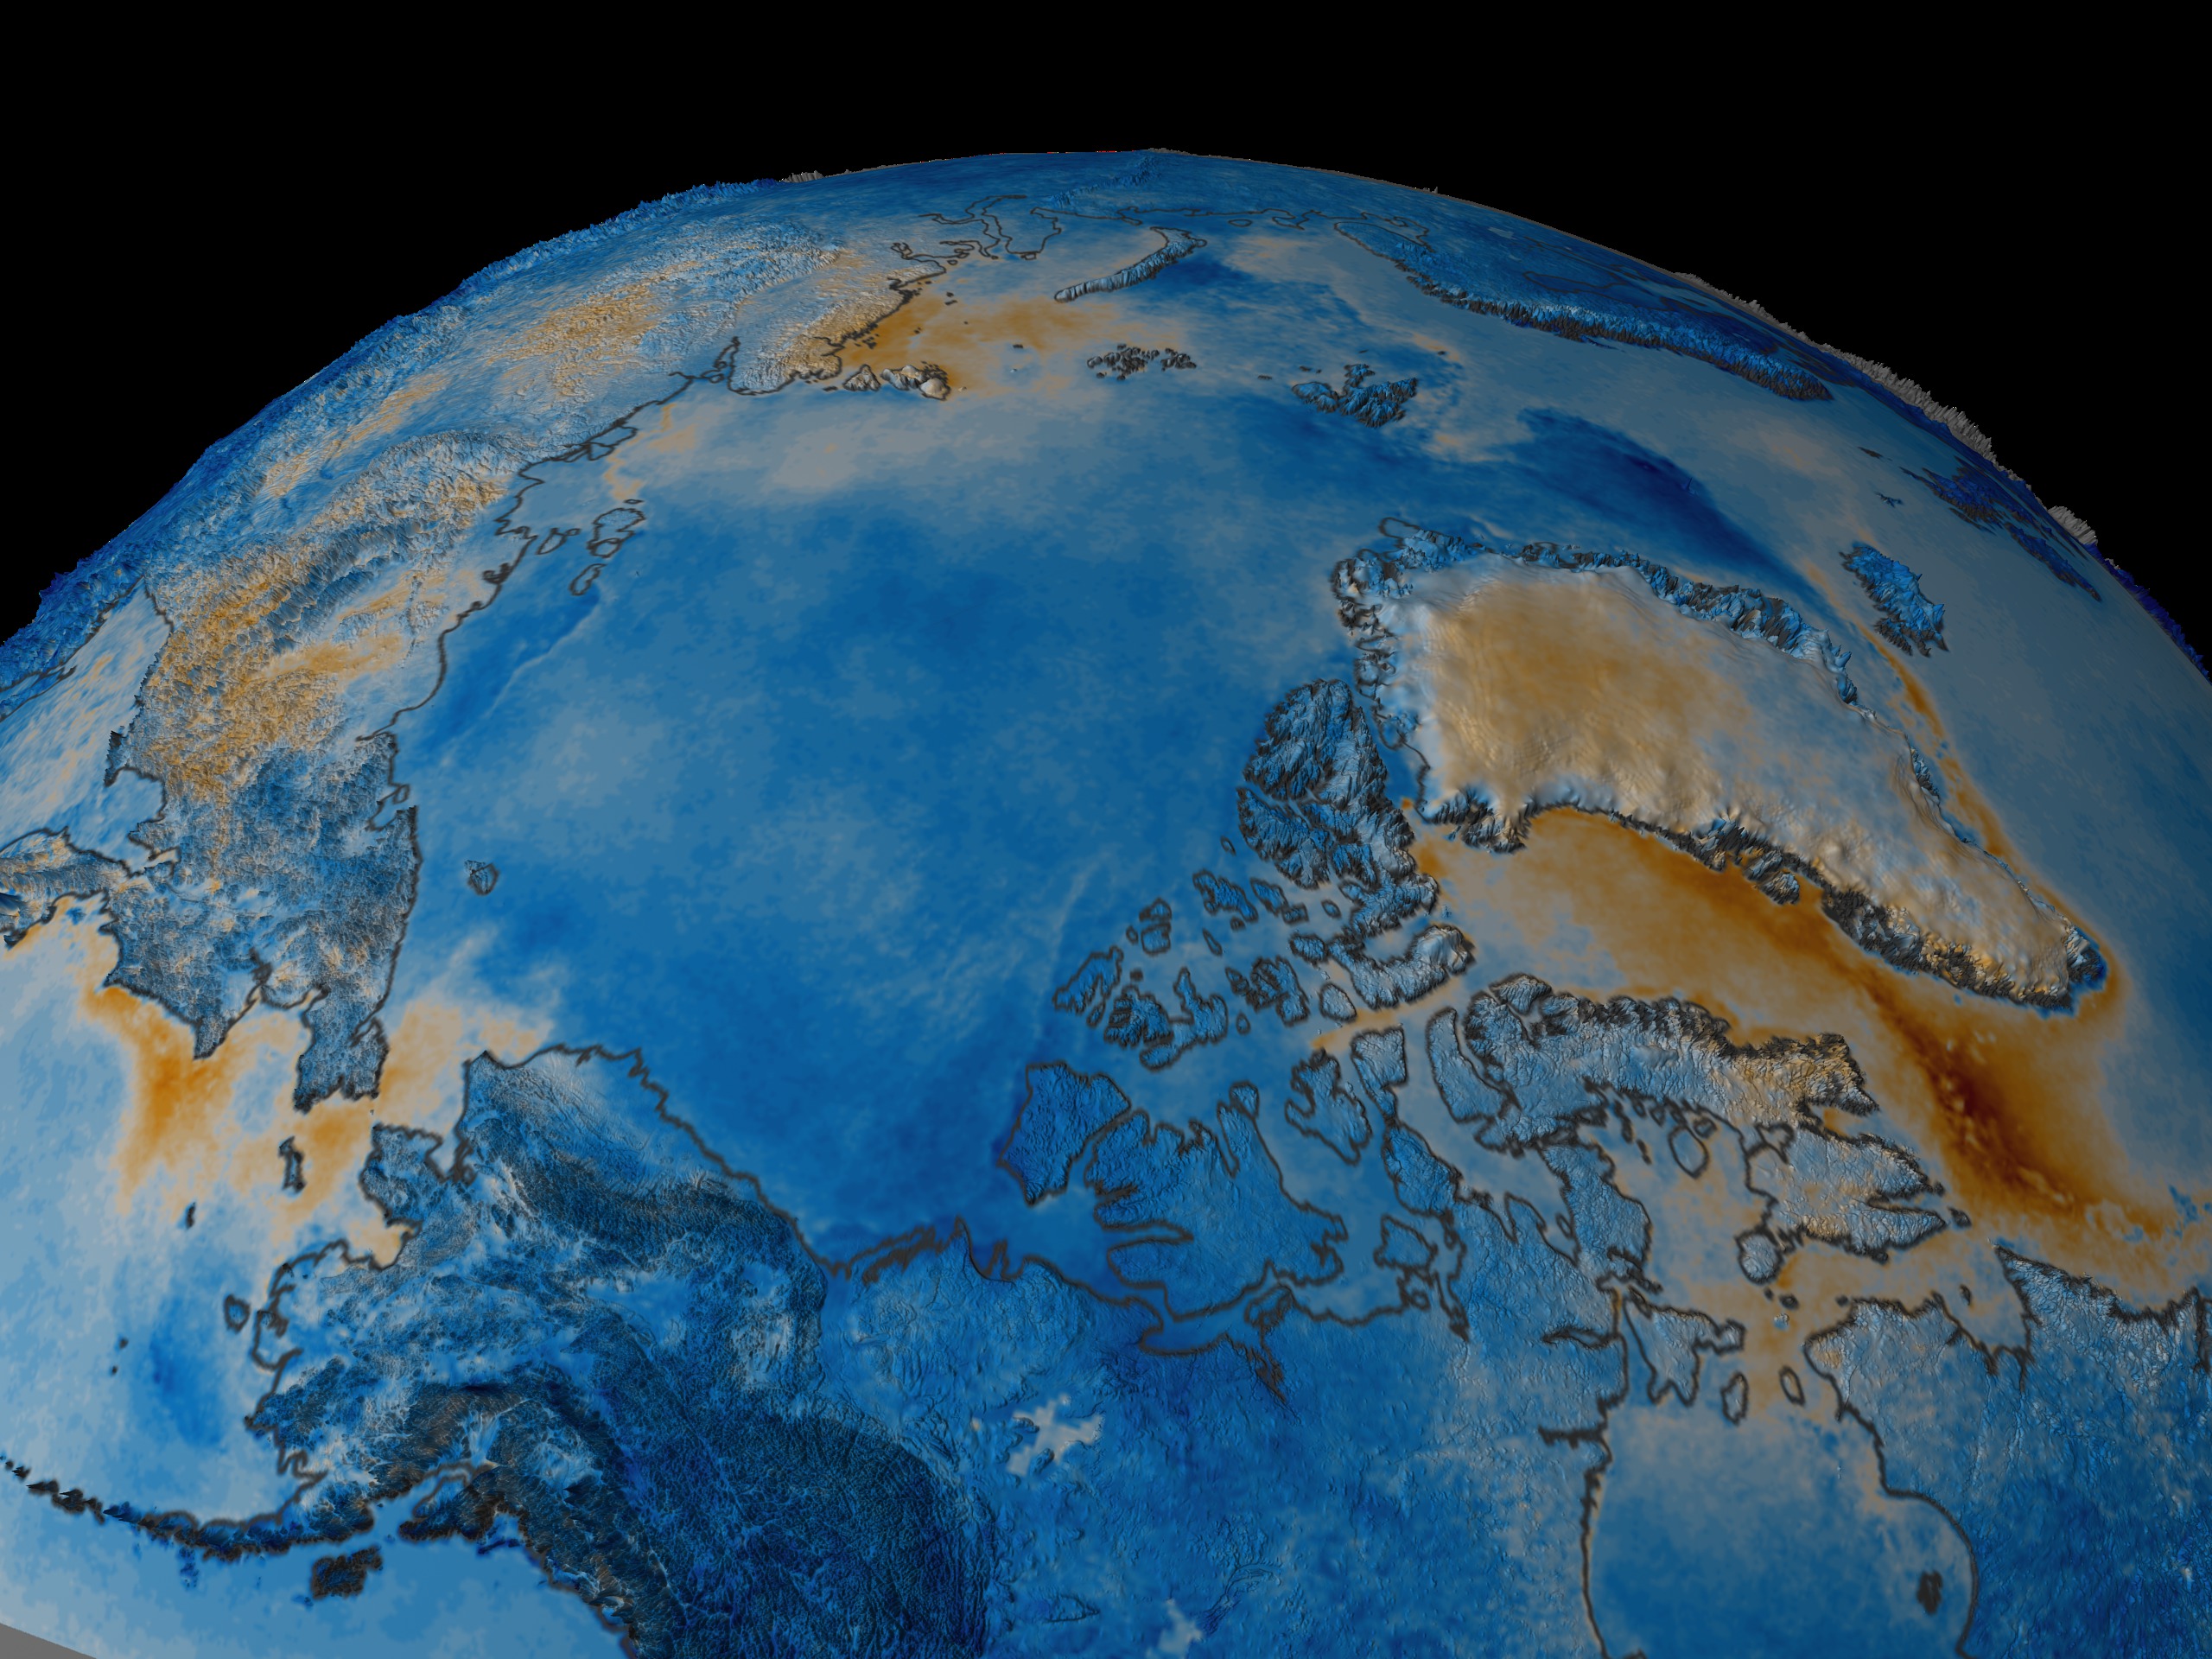
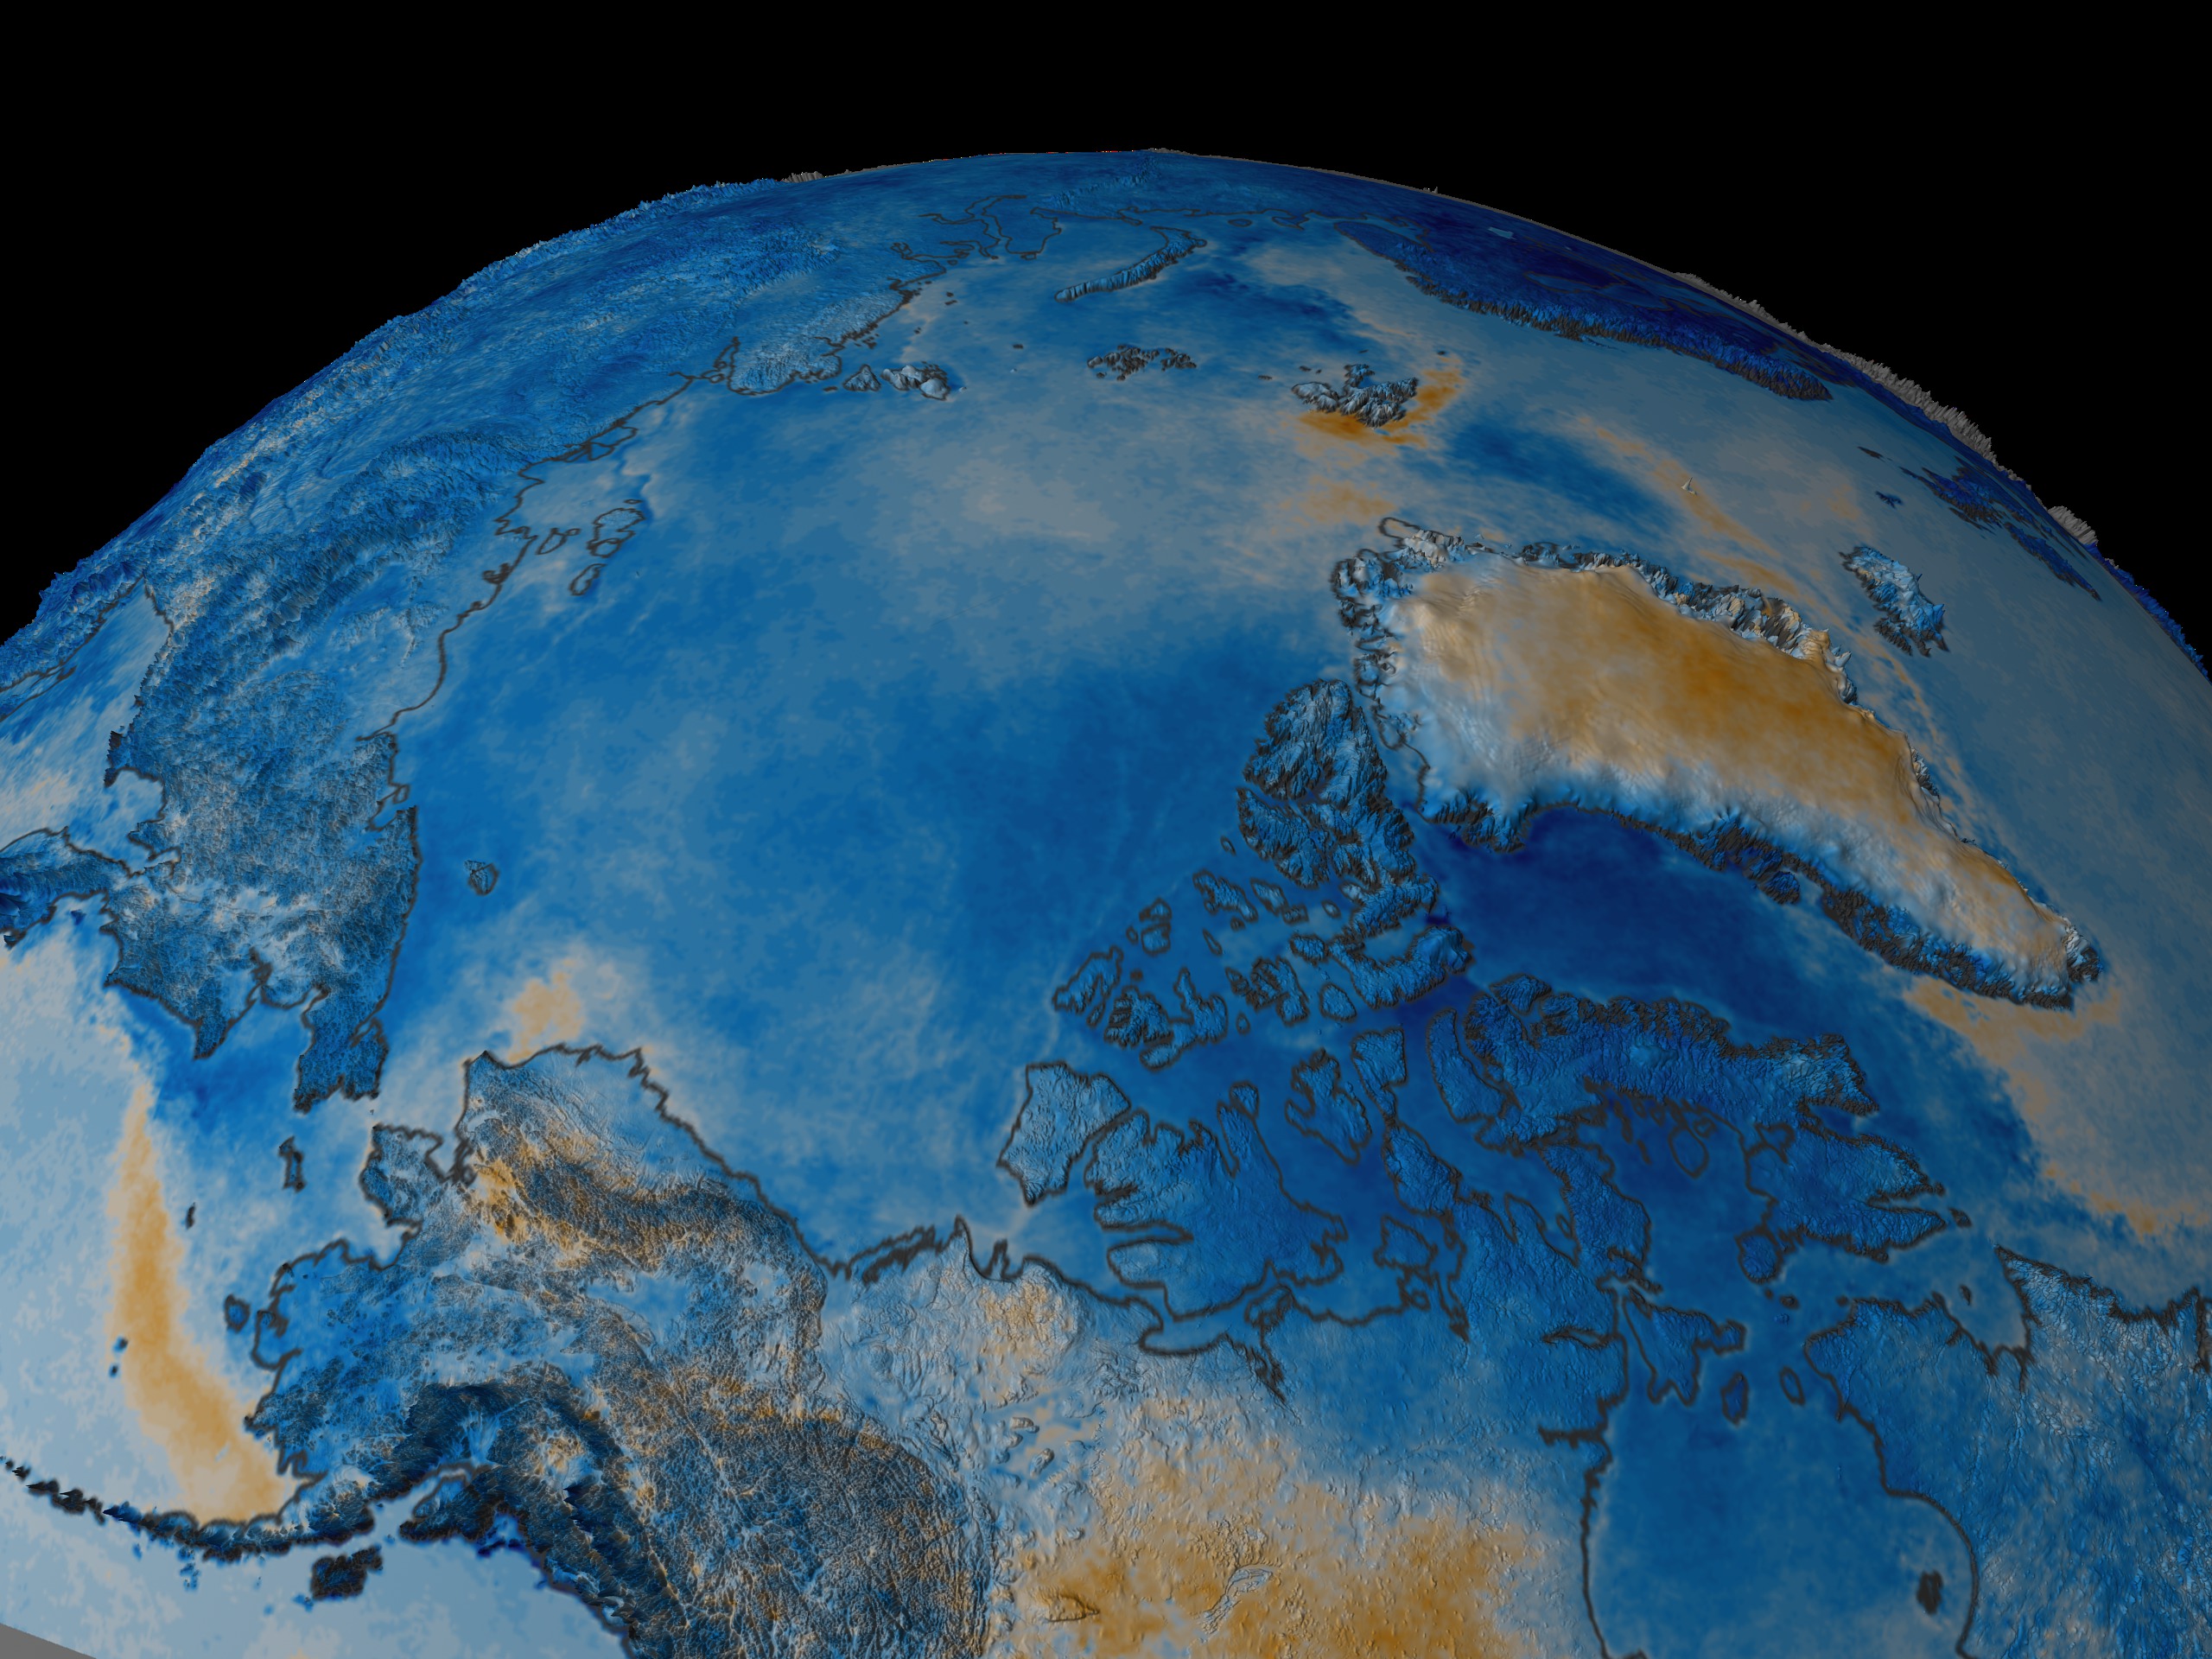
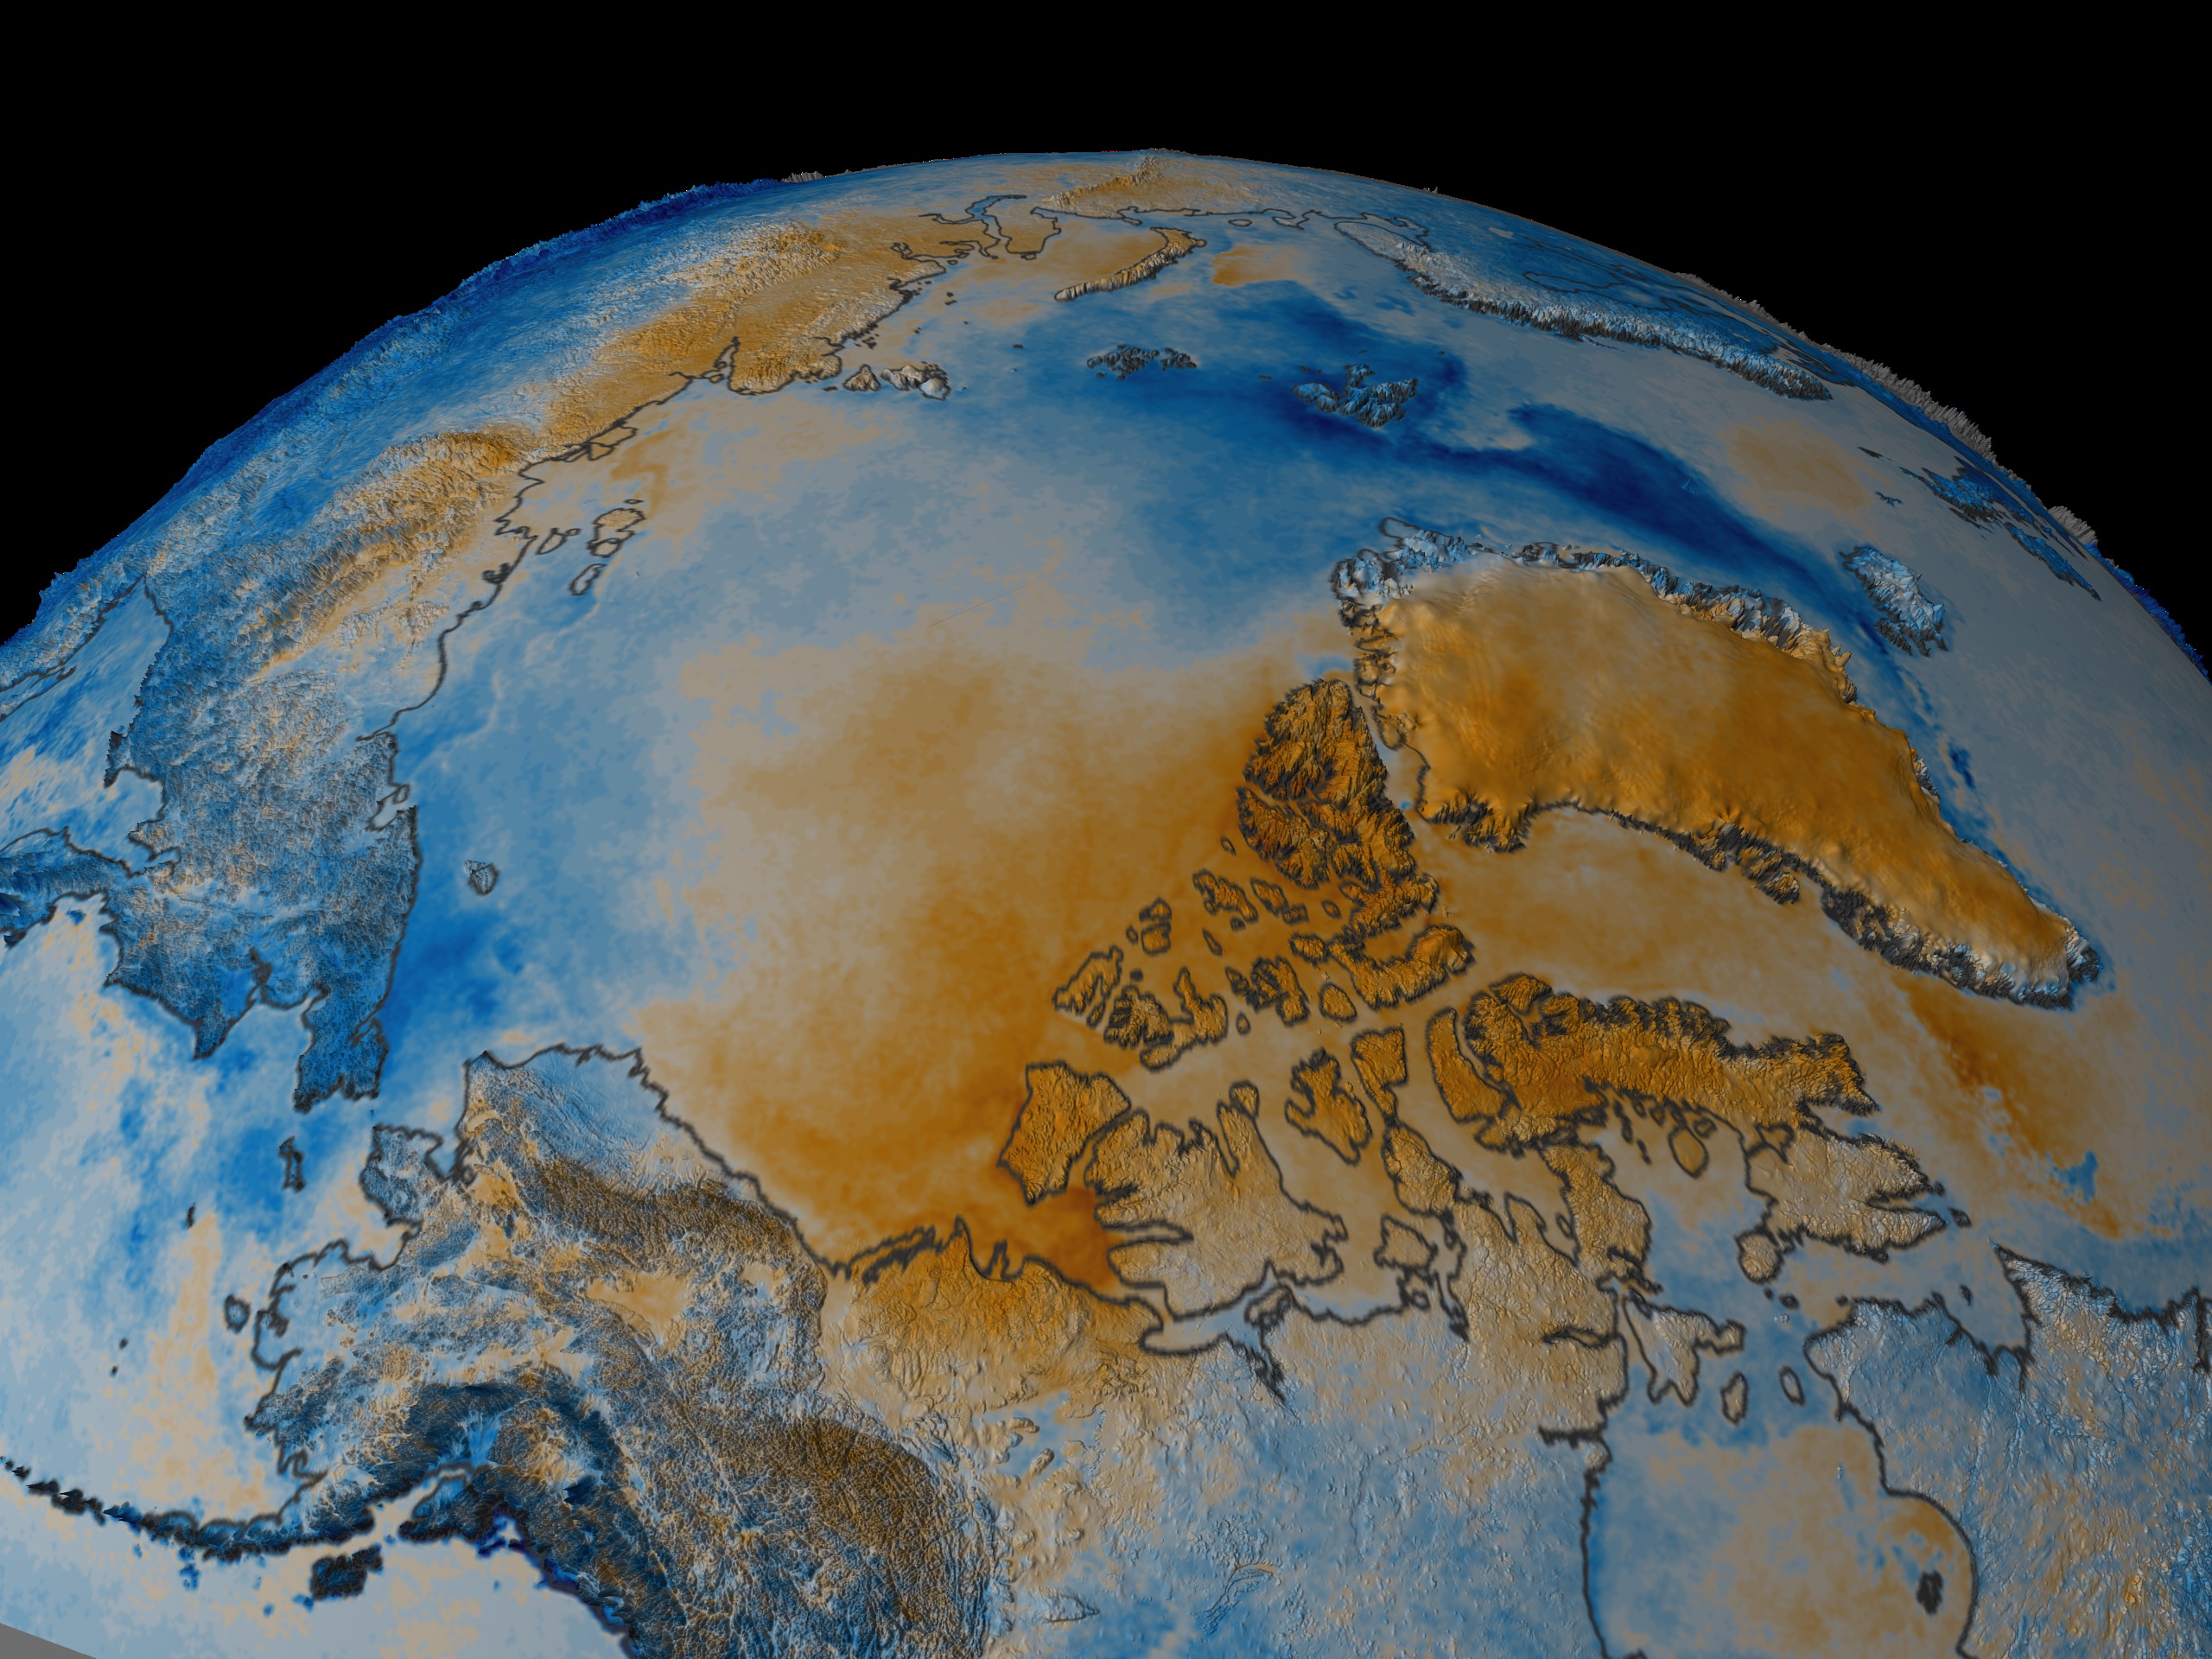
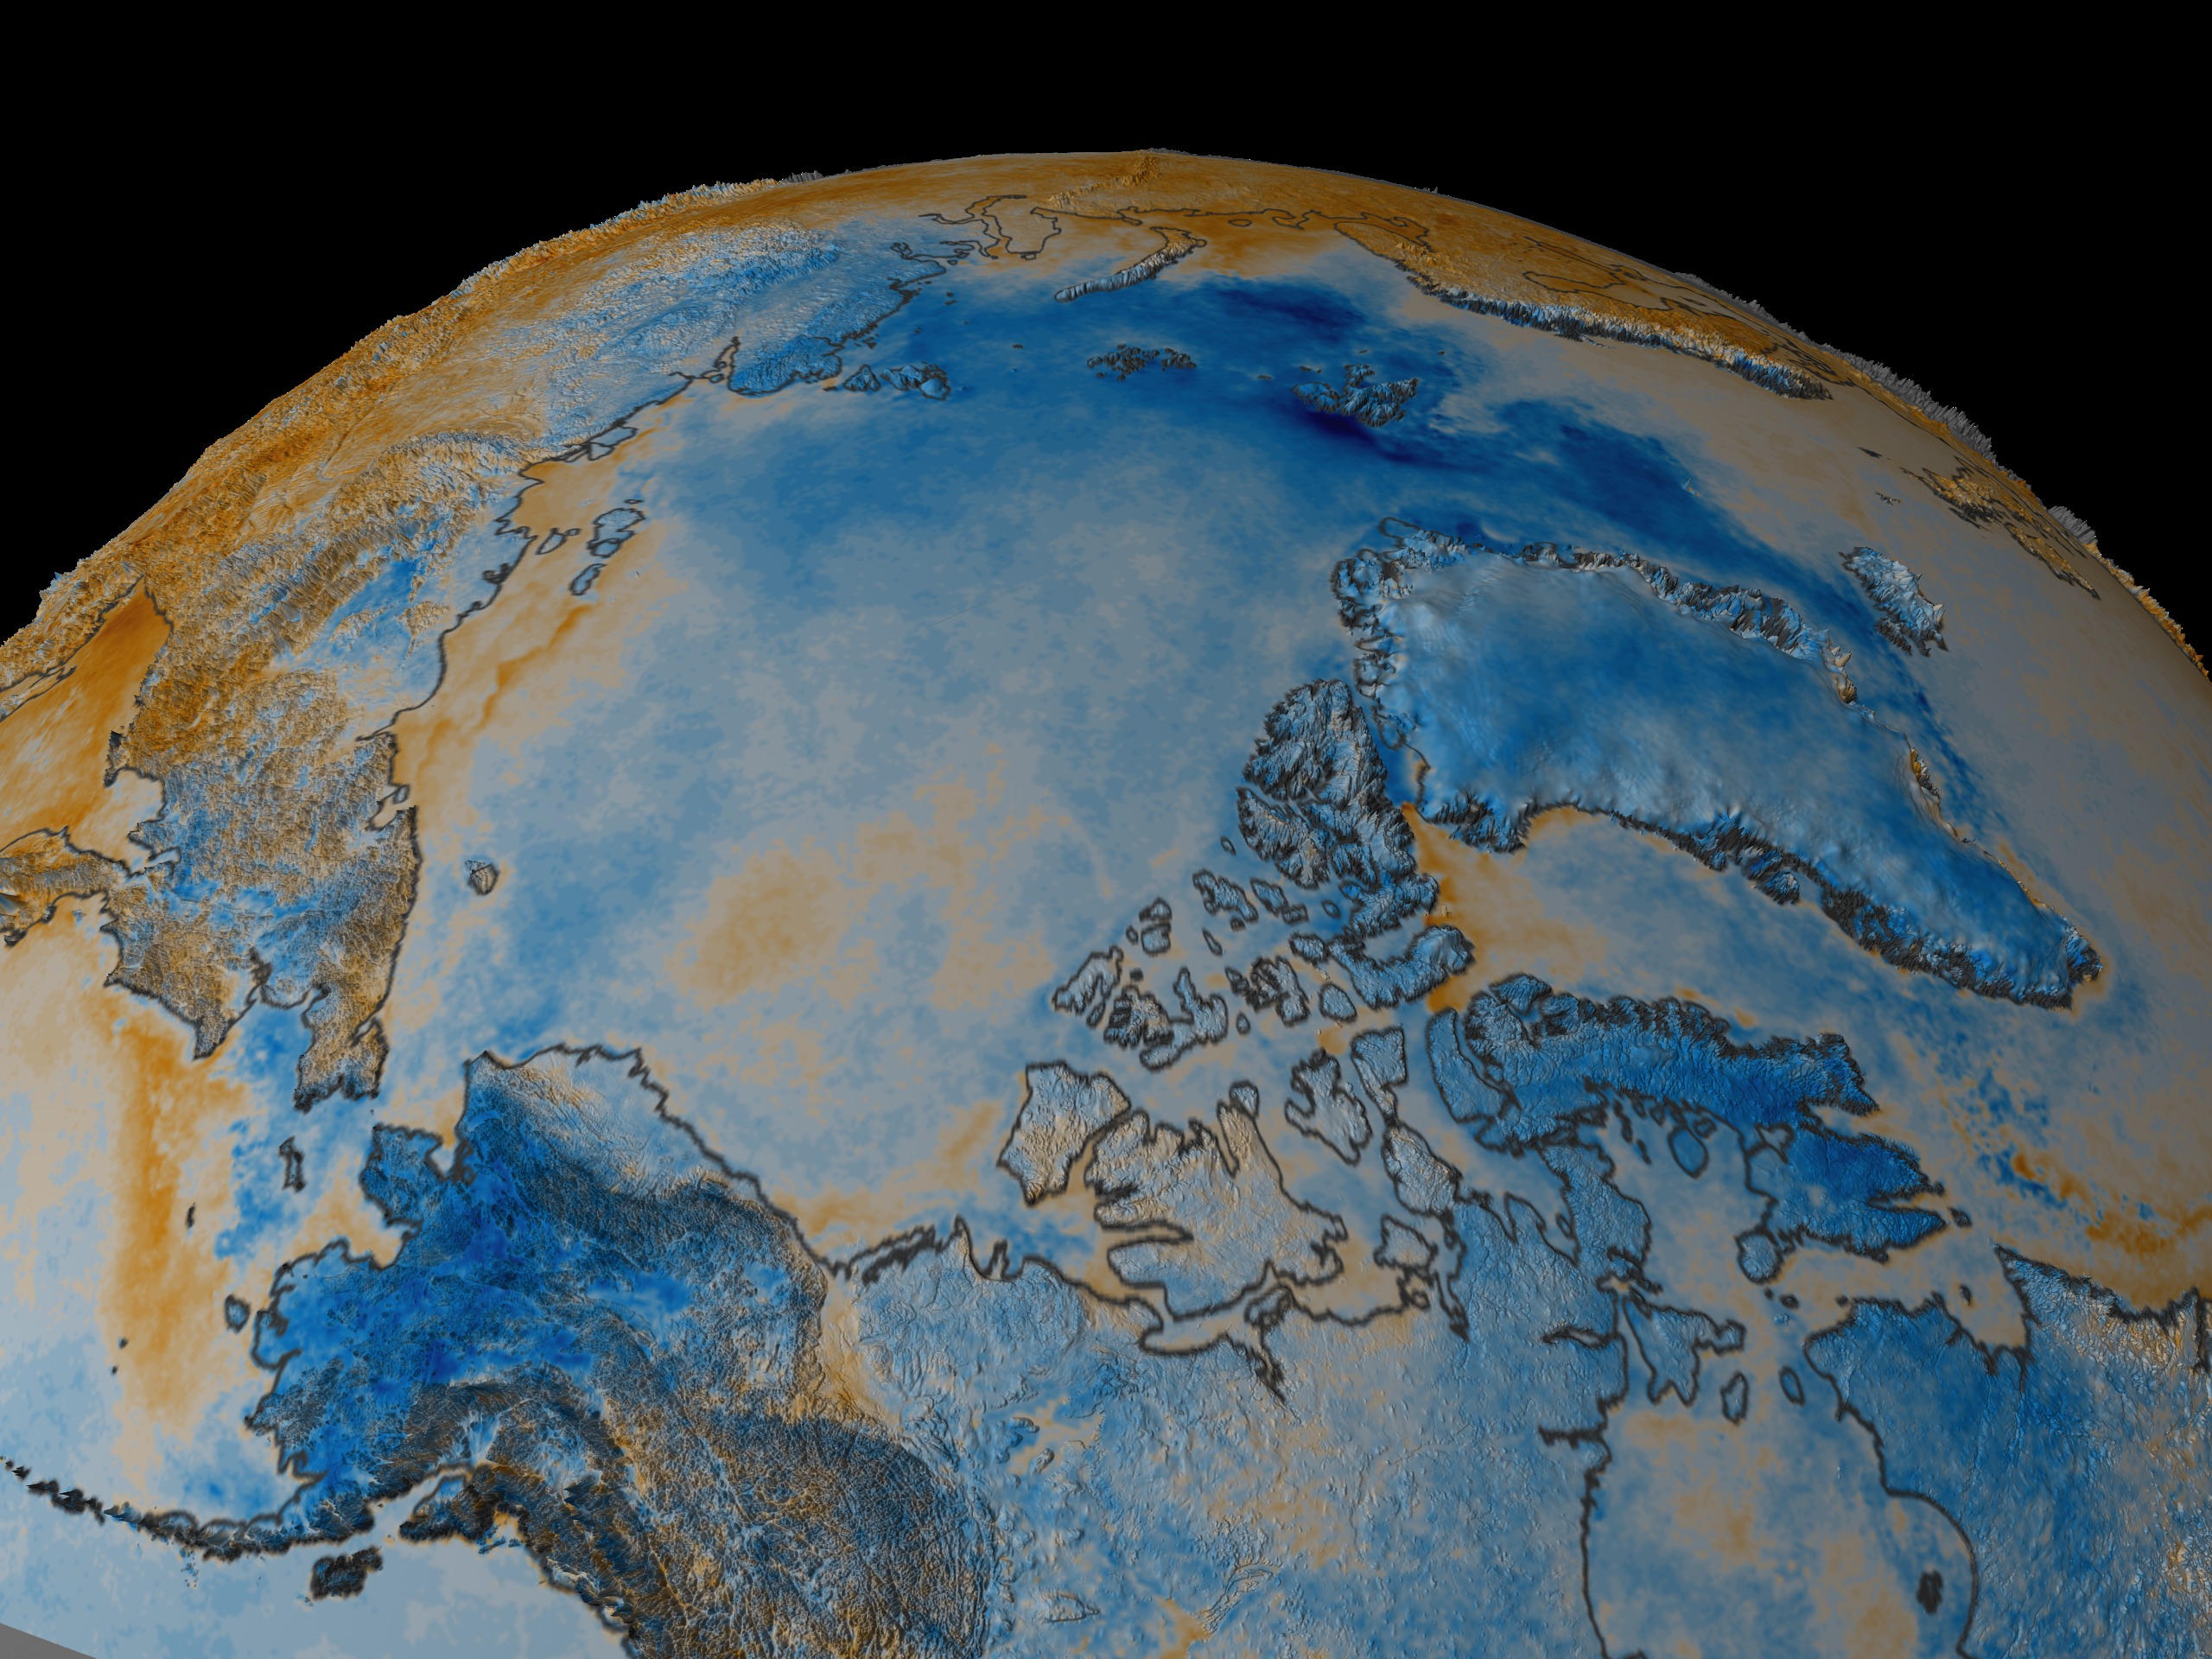
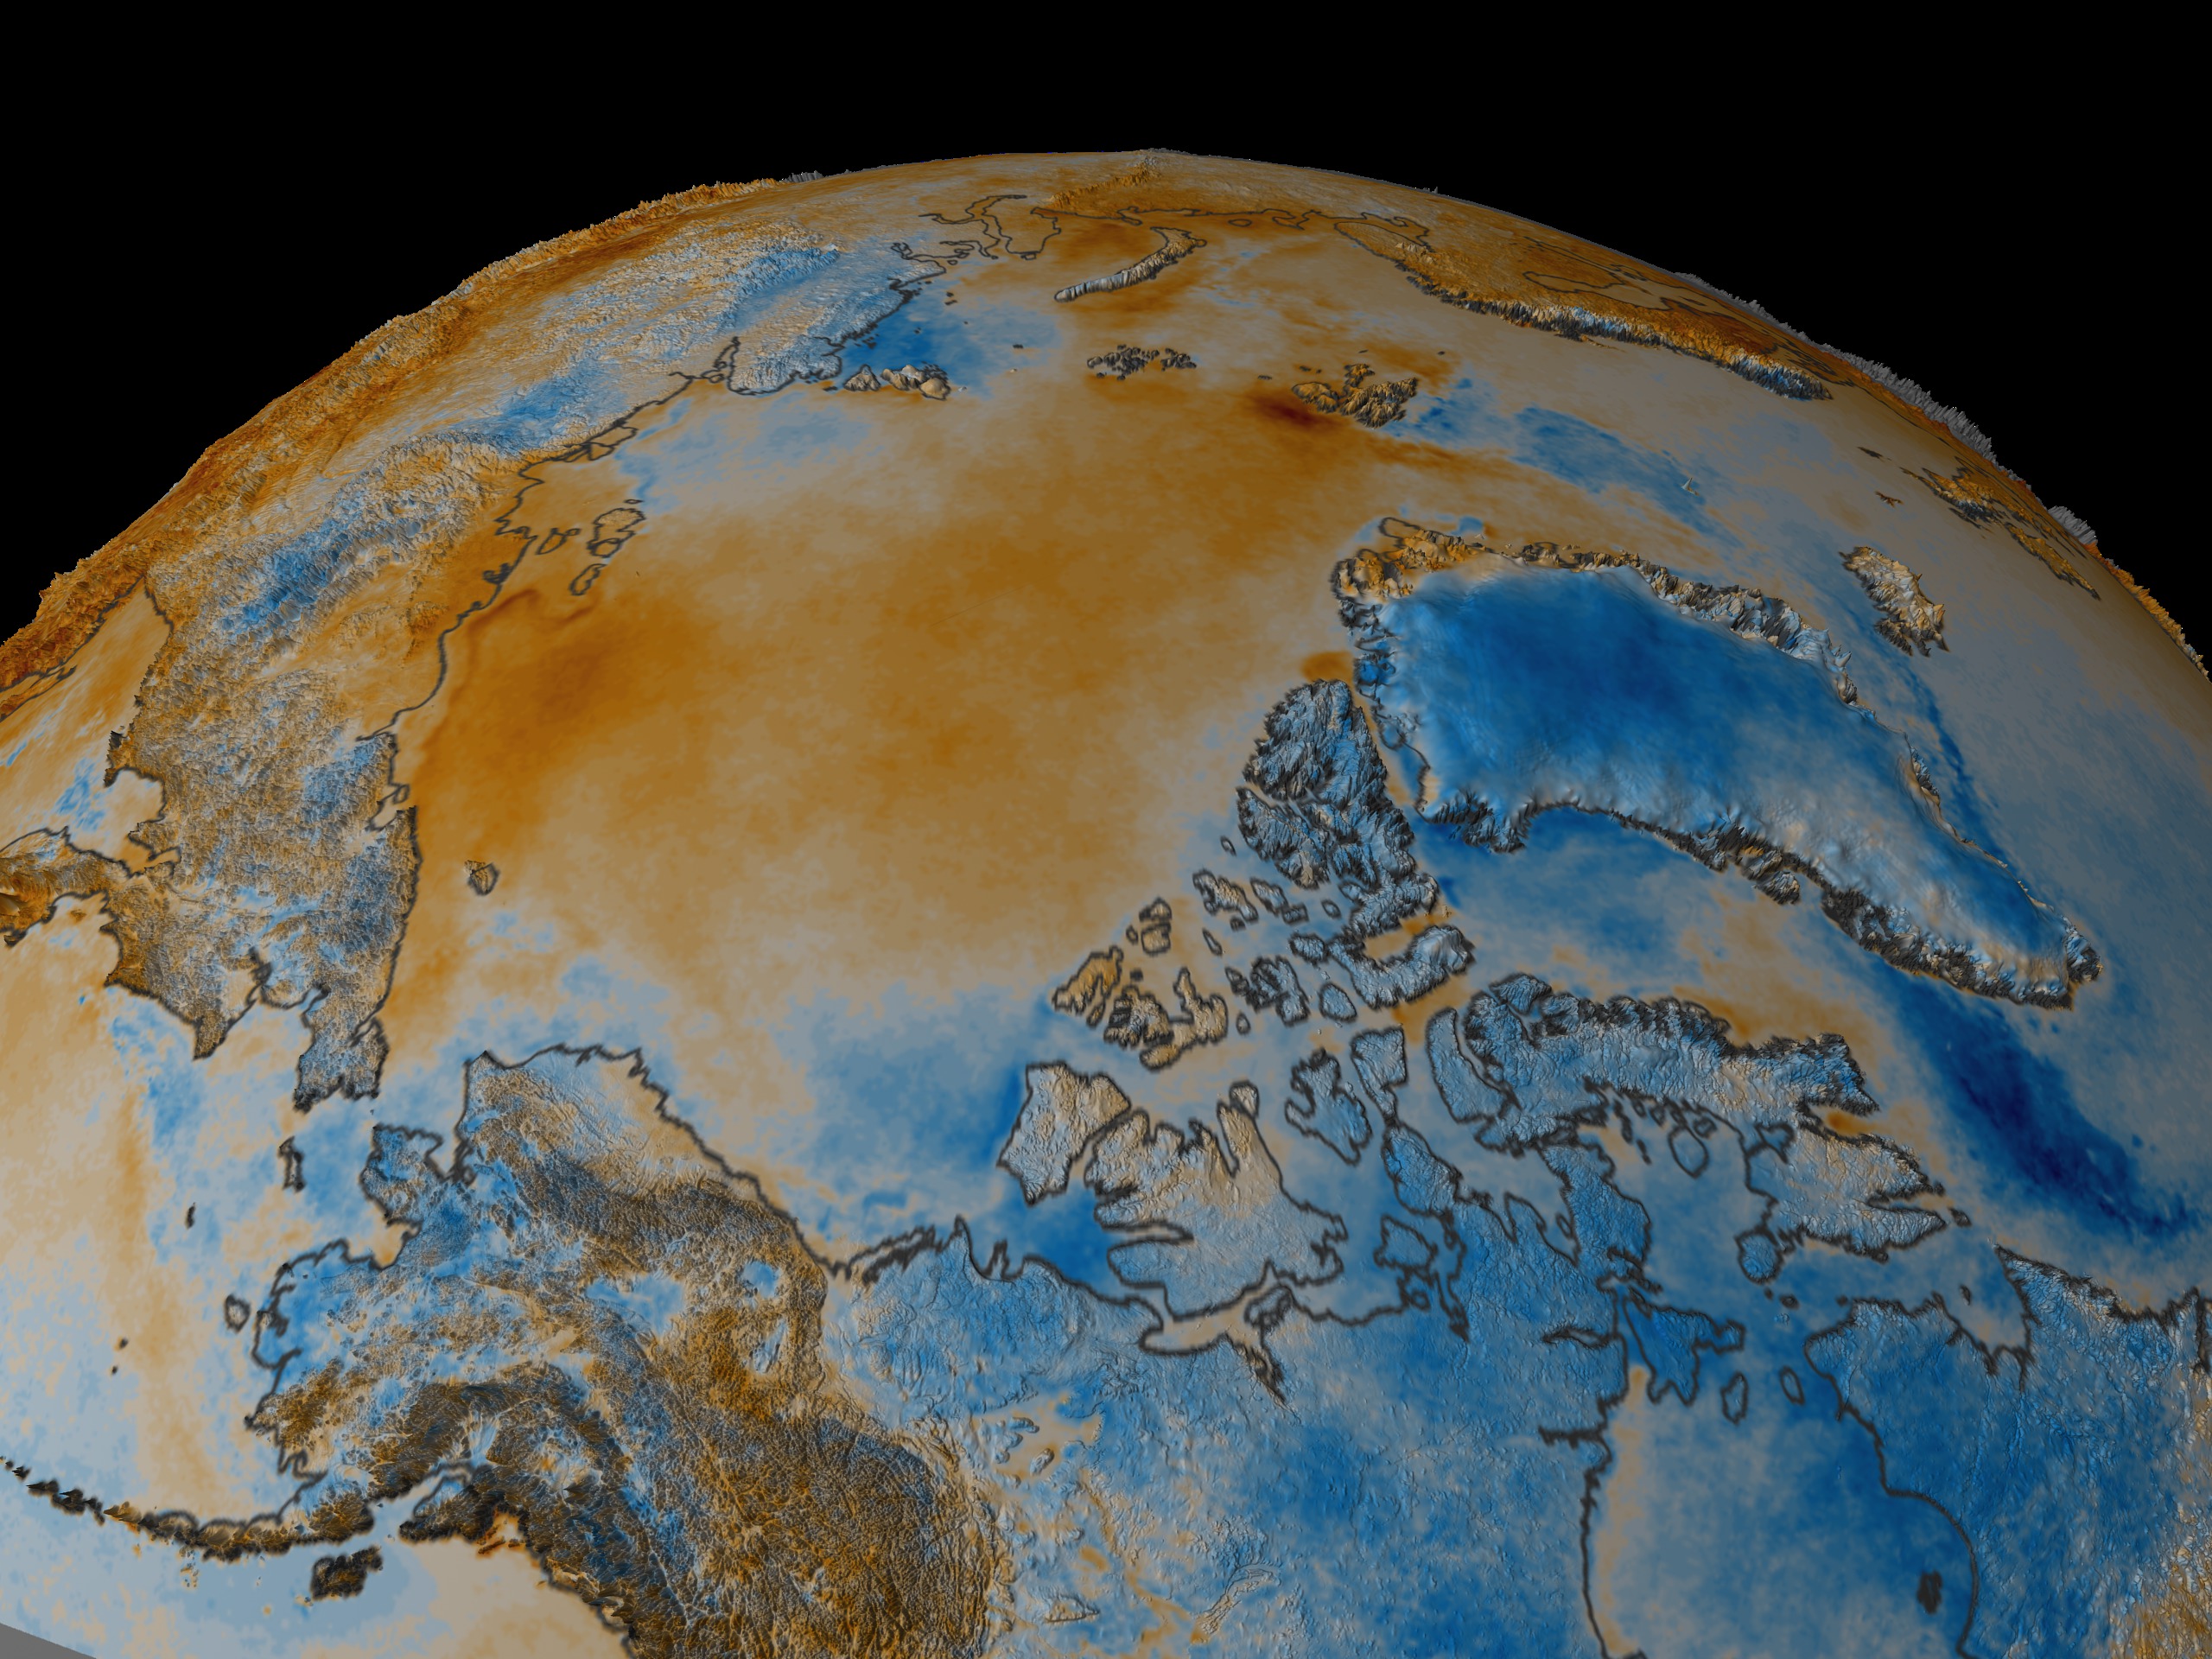
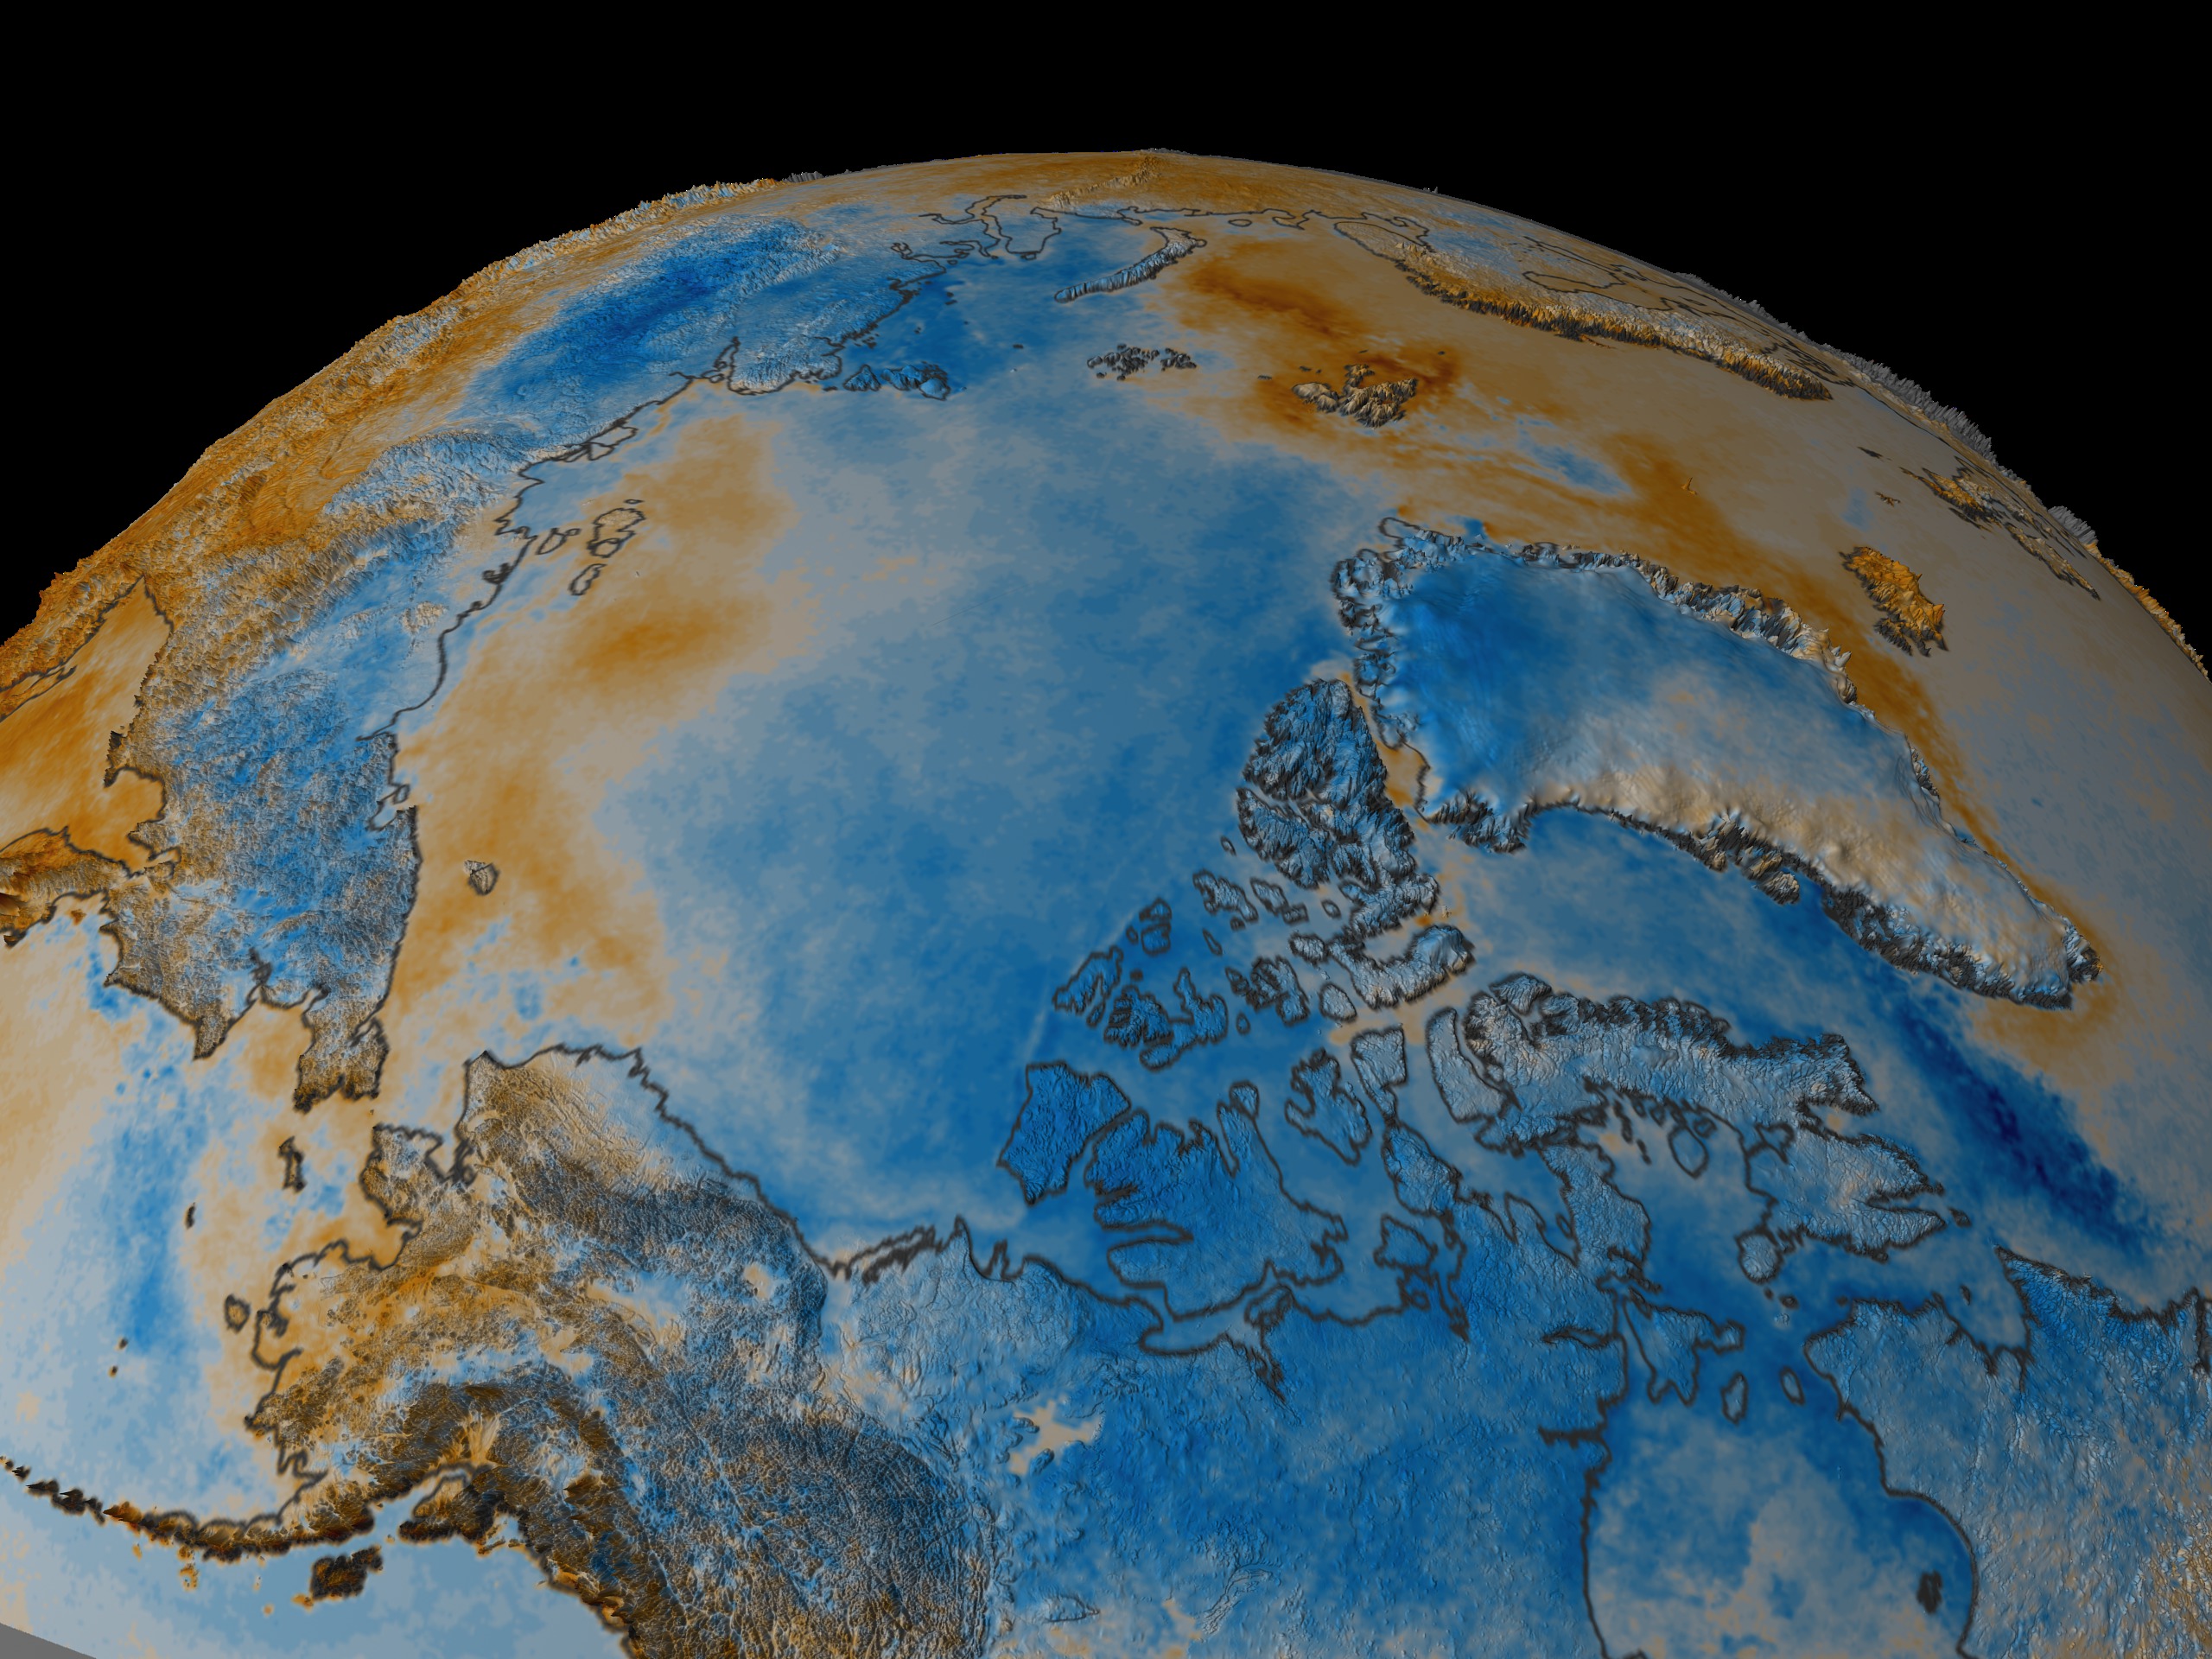
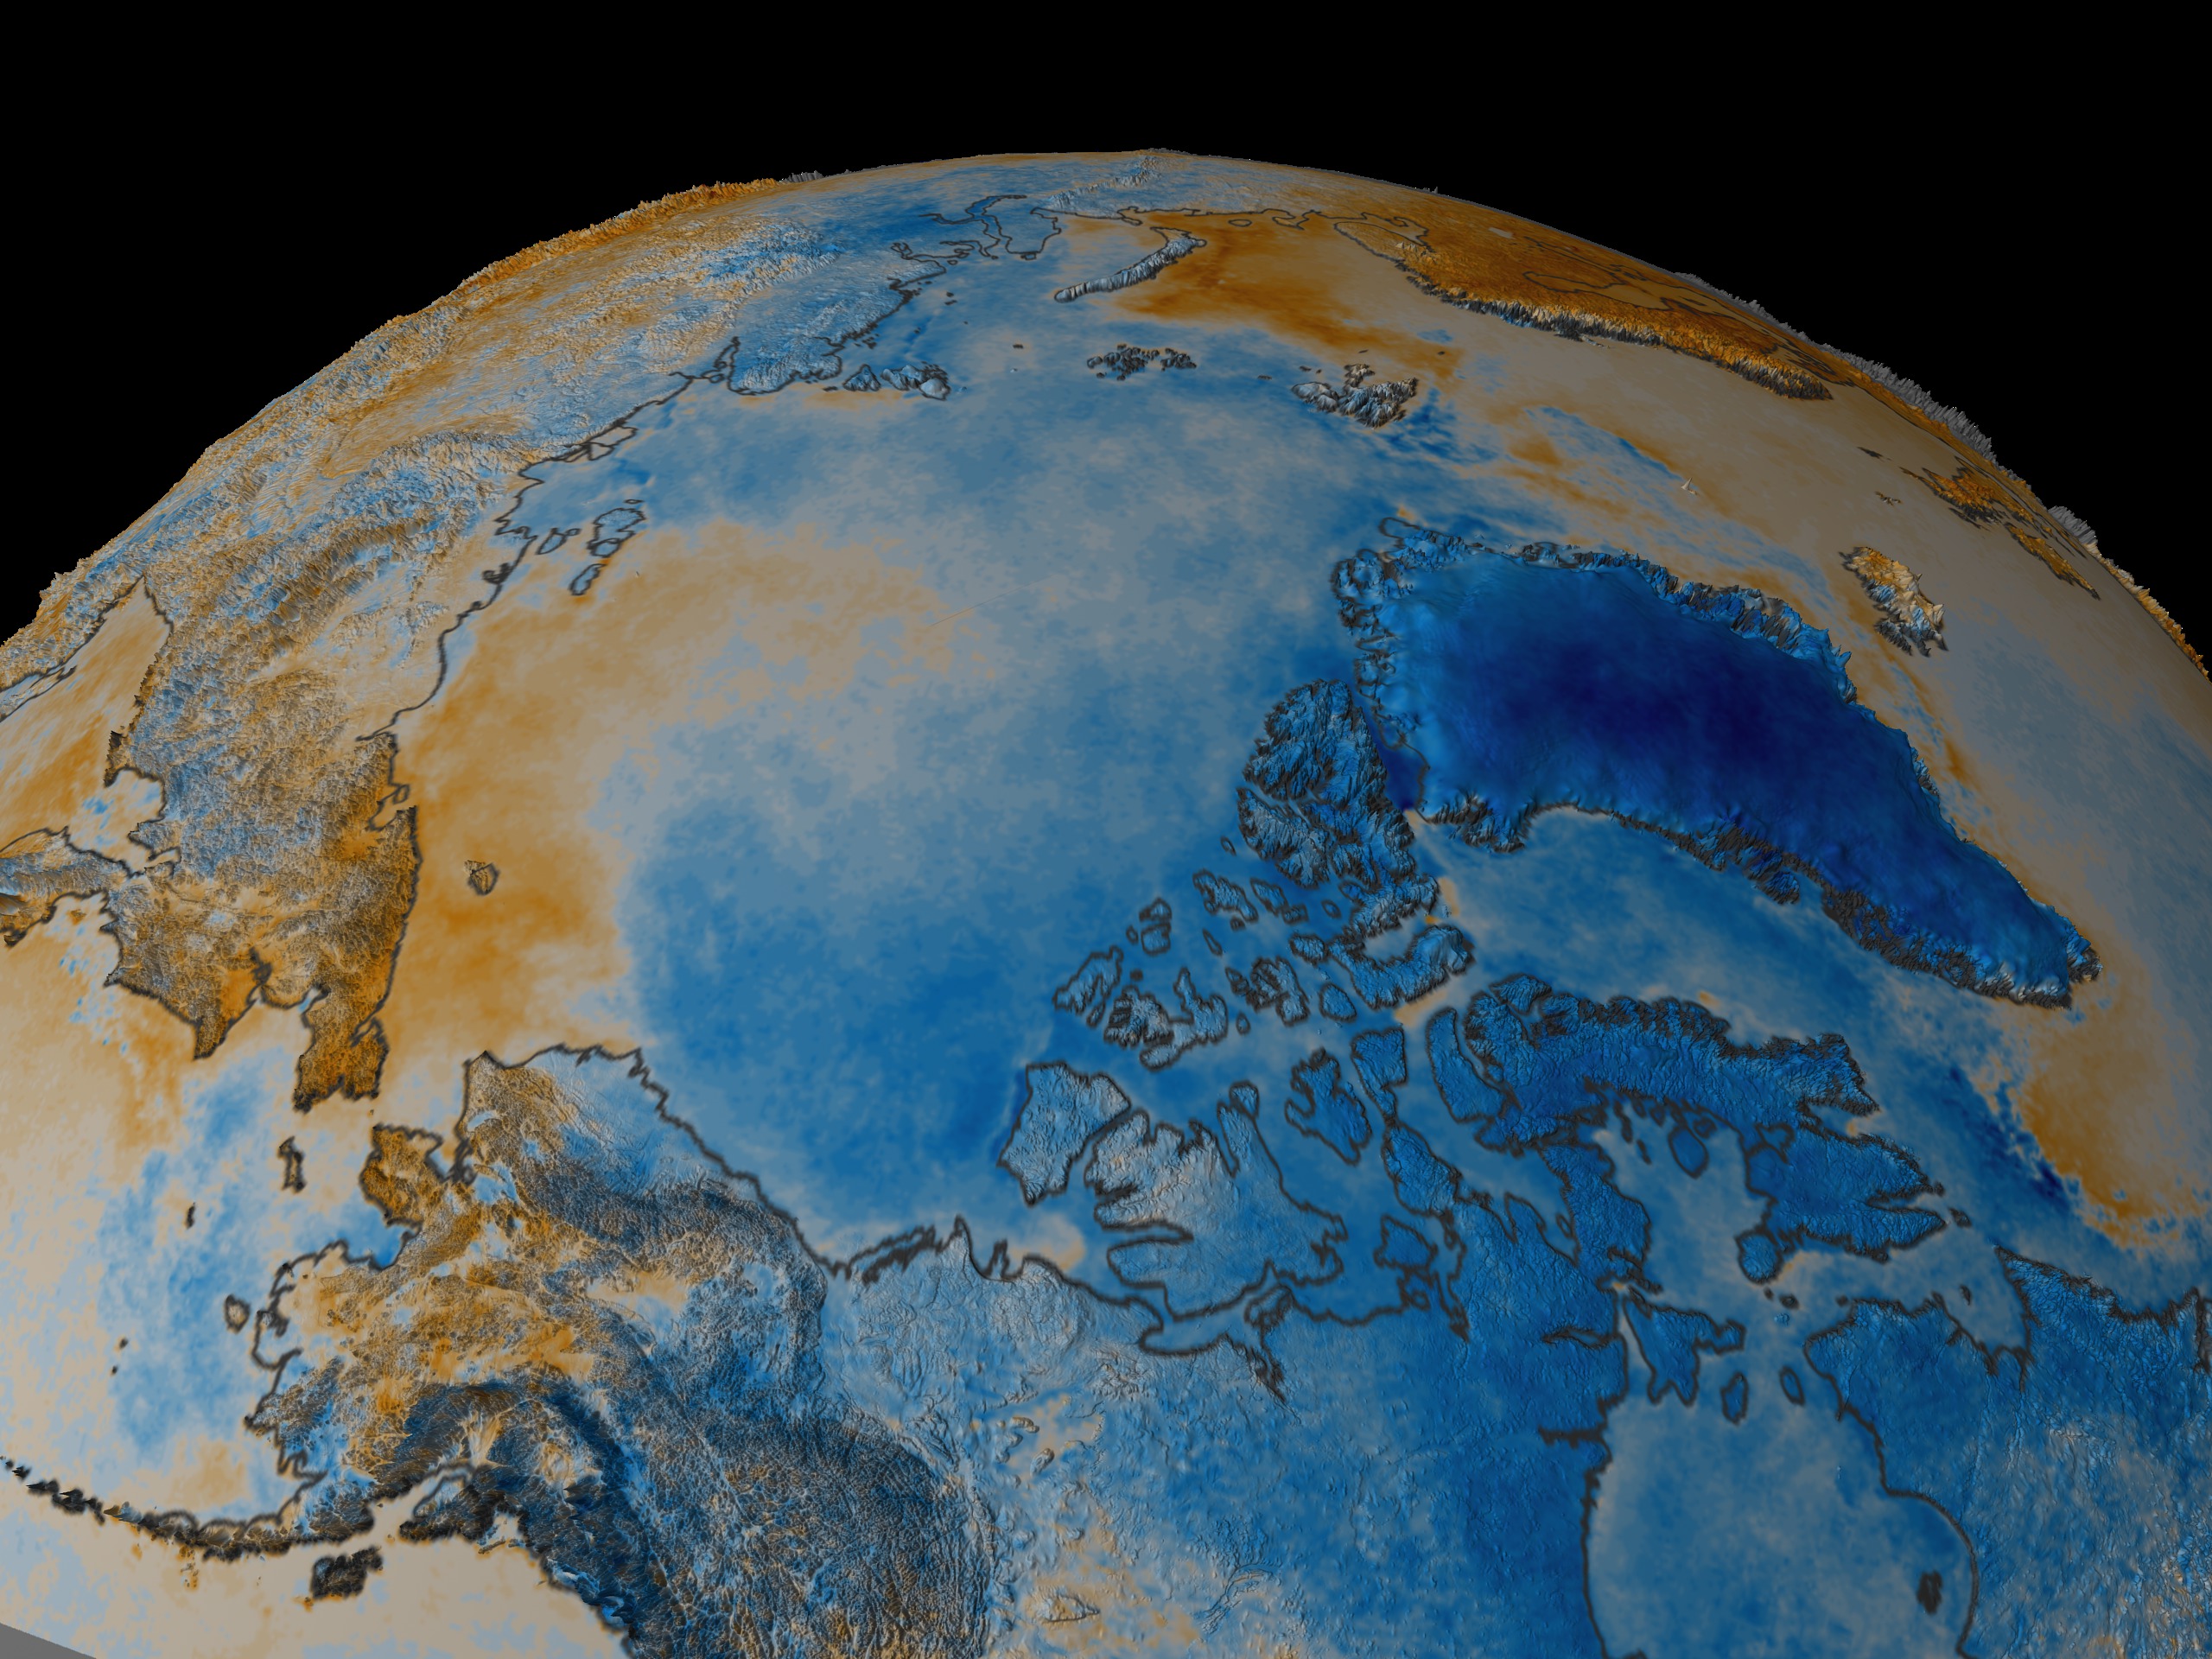
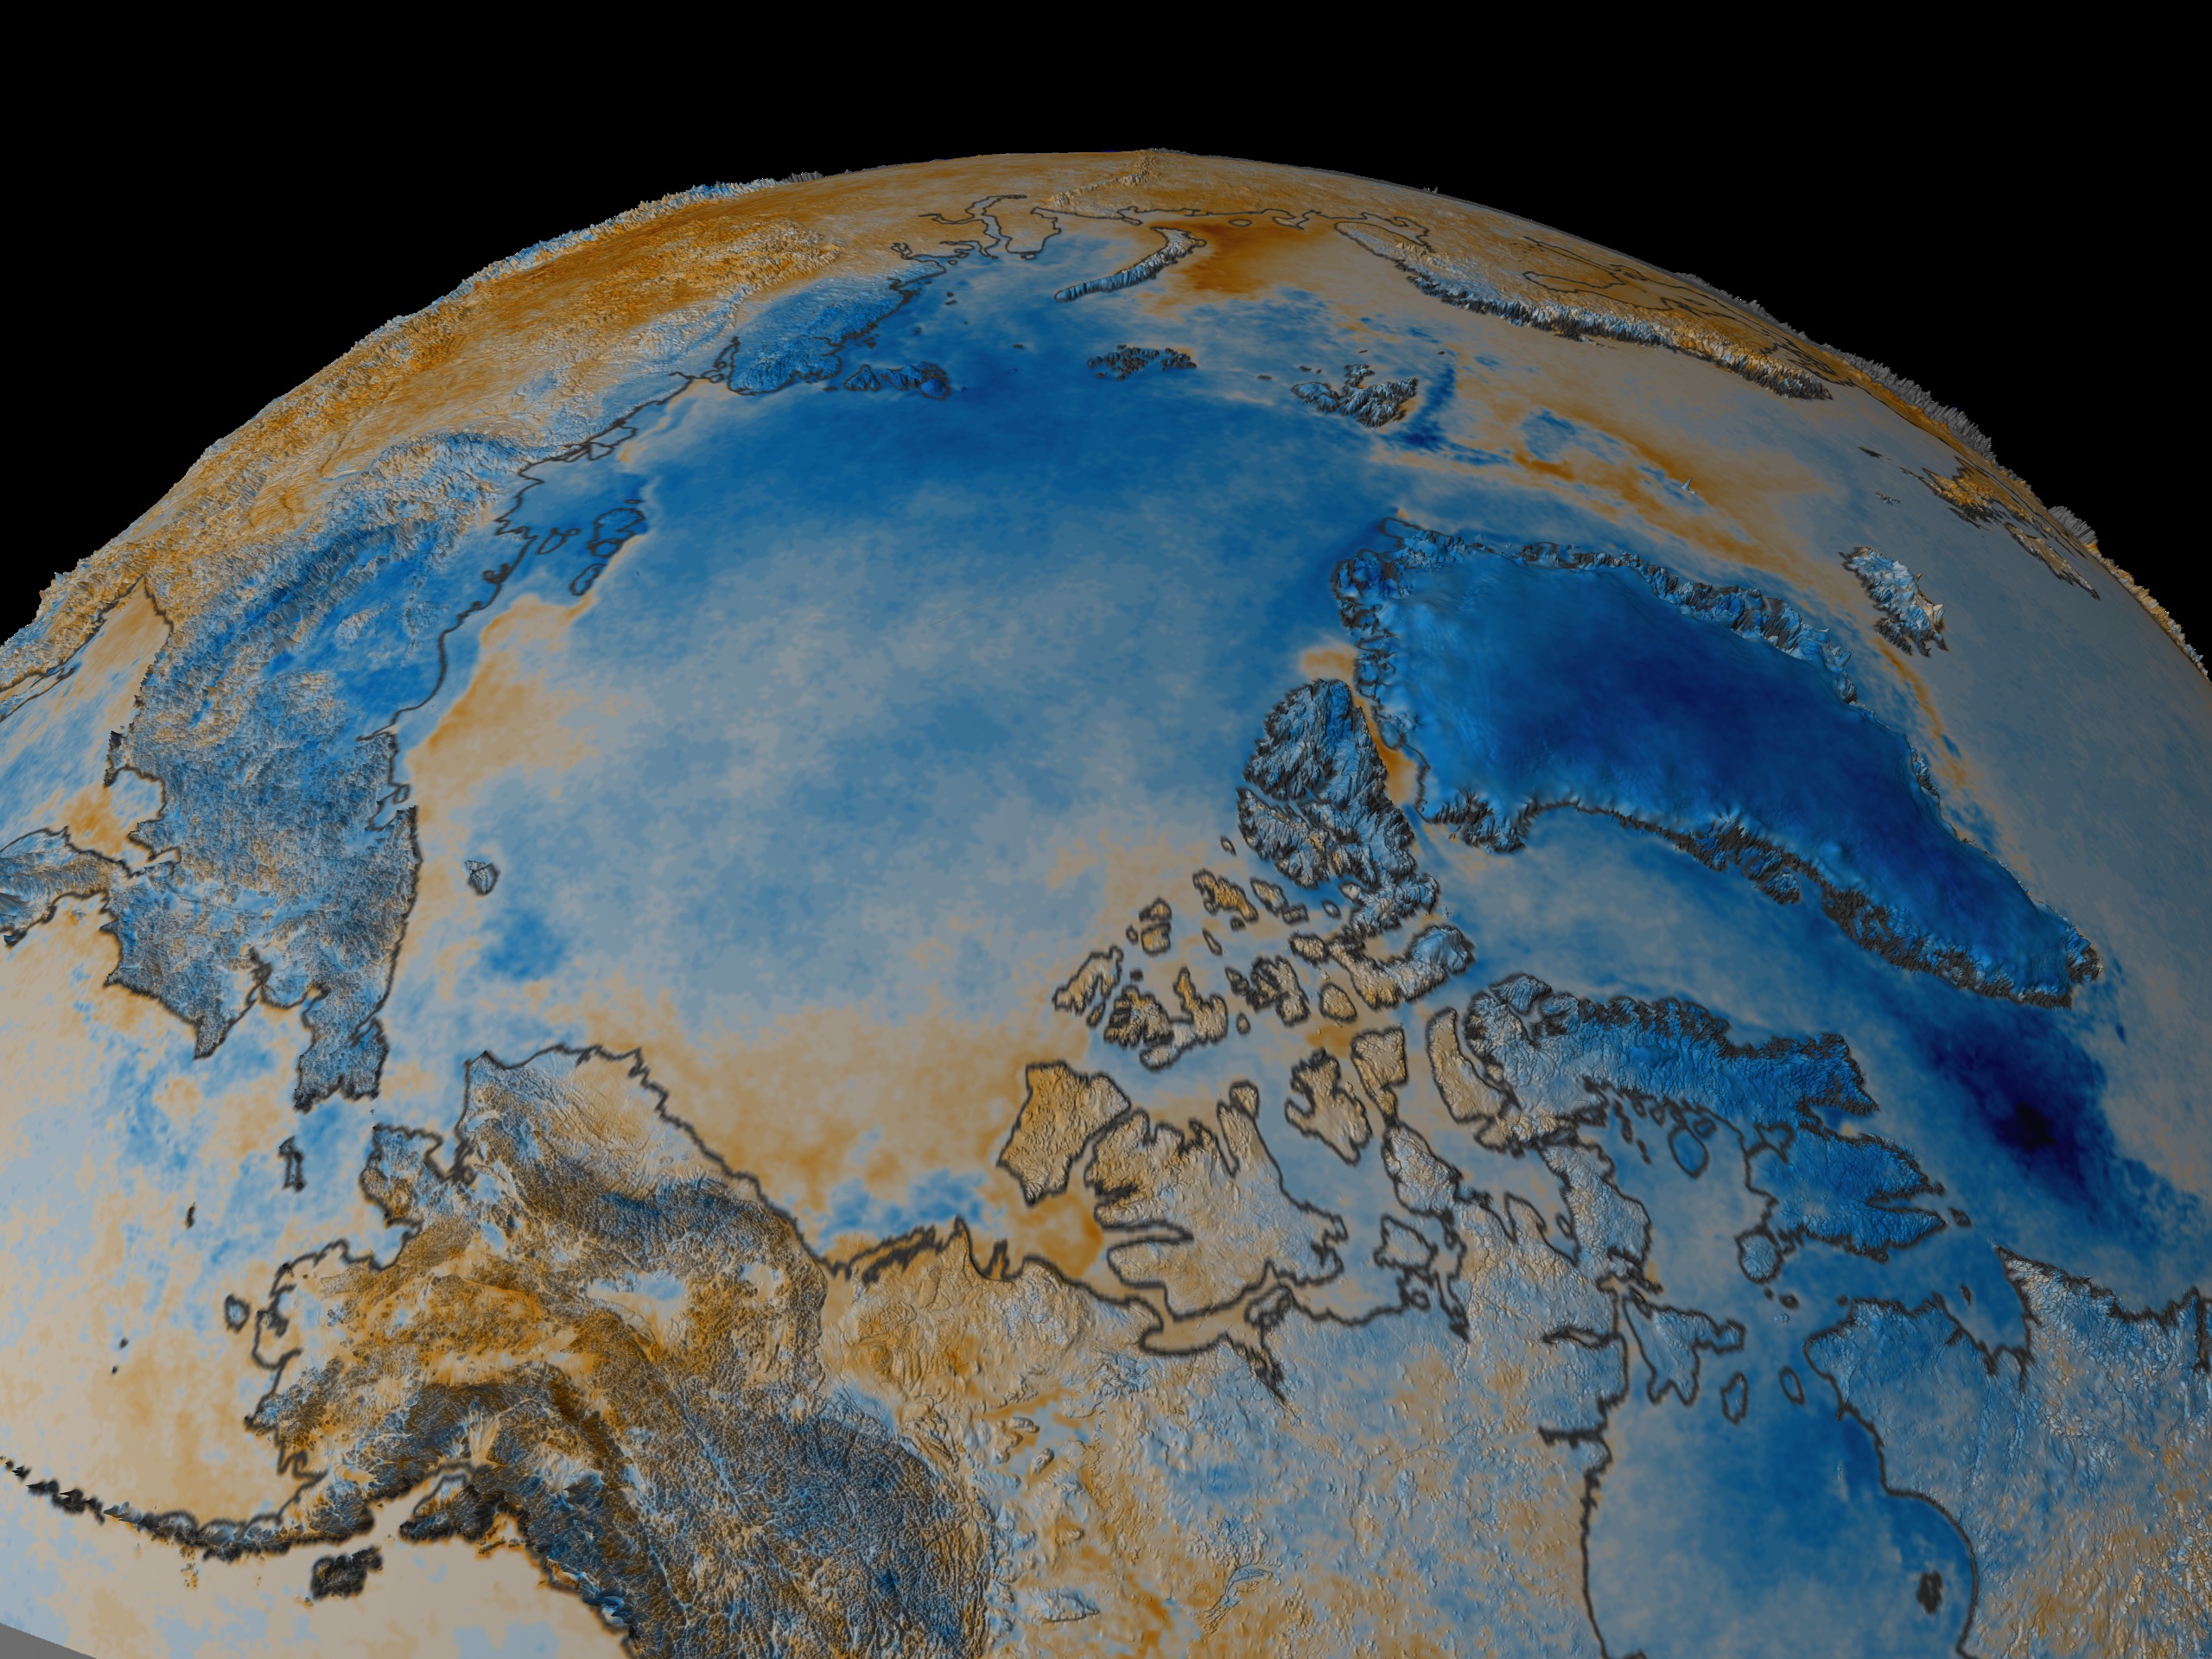
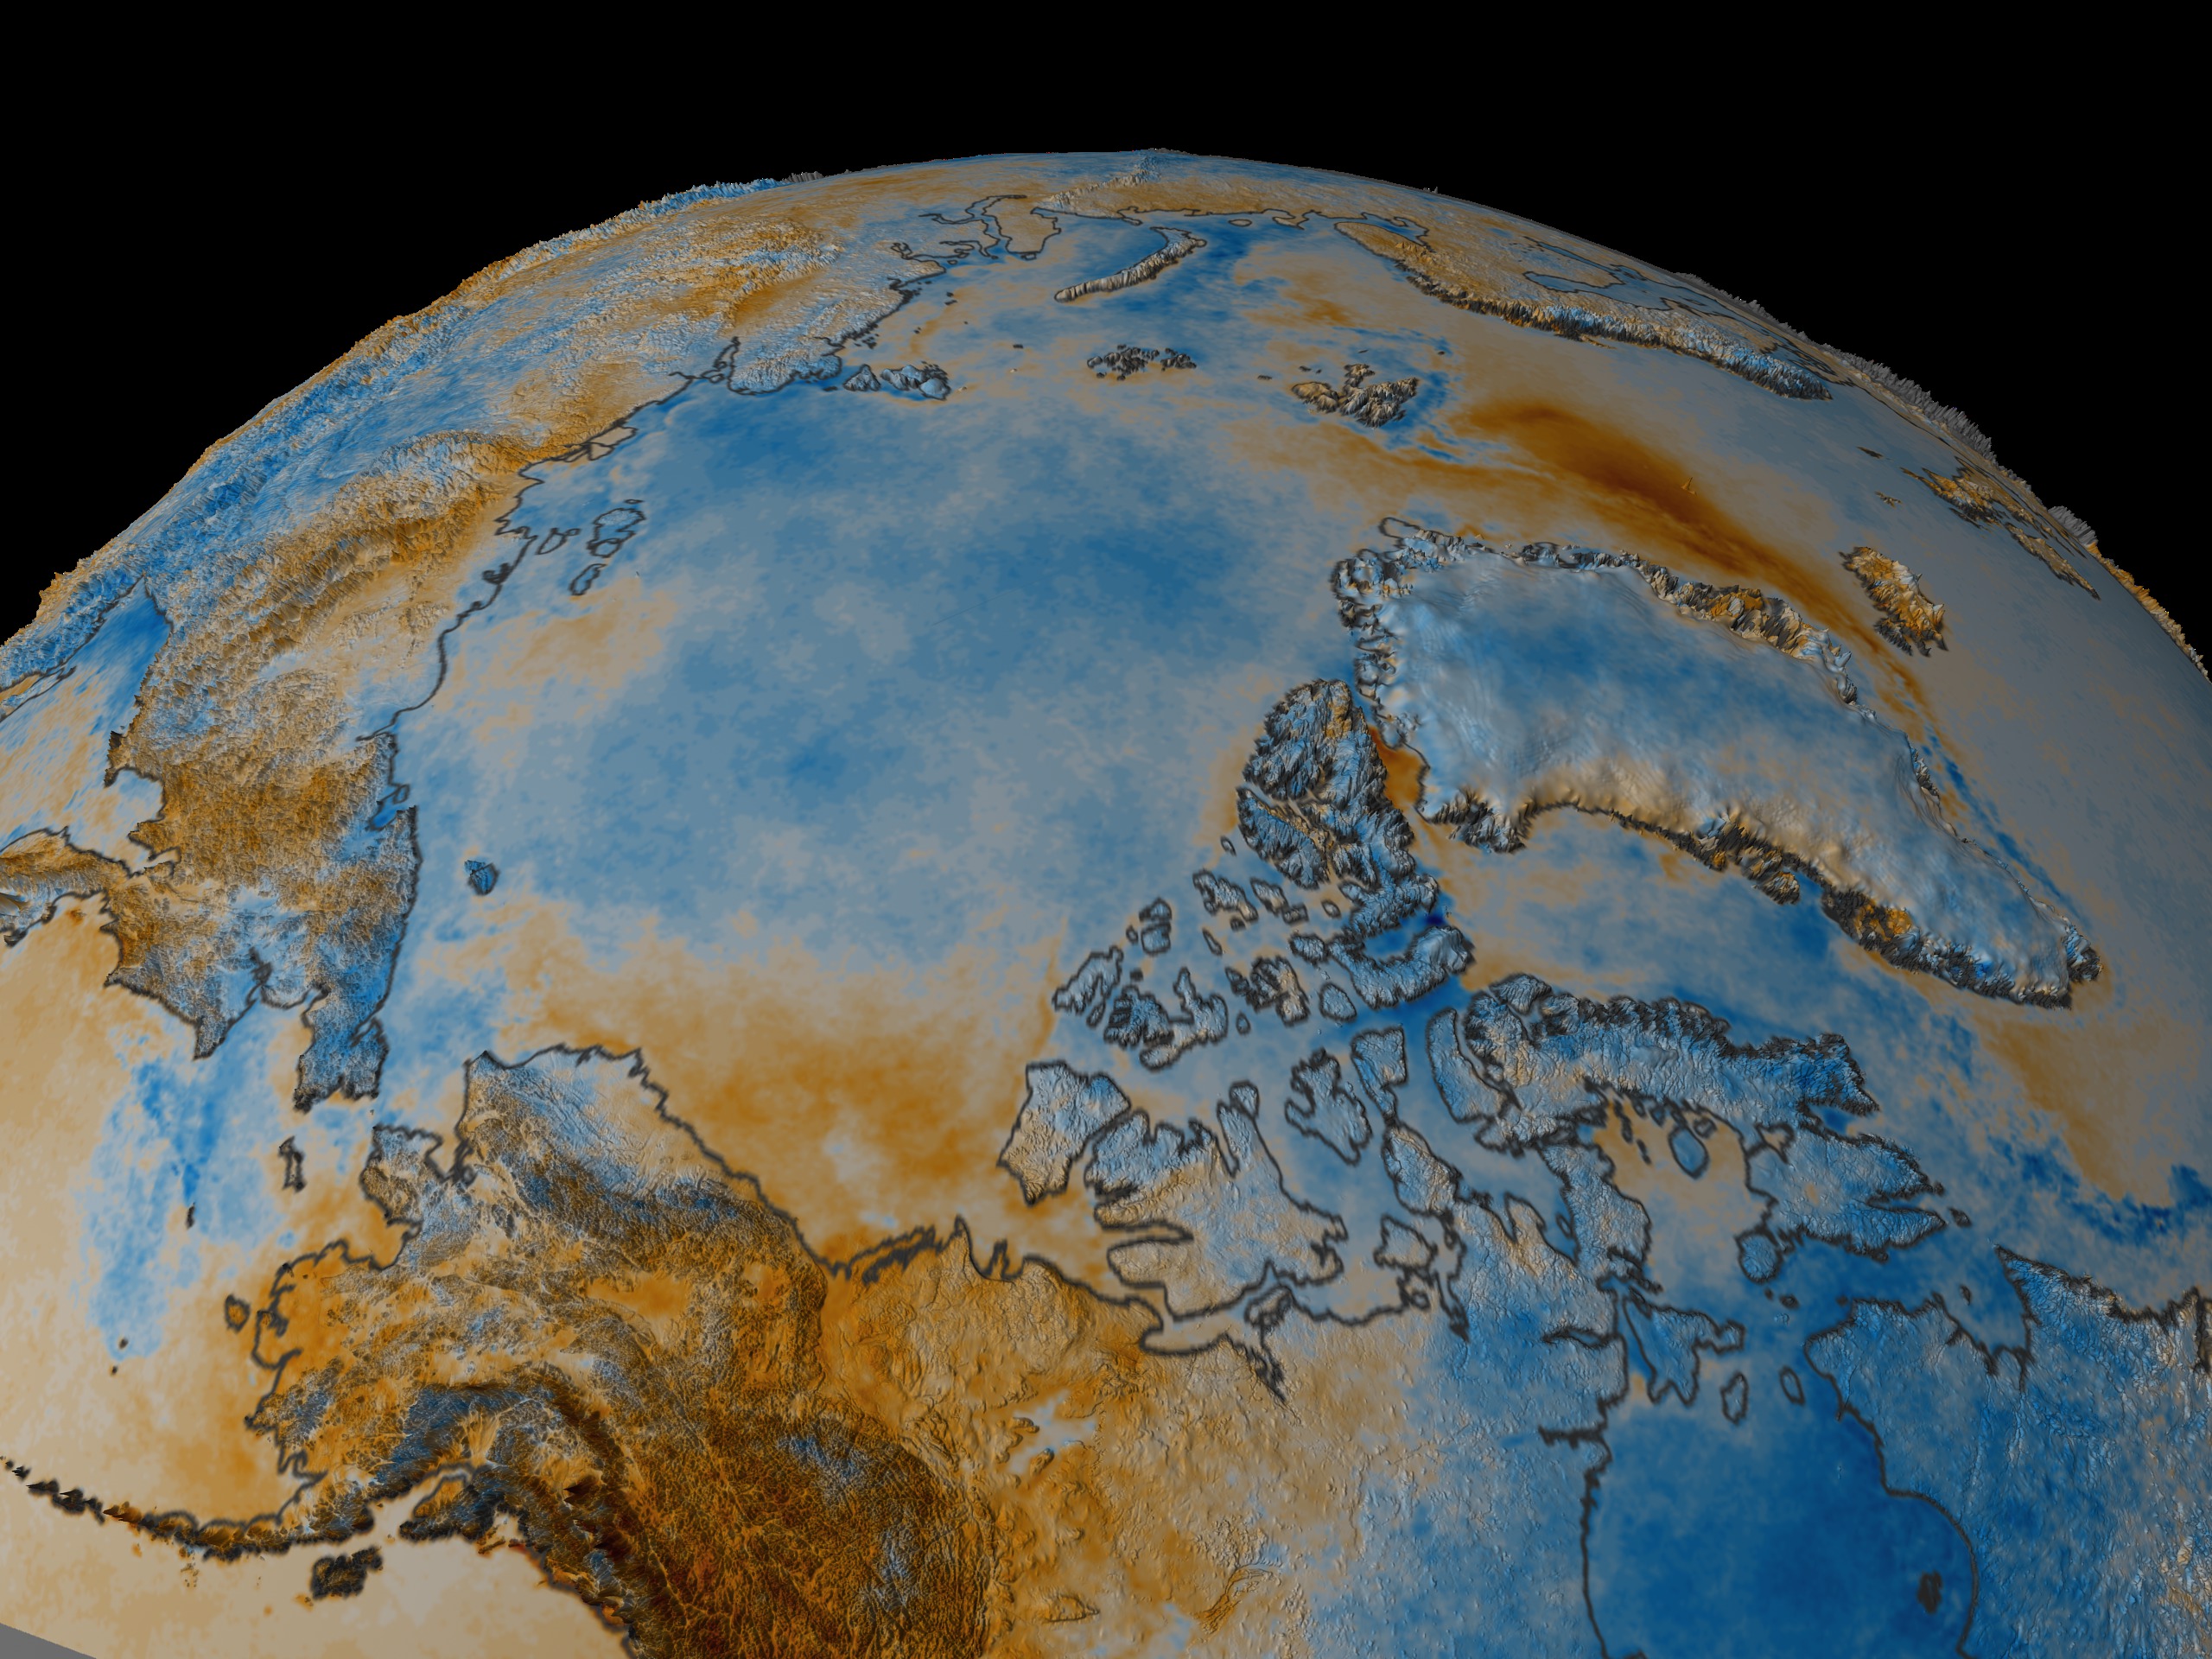
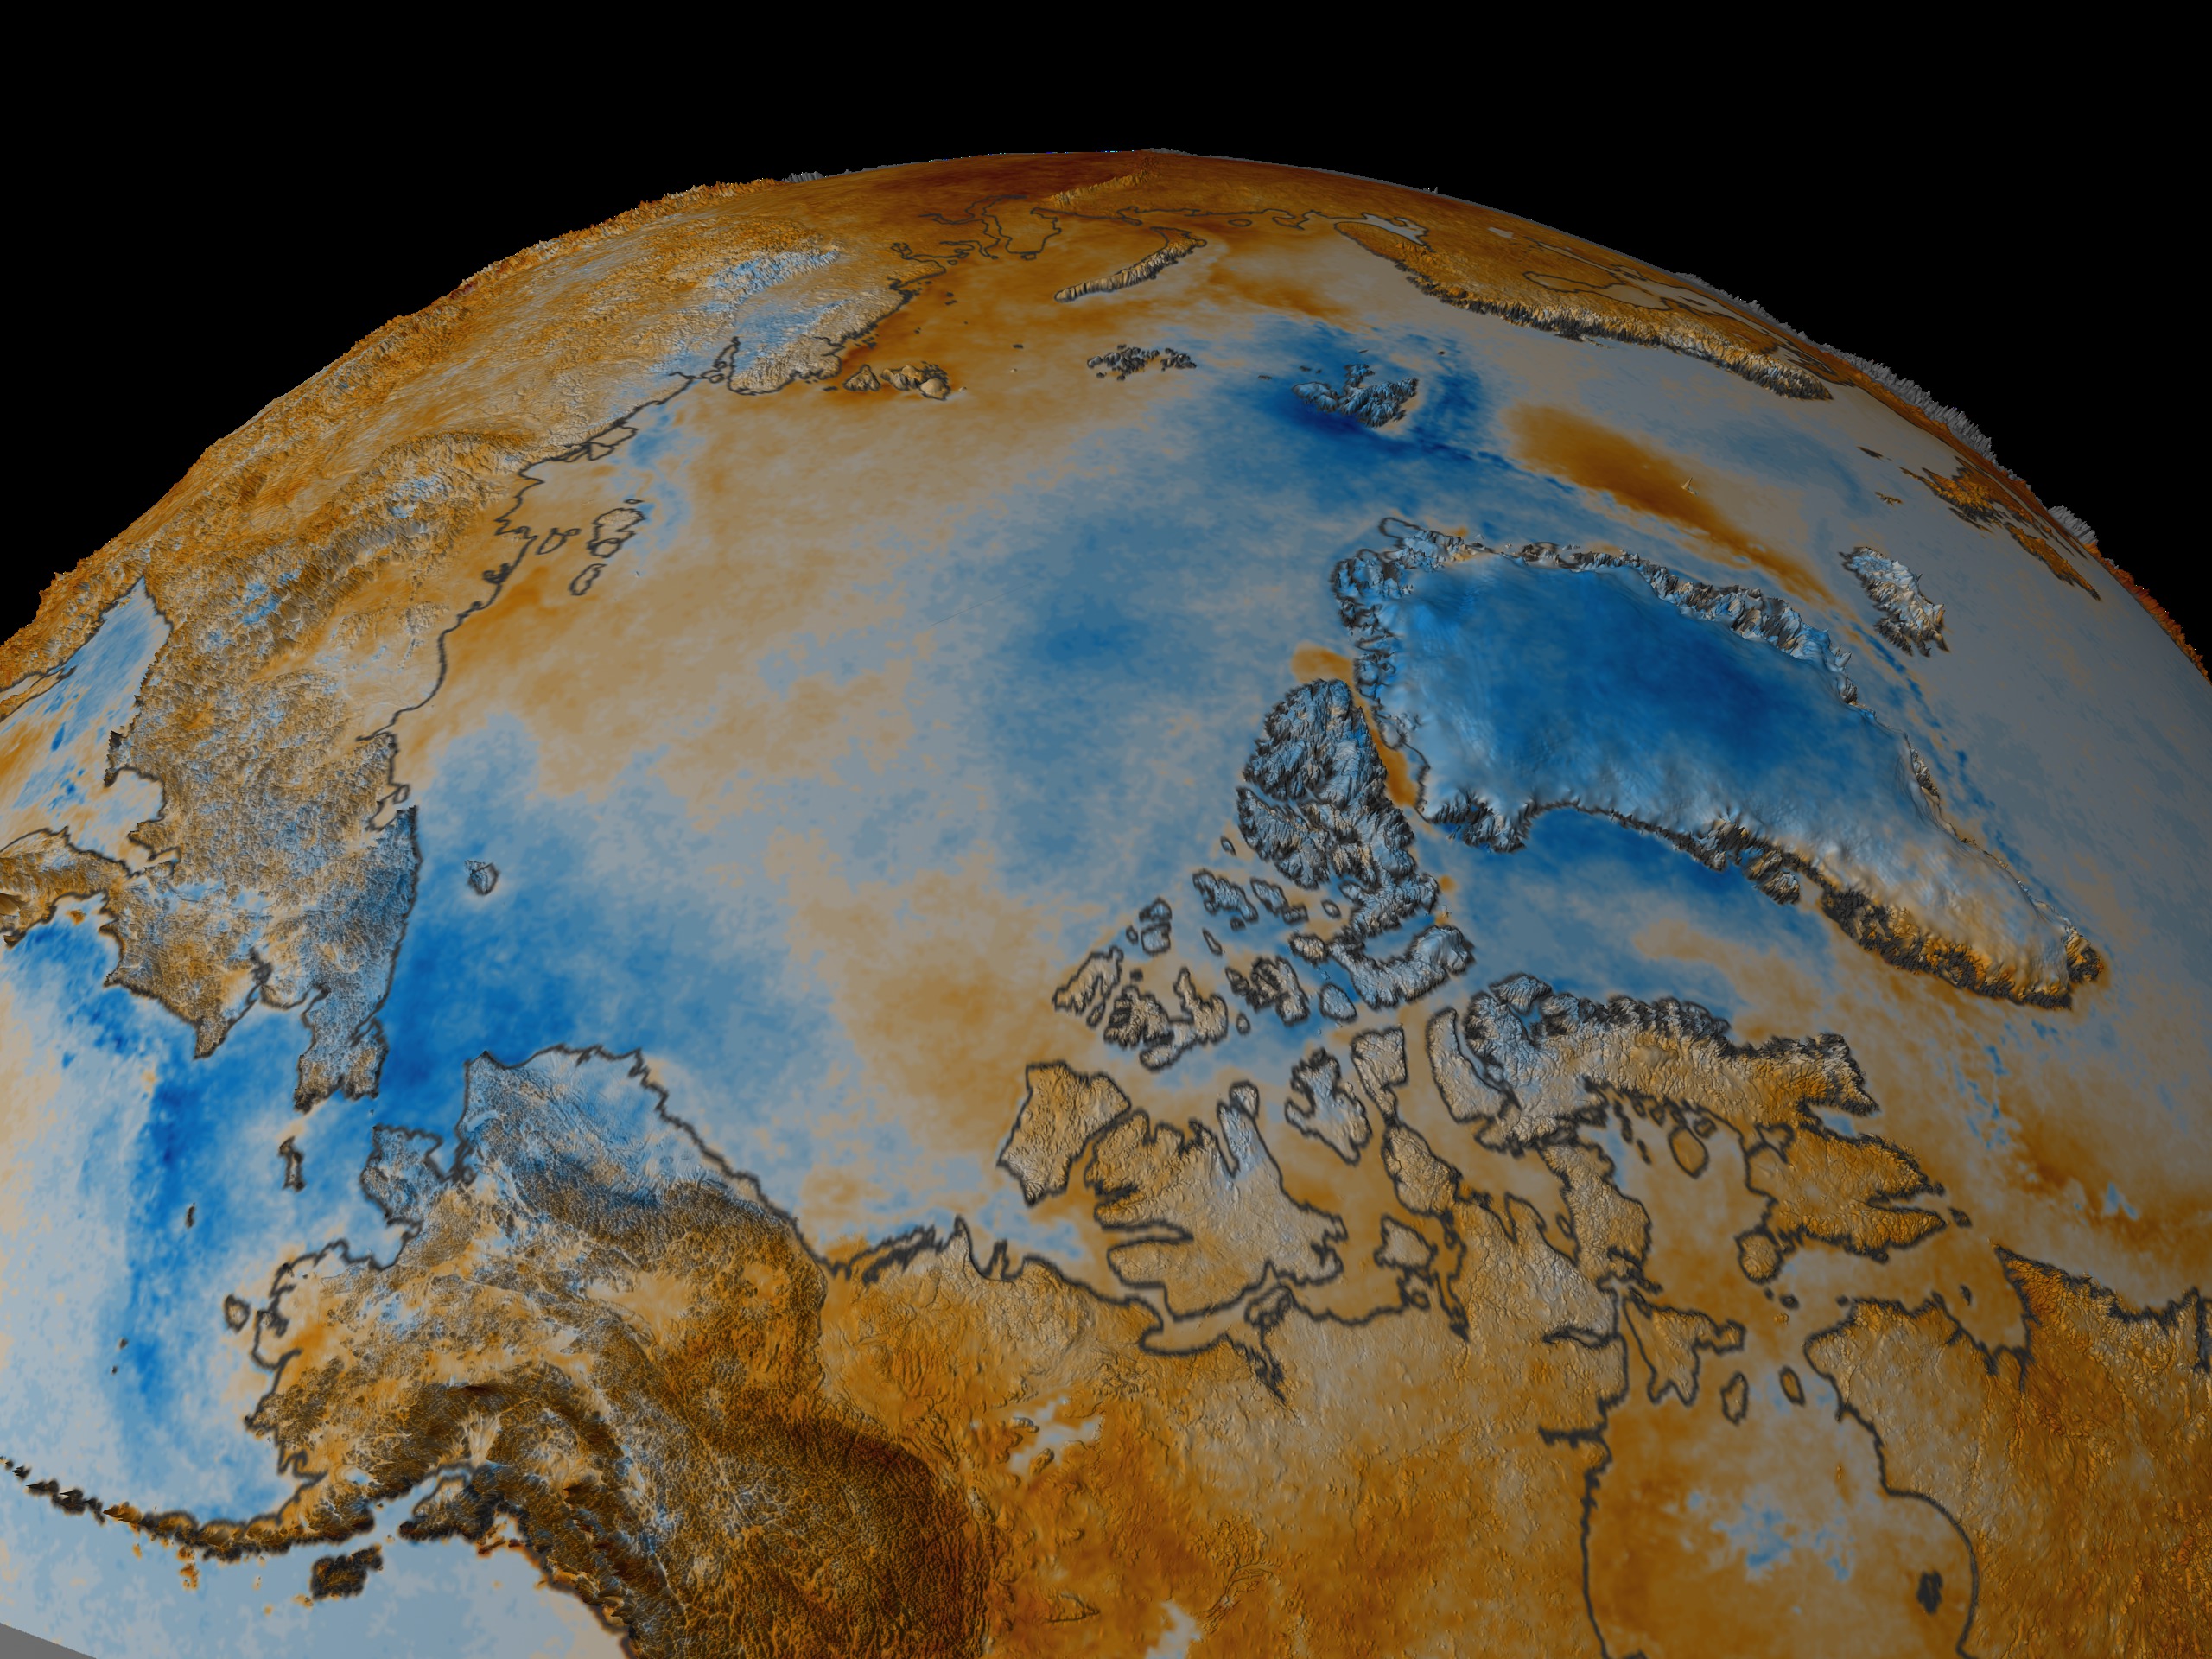
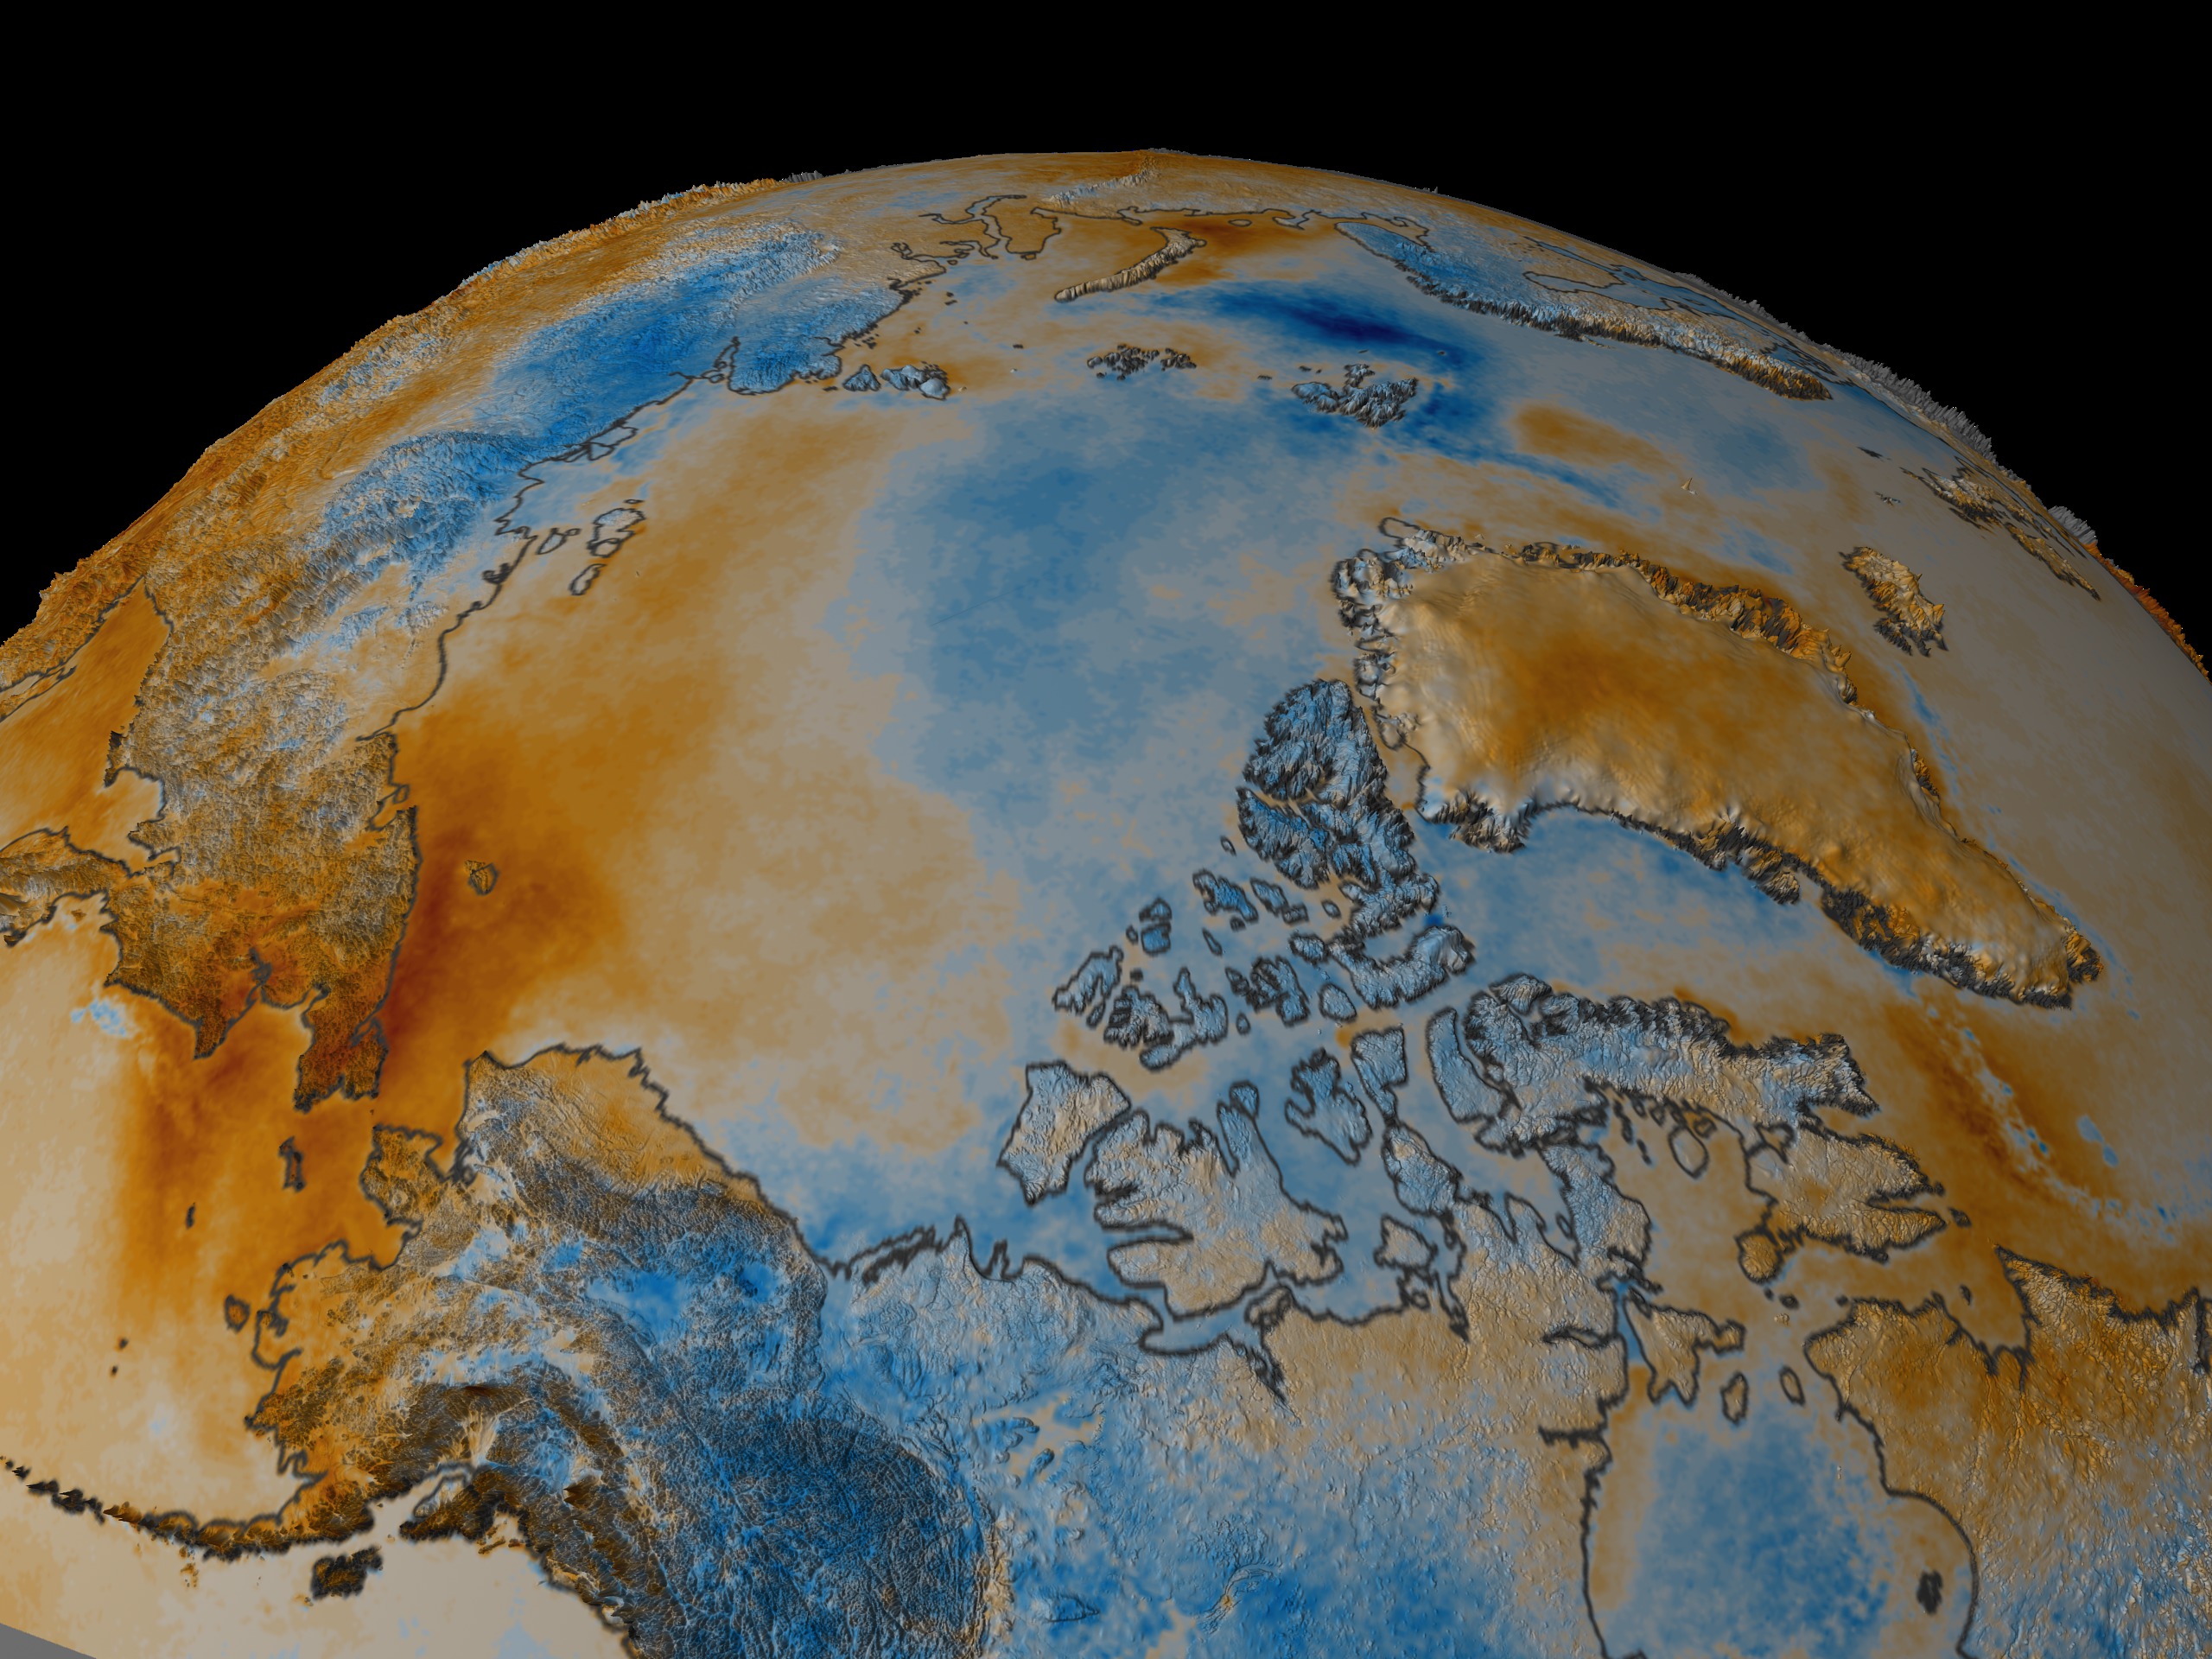
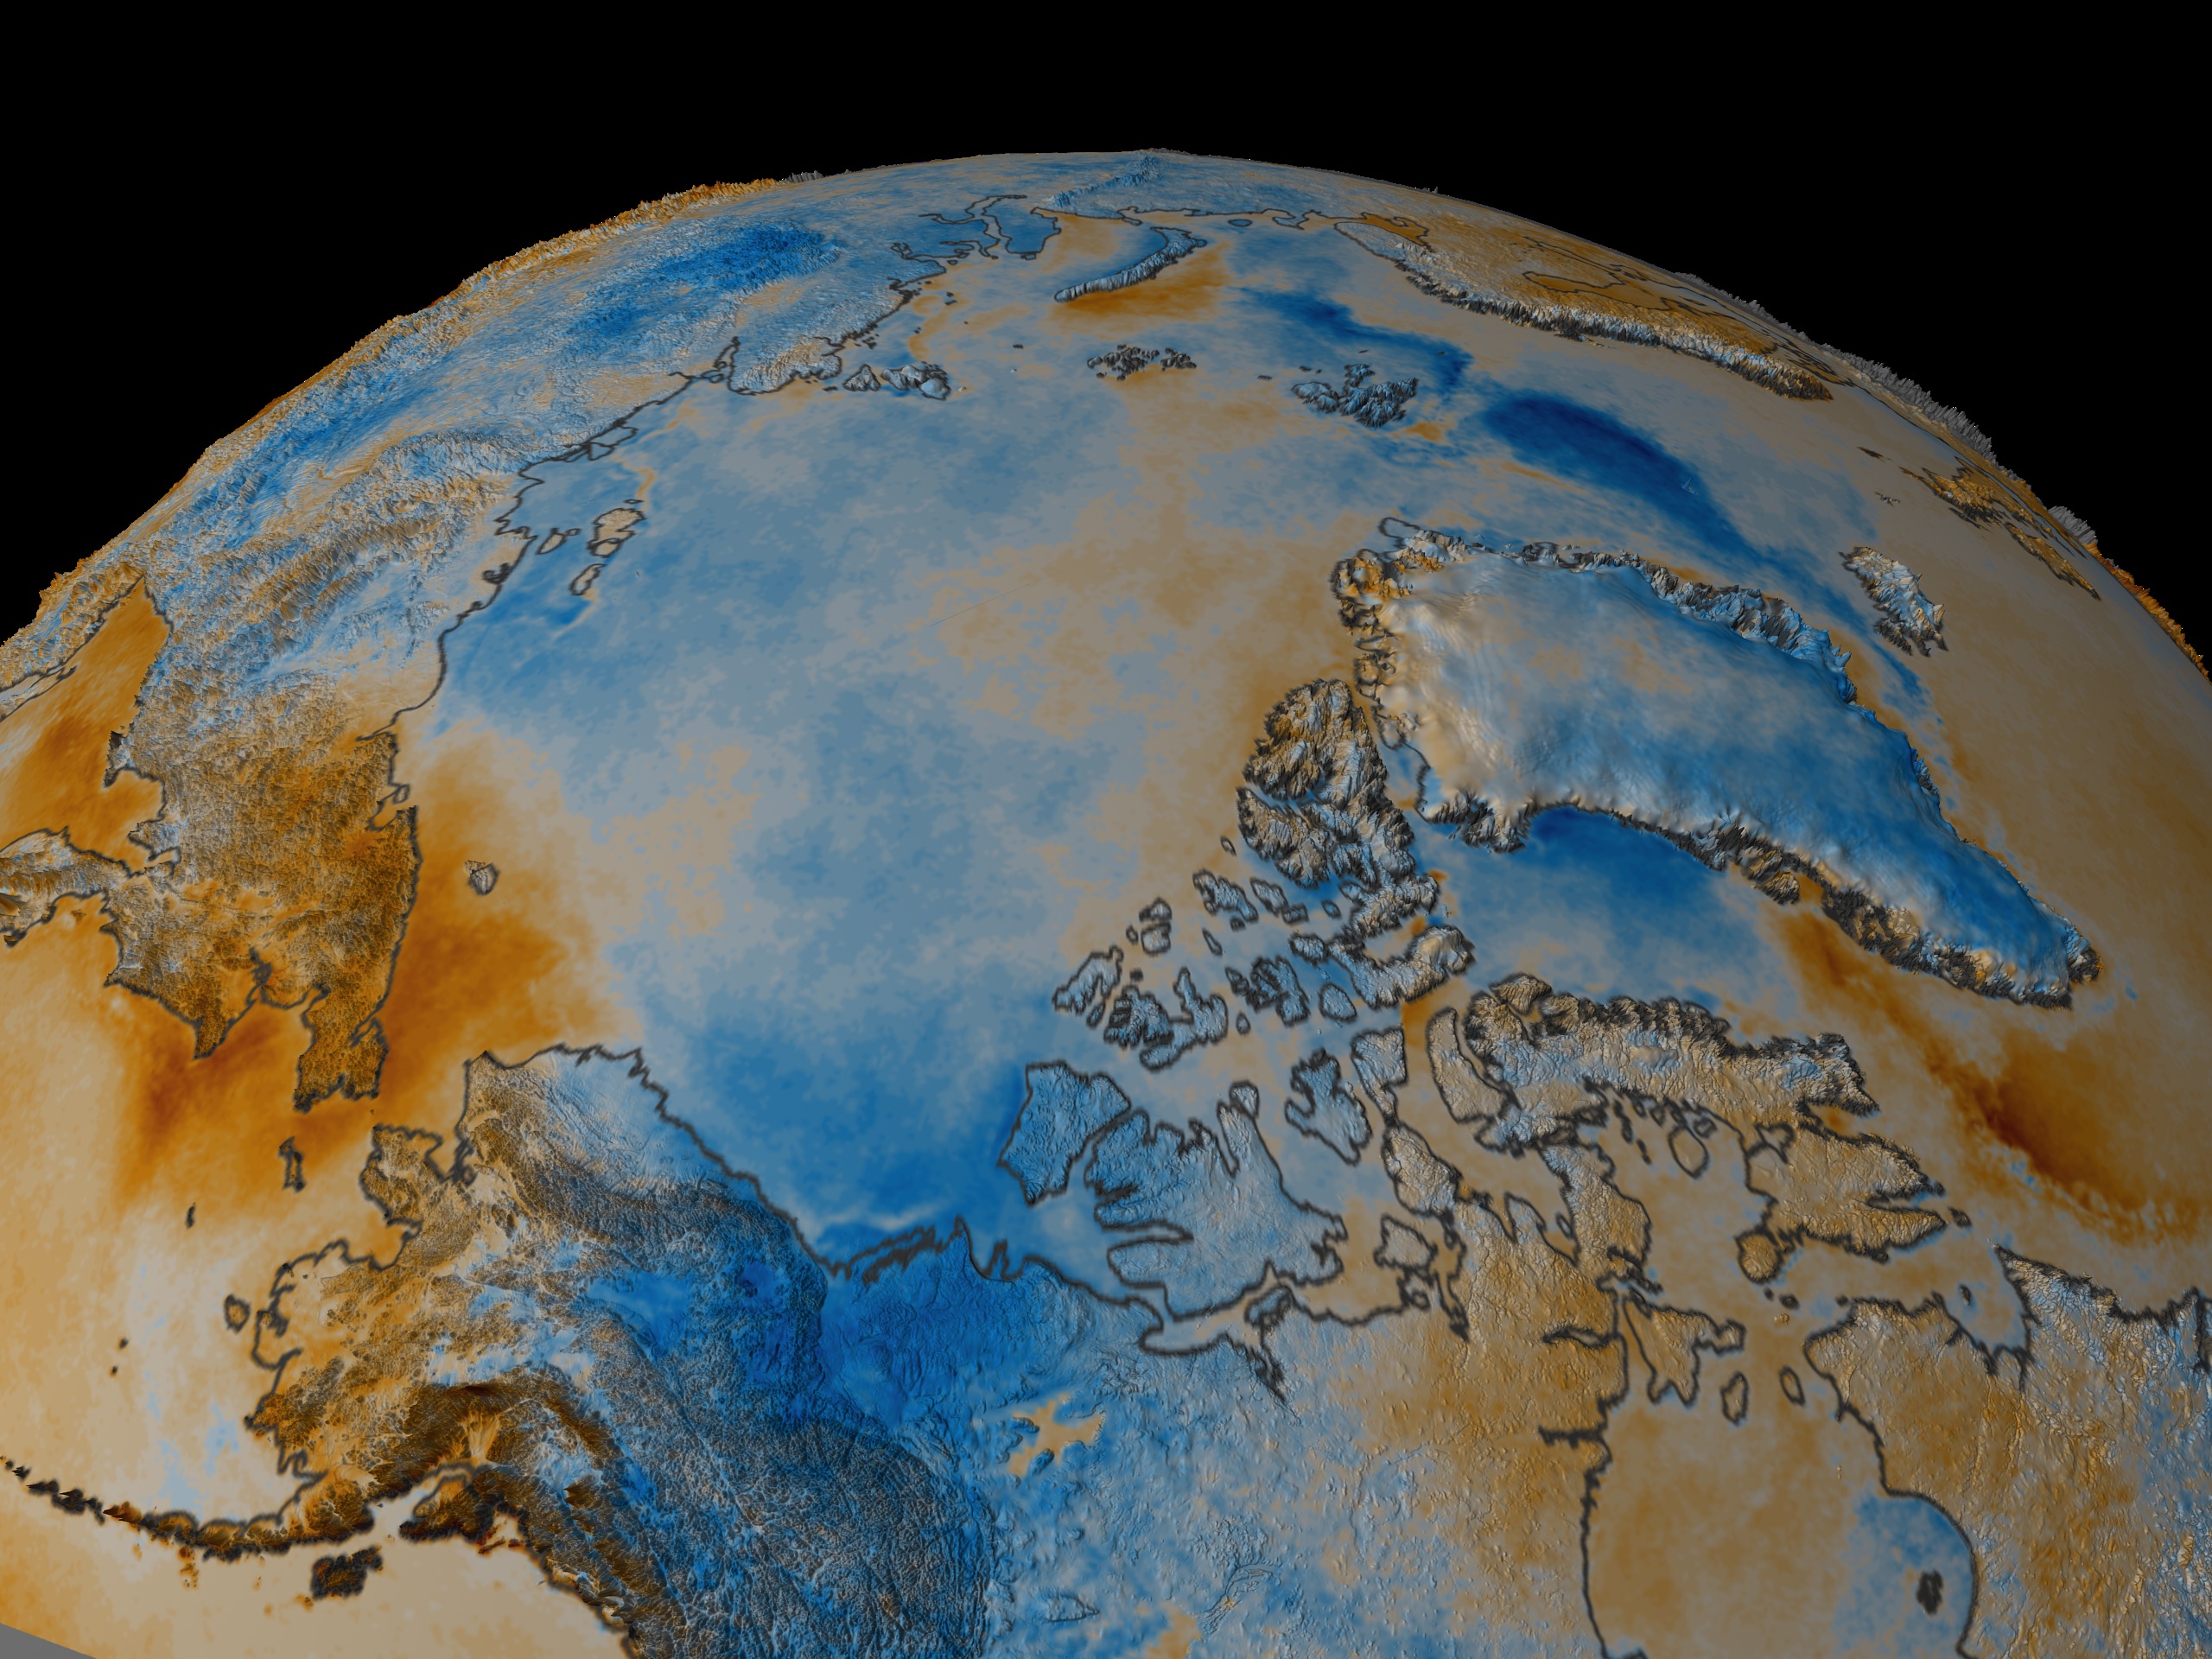
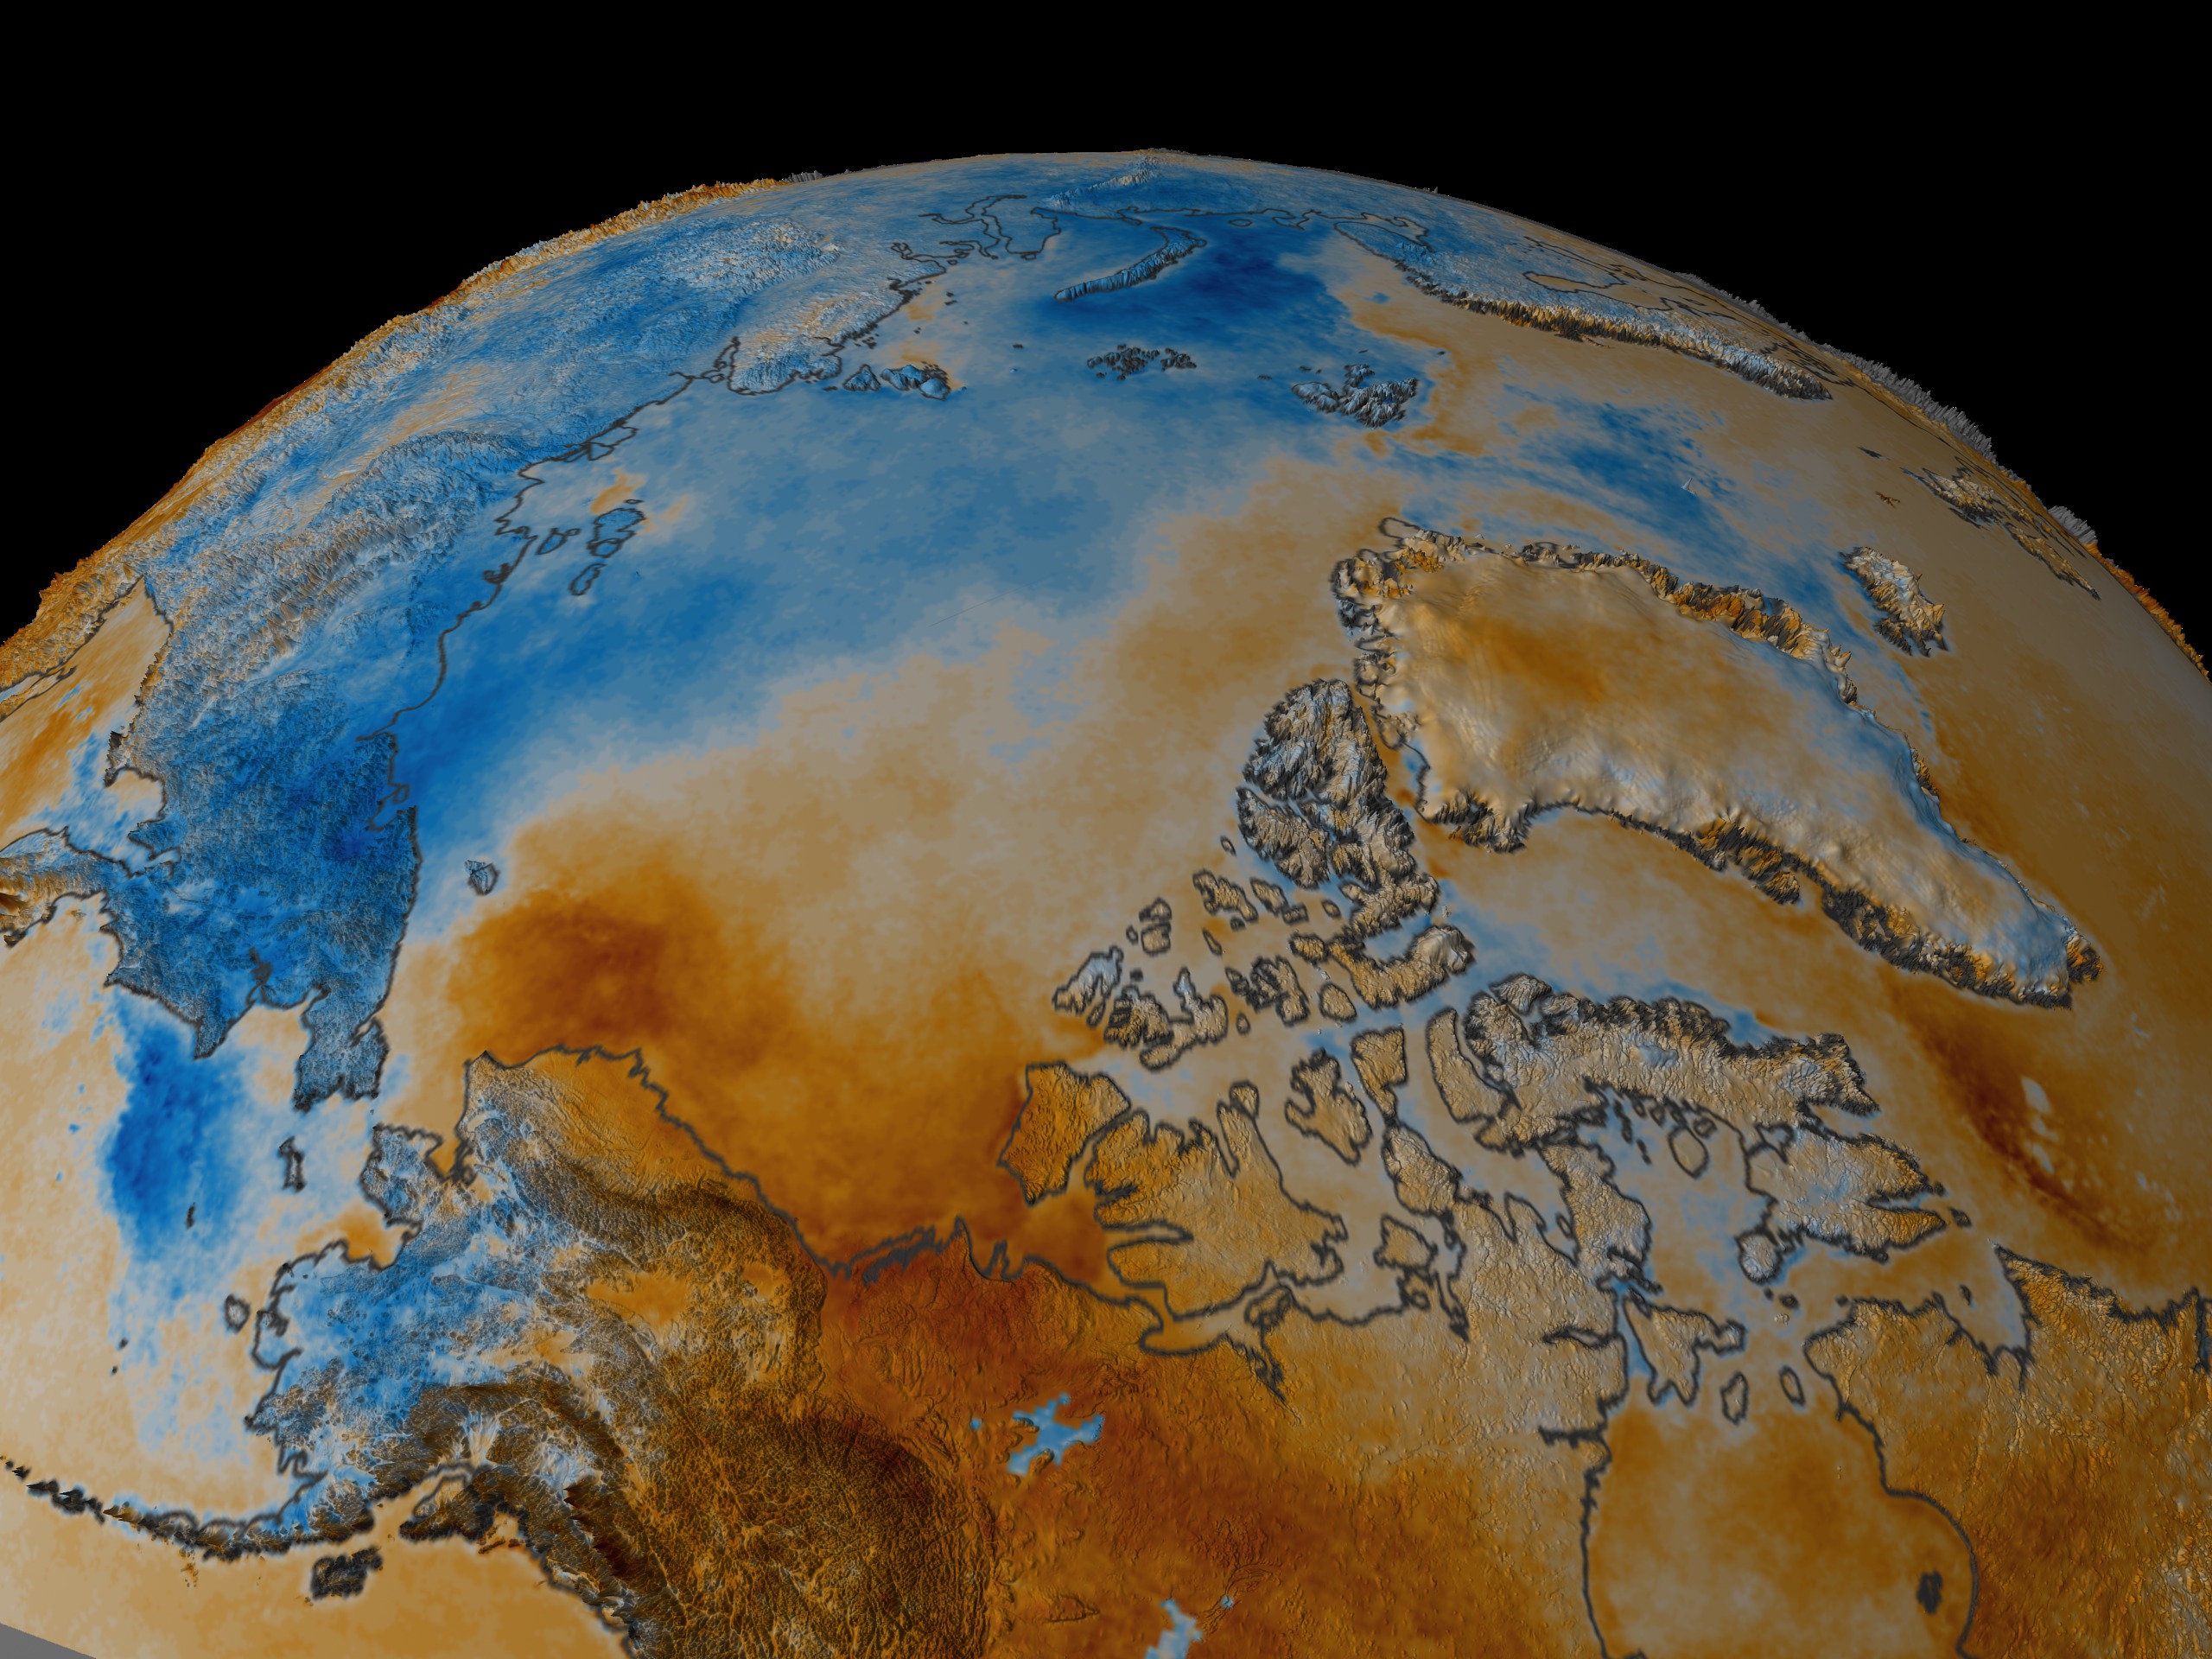
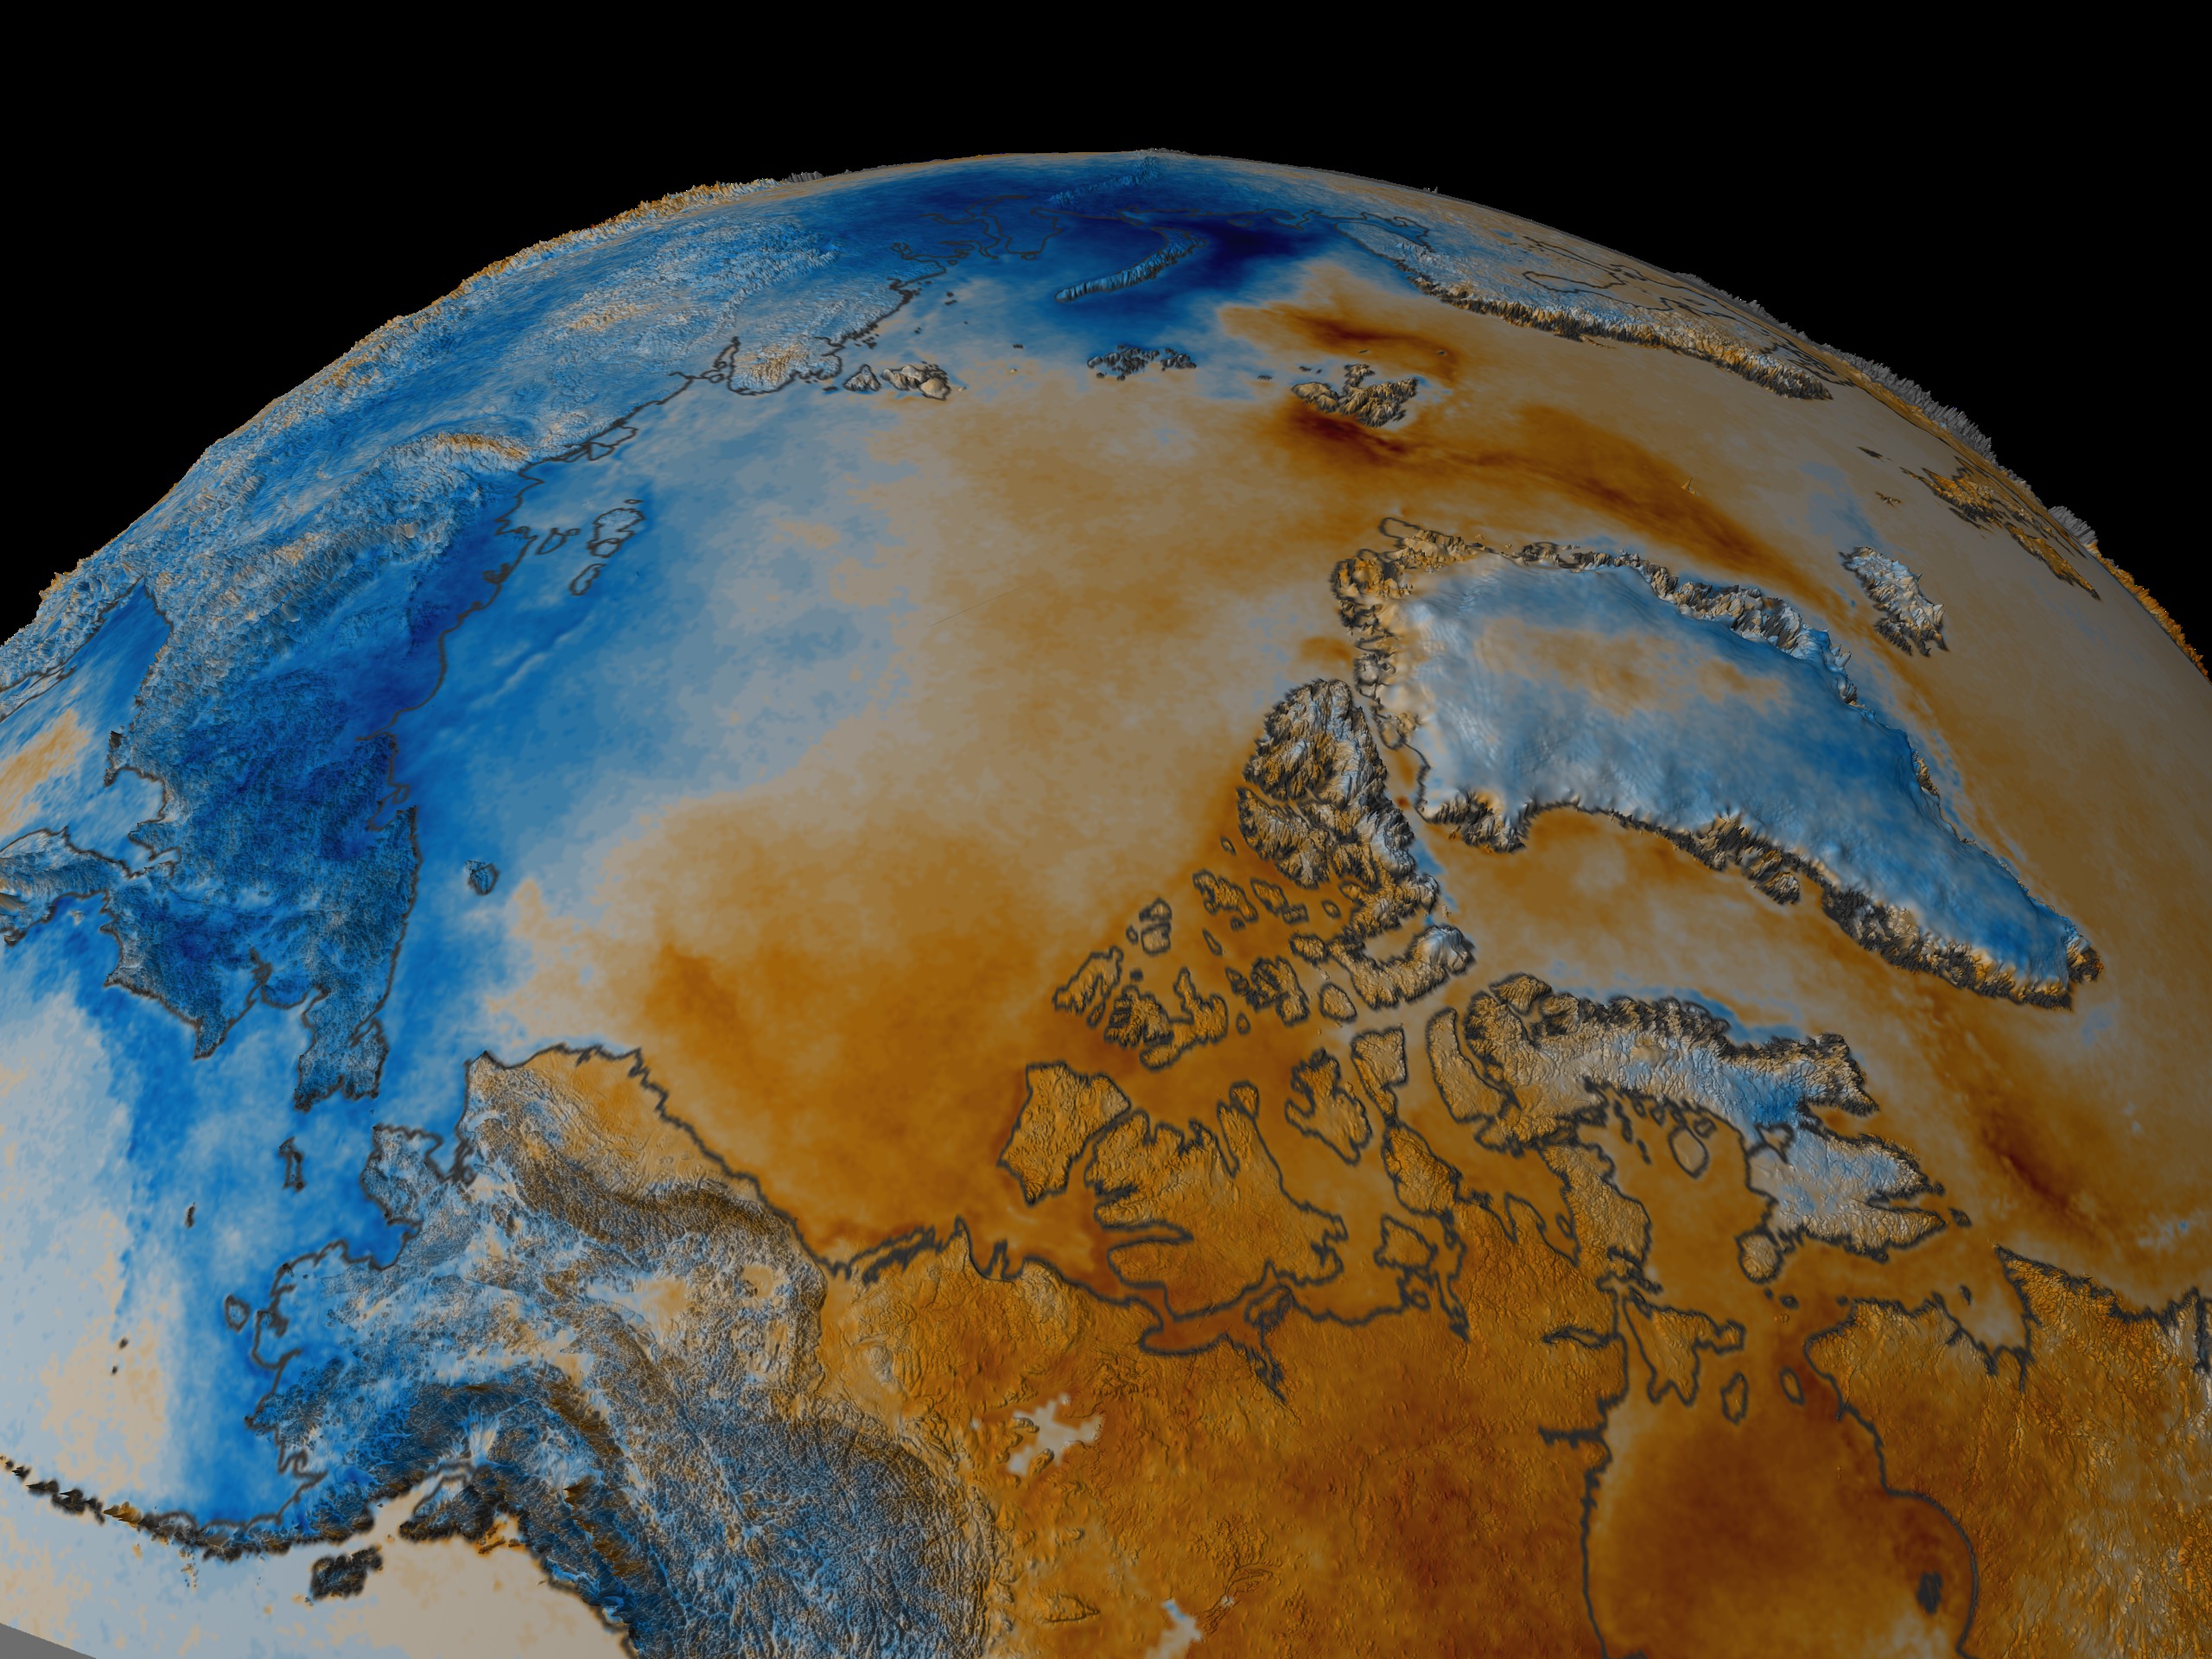
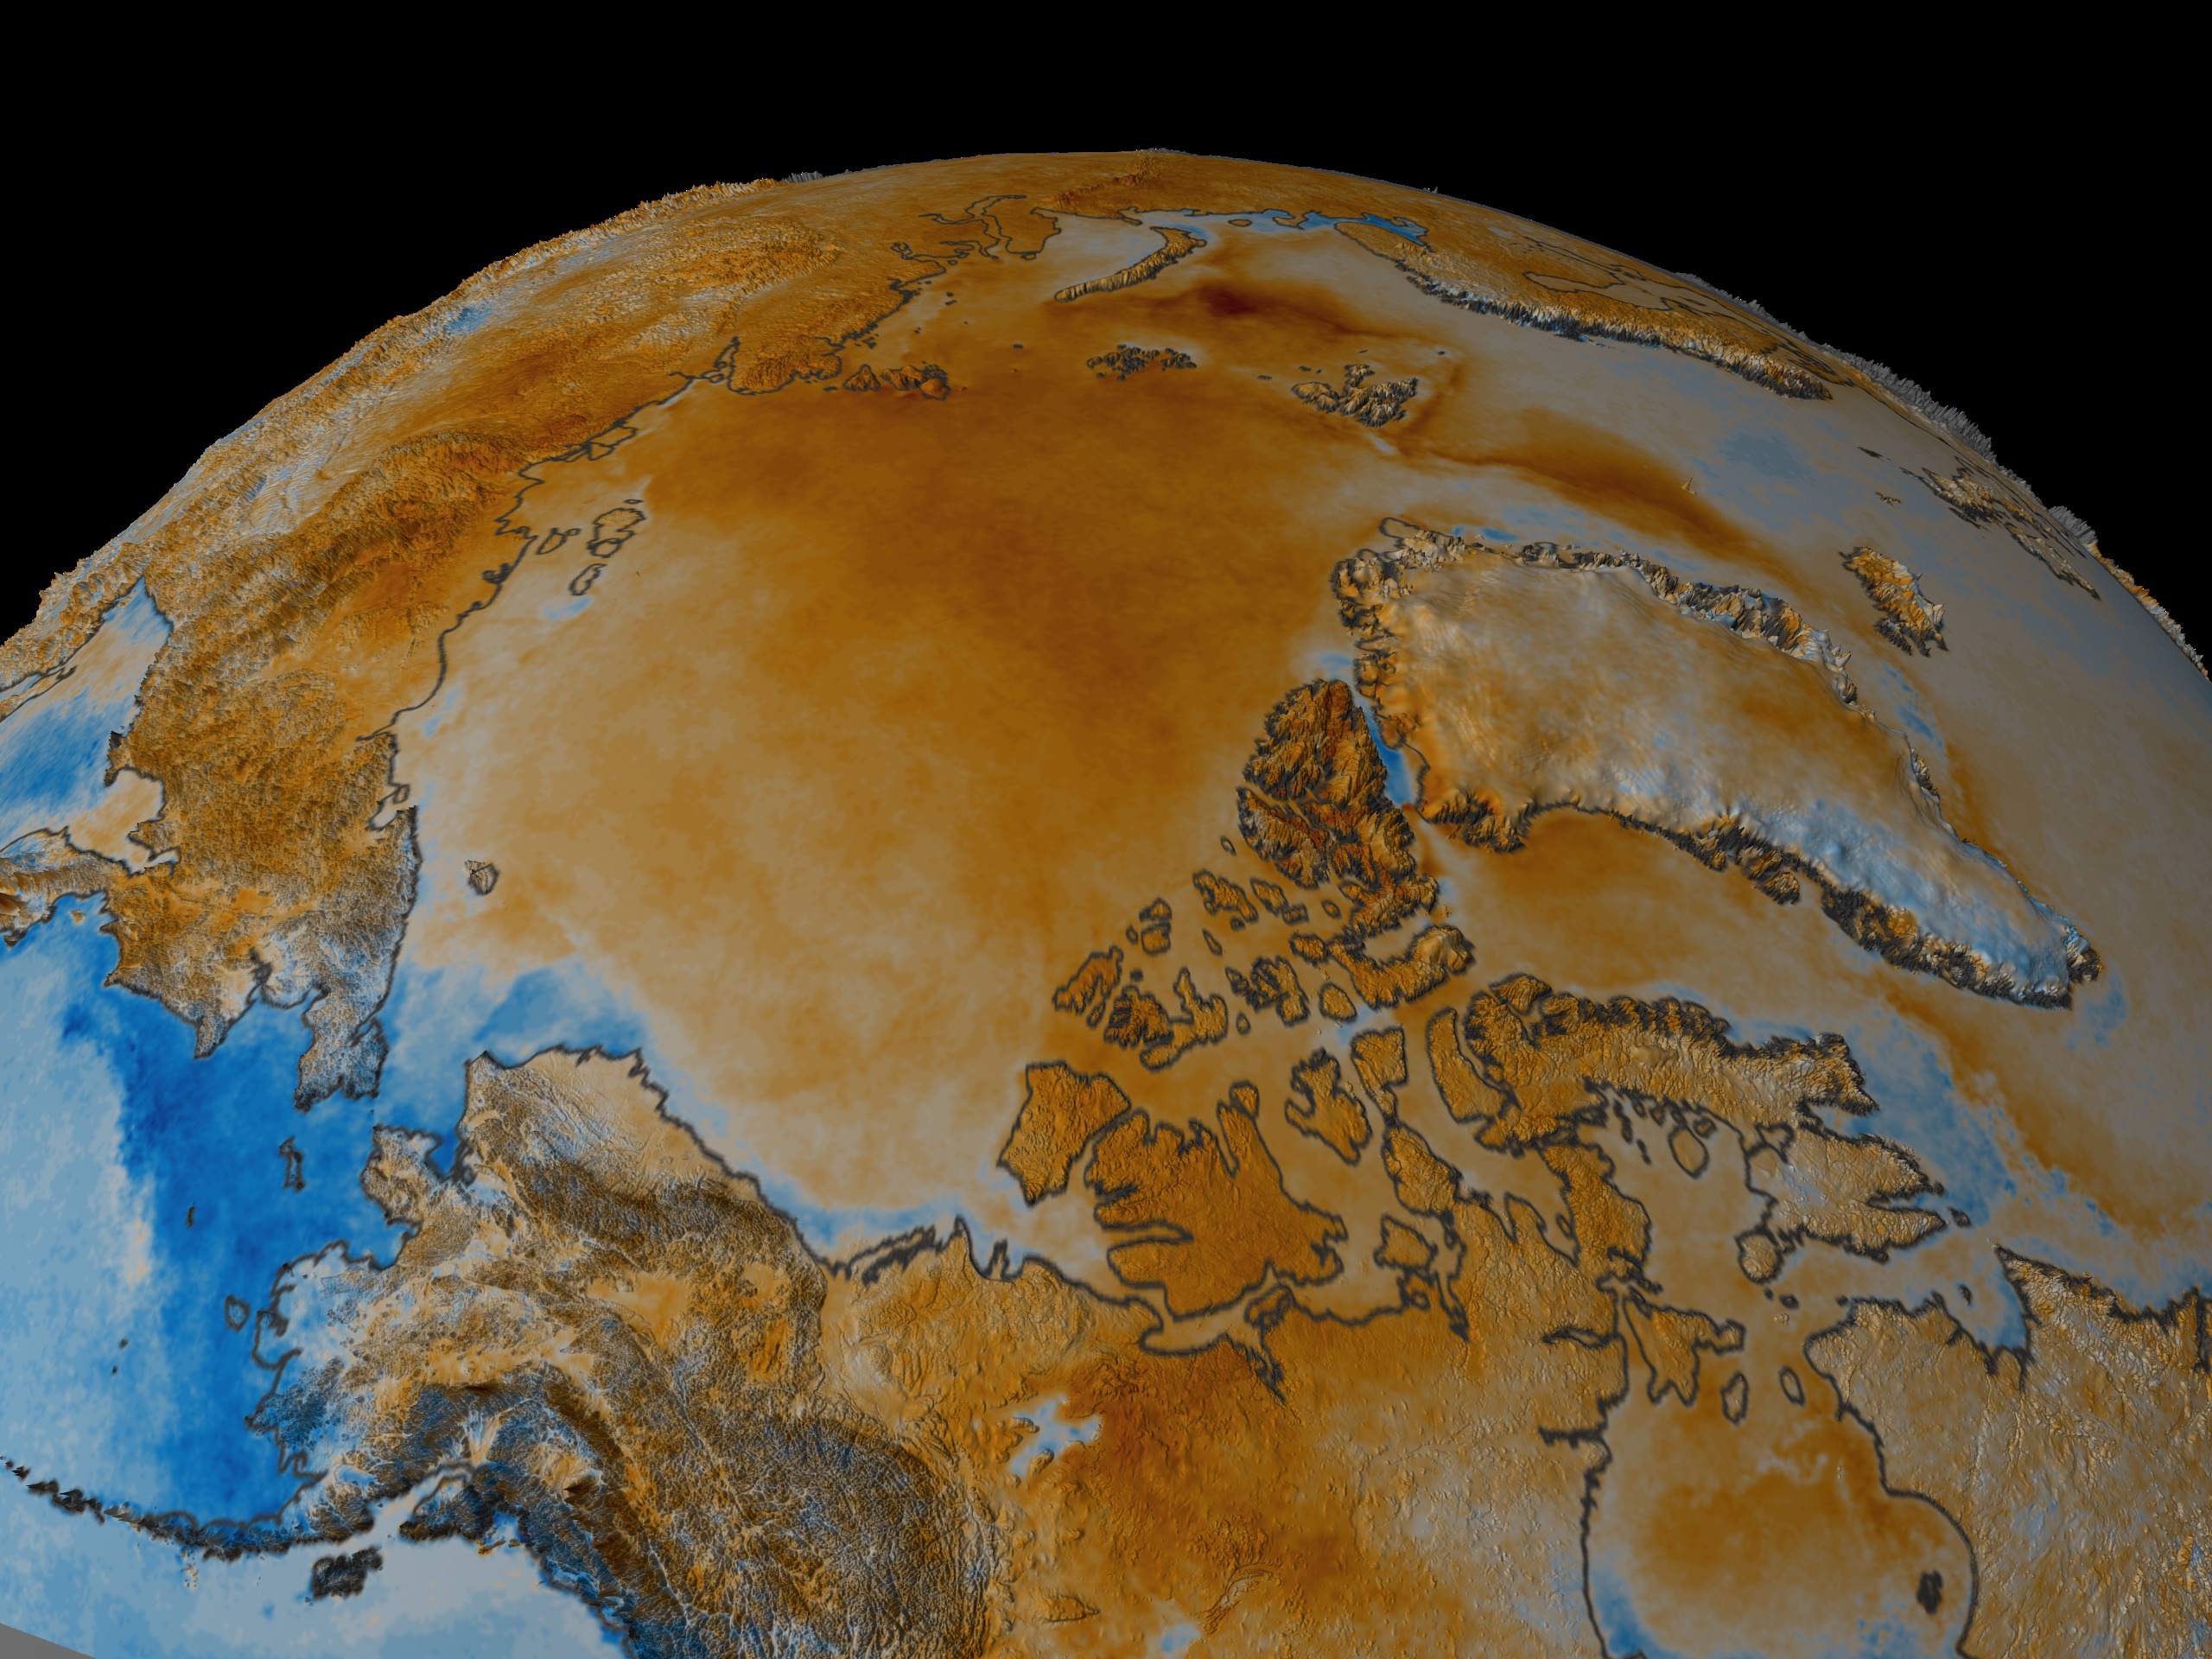
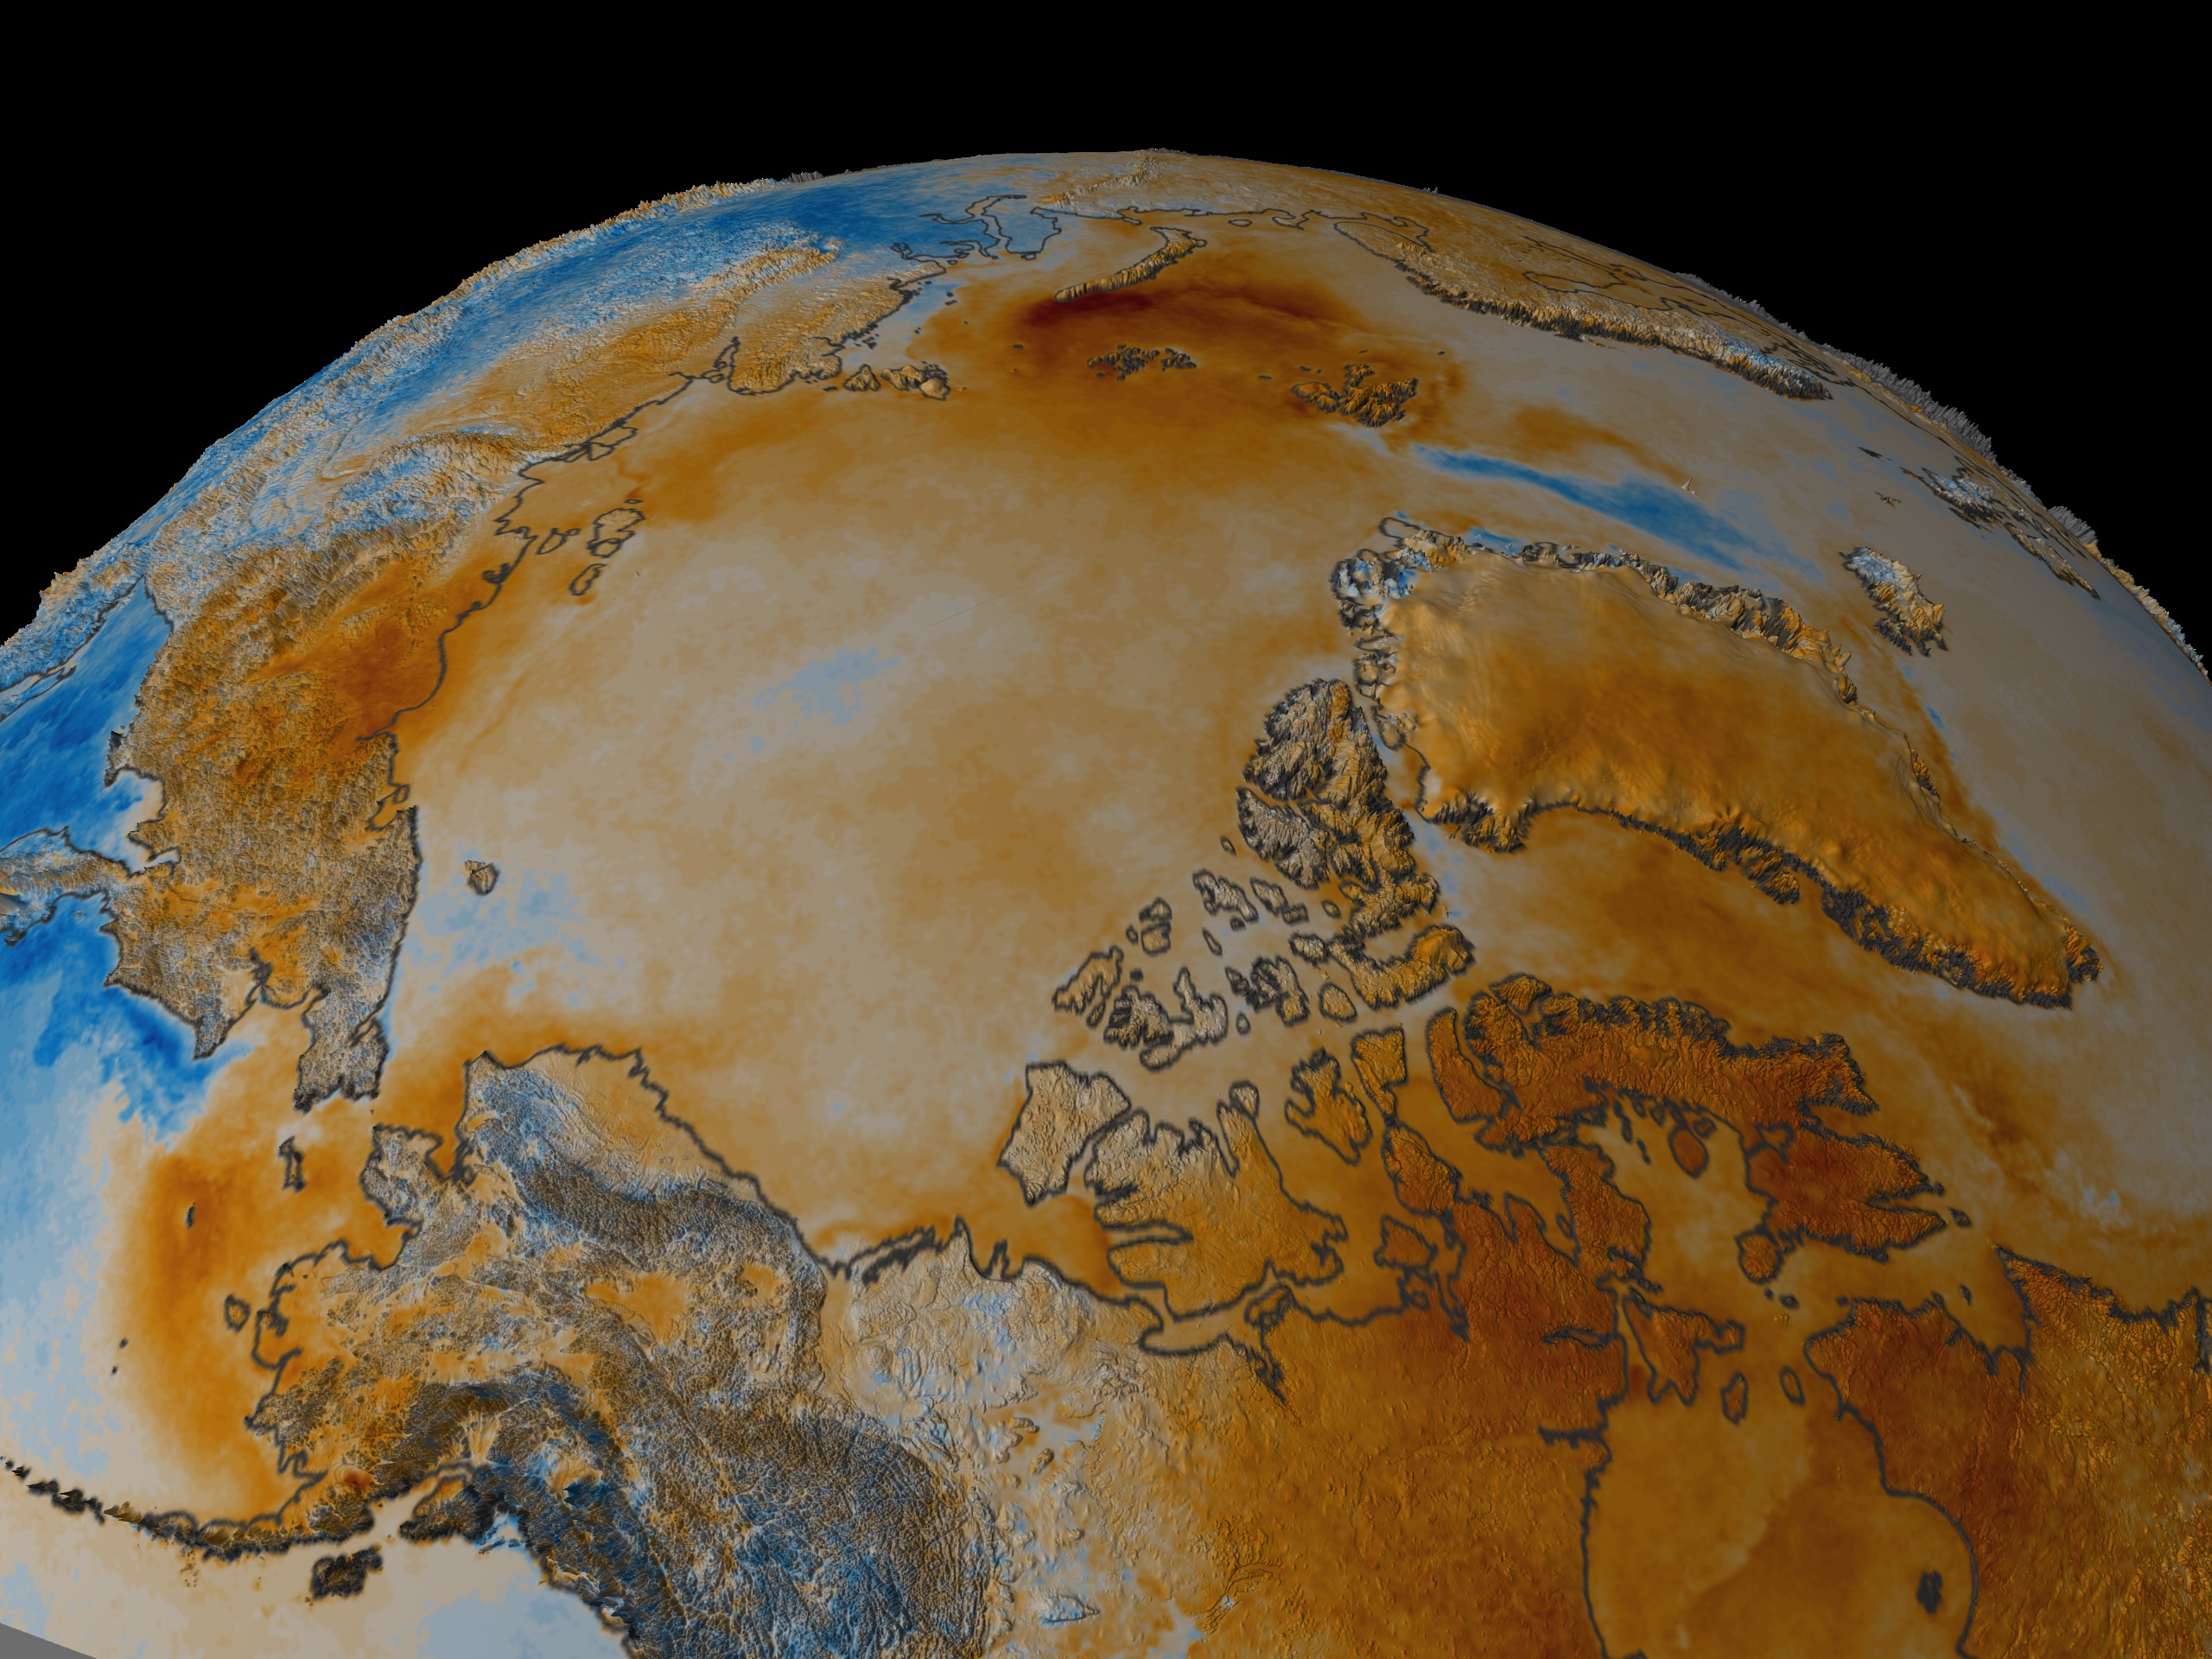
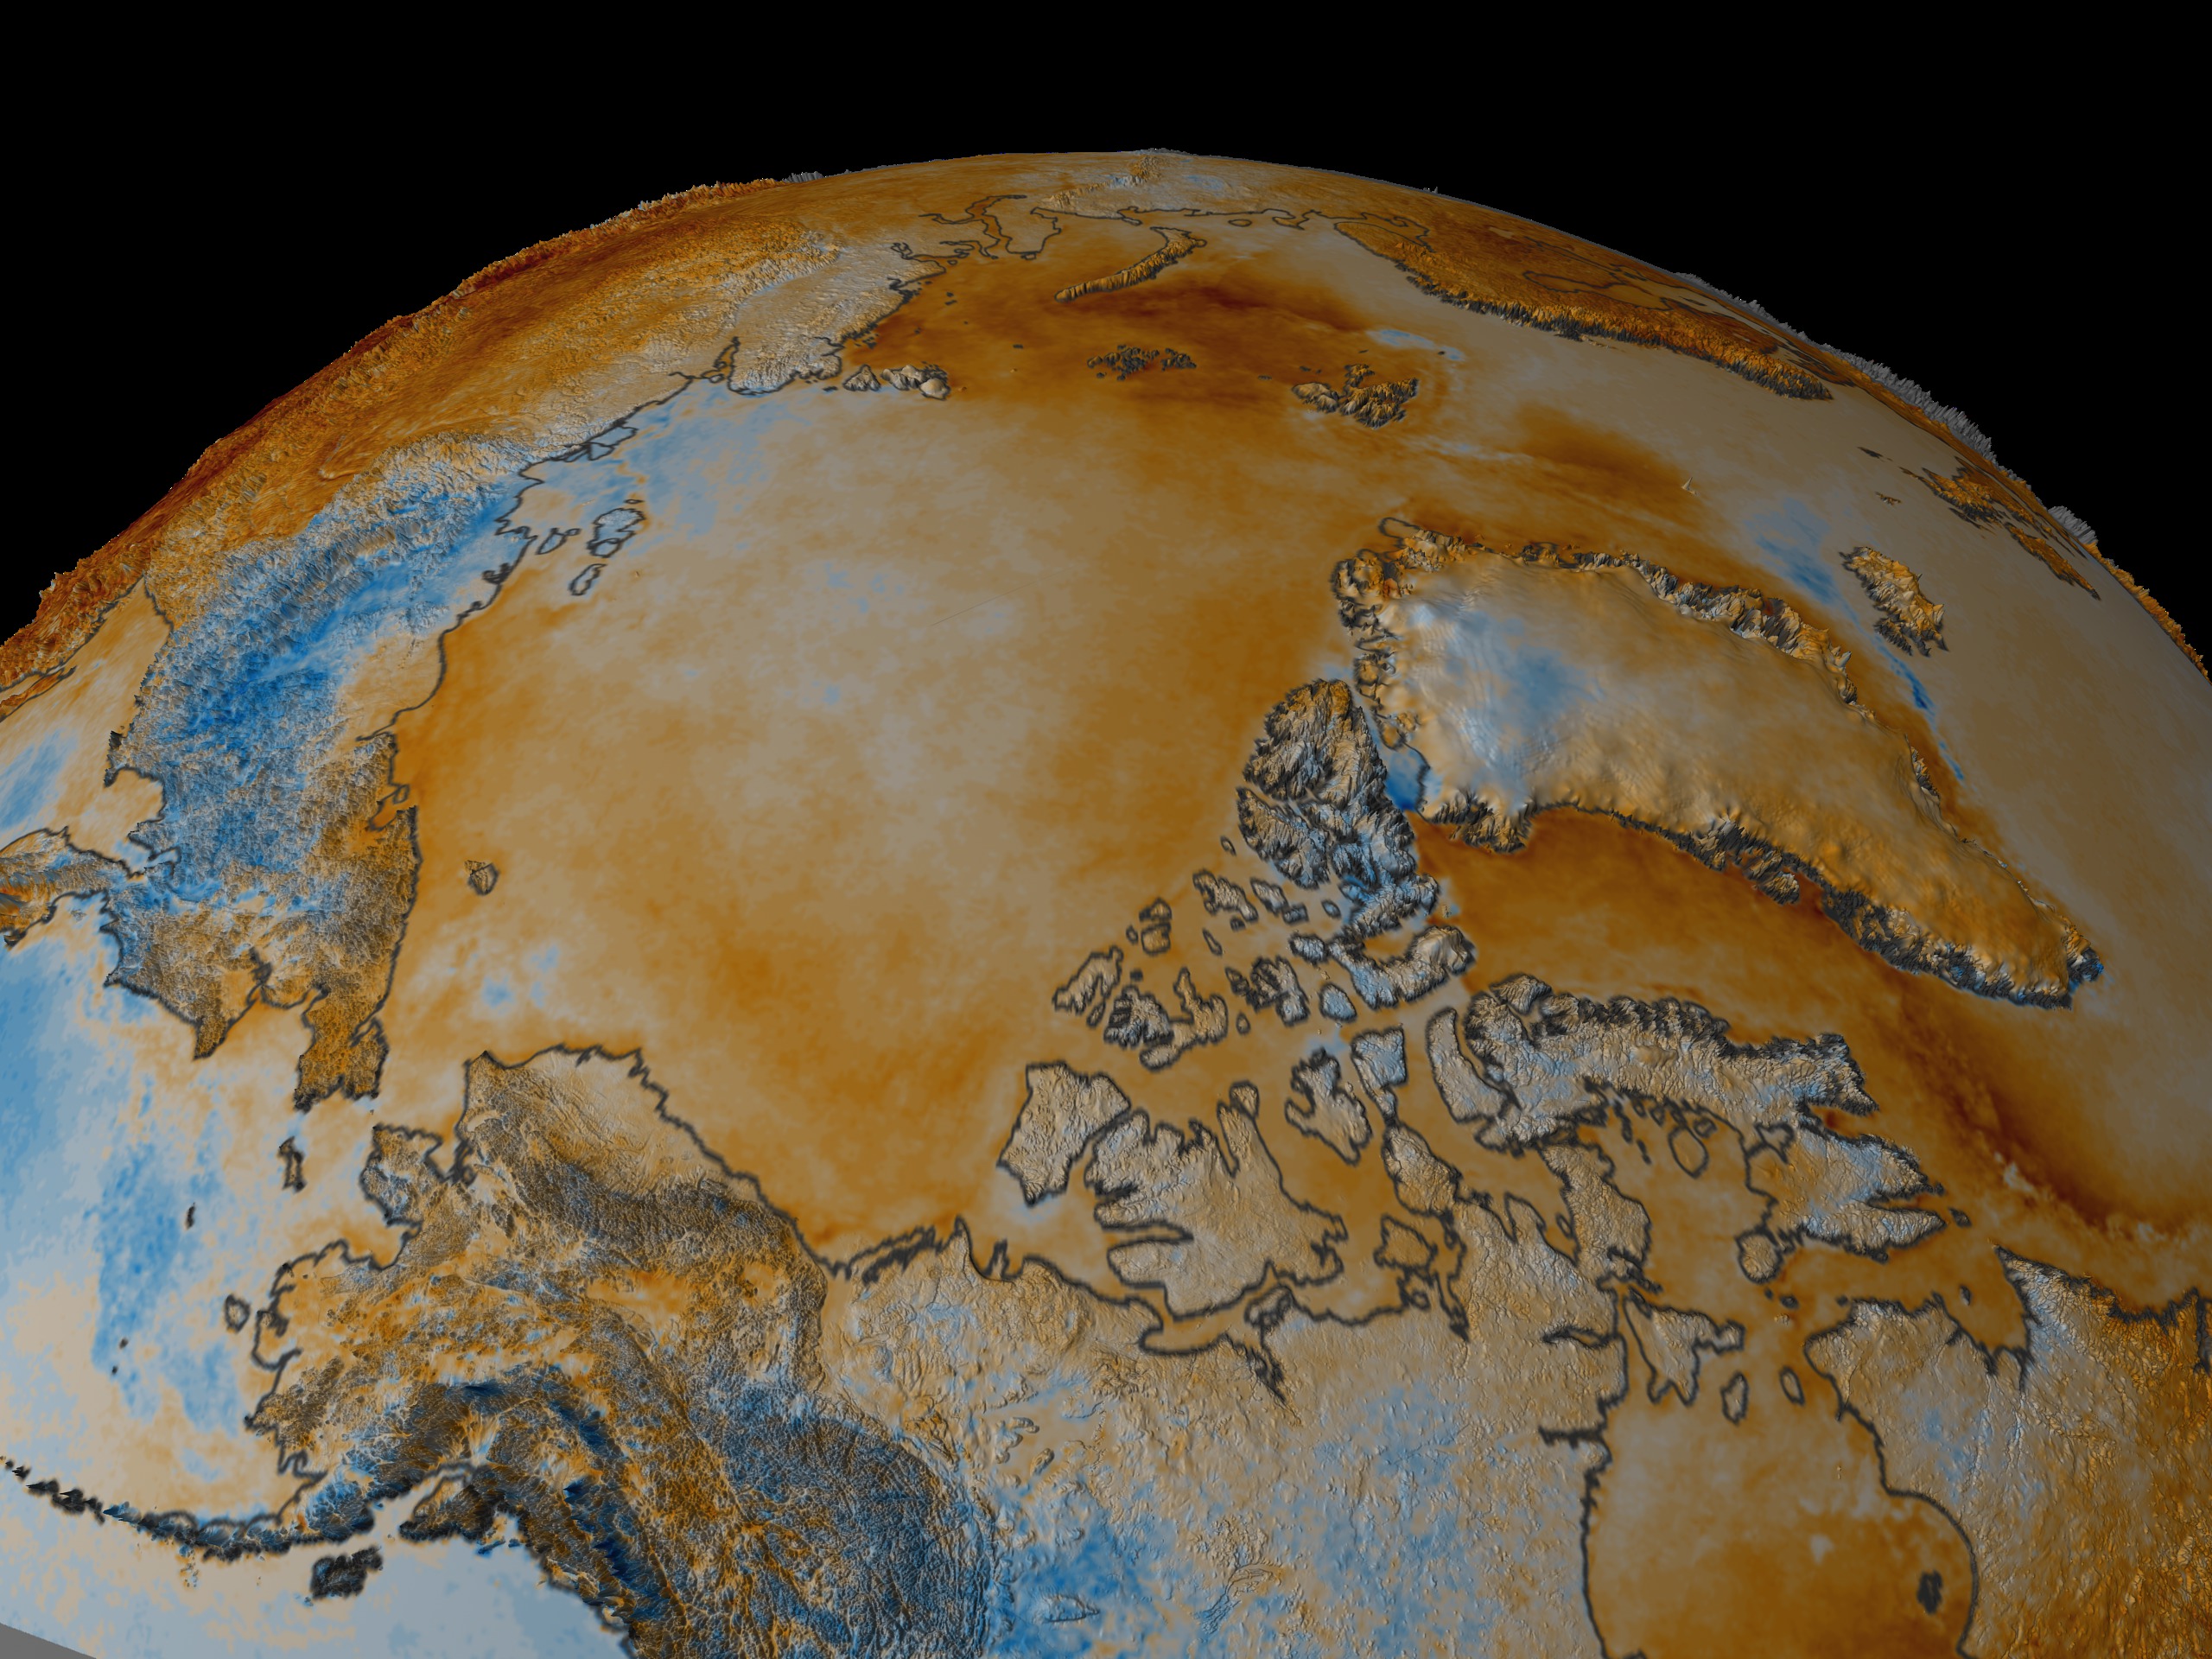
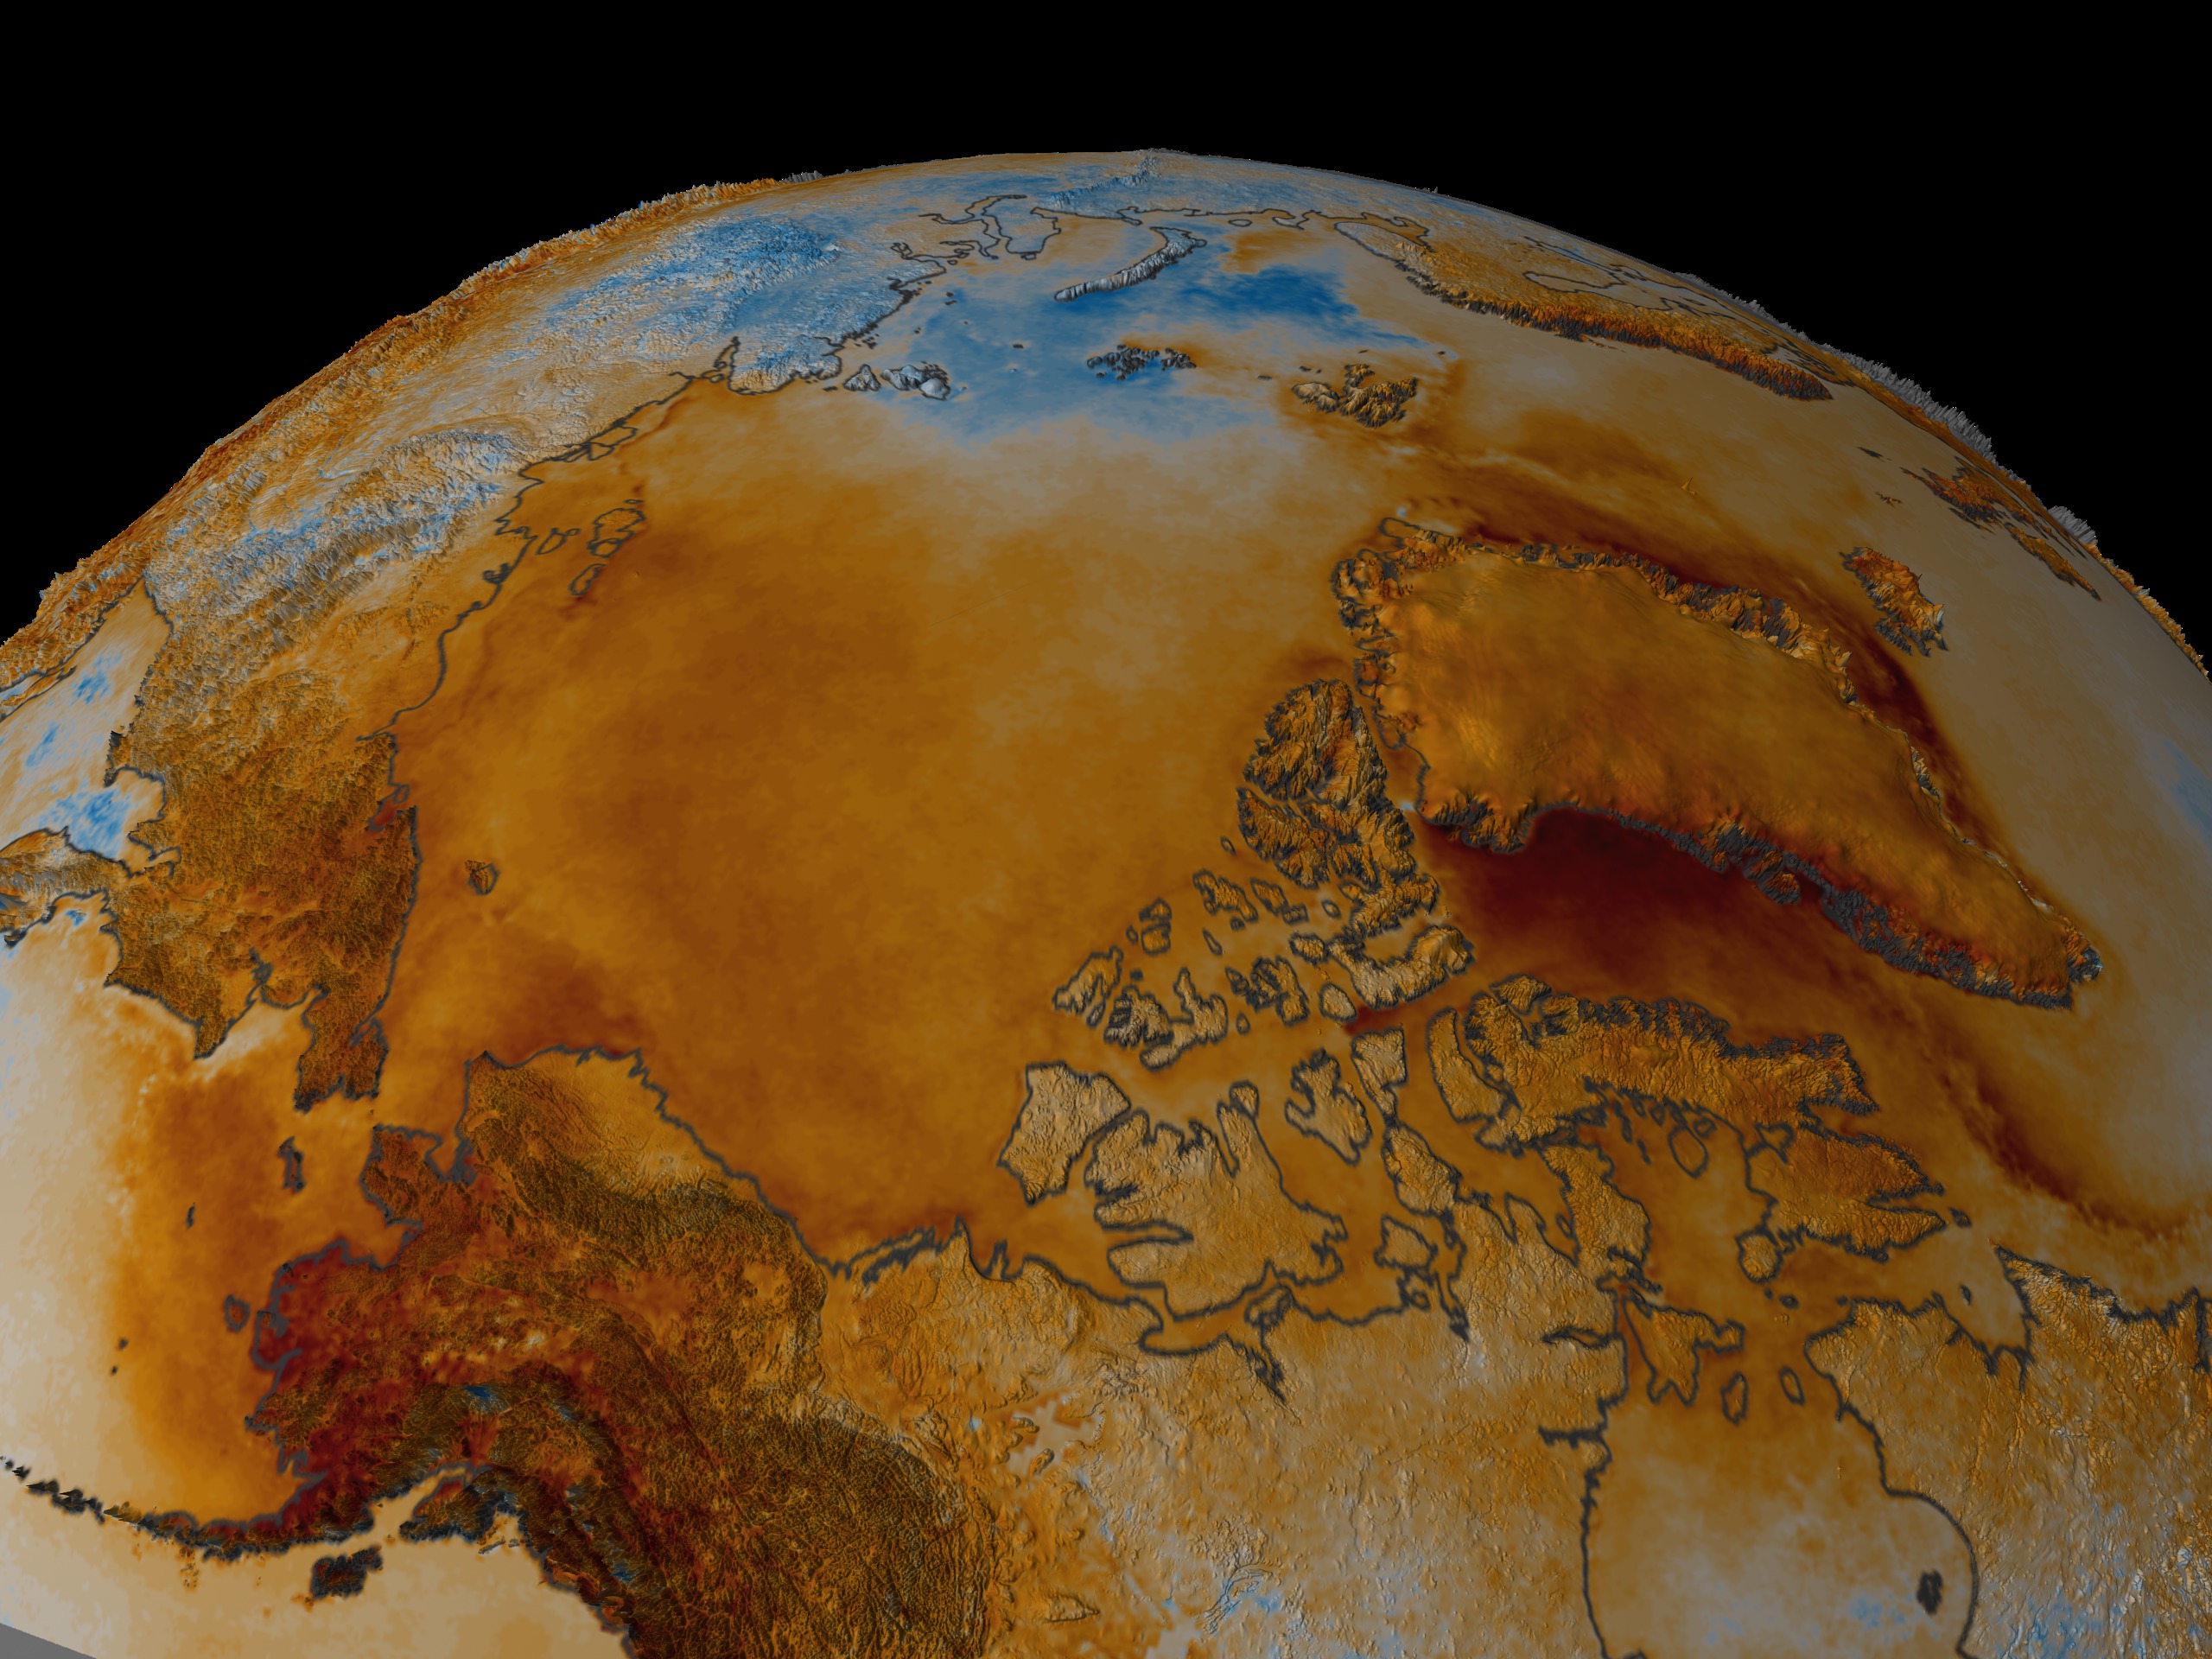

Yearly Arctic Temperature Anomaly
Visualization Credits
Cindy Starr (Global Science and Technology, Inc.): Lead Visualizer
Josefino Comiso (NASA/GSFC): Scientist
Josefino Comiso (NASA/GSFC): Scientist
Please give credit for this item to:
NASA/Goddard Space Flight Center Scientific Visualization Studio. Larry Stock and Robert Gersten also contributed to this project.
NASA/Goddard Space Flight Center Scientific Visualization Studio. Larry Stock and Robert Gersten also contributed to this project.
Science Paper:
A rapidly declining perennial sea ice cover in the Arctic, Geophysical Research Letters, Vol. 29, No. 20, October 2002.
Short URL to share this page:
https://svs.gsfc.nasa.gov/2830
Data Used:
Note: While we identify the data sets used in these visualizations, we do not store any further details nor the data sets themselves on our site.
This item is part of this series:
Cyclones
Keywords:
SVS >> North Pole
SVS >> Surface Temperature Anomaly
GCMD >> Location >> Arctic
NASA Science >> Earth
GCMD keywords can be found on the Internet with the following citation: Olsen, L.M., G. Major, K. Shein, J. Scialdone, S. Ritz, T. Stevens, M. Morahan, A. Aleman, R. Vogel, S. Leicester, H. Weir, M. Meaux, S. Grebas, C.Solomon, M. Holland, T. Northcutt, R. A. Restrepo, R. Bilodeau, 2013. NASA/Global Change Master Directory (GCMD) Earth Science Keywords. Version 8.0.0.0.0
A rapidly declining perennial sea ice cover in the Arctic, Geophysical Research Letters, Vol. 29, No. 20, October 2002.
Short URL to share this page:
https://svs.gsfc.nasa.gov/2830
Data Used:
NOAA-7, 9, 11, 14, 16/AVHRR/Yearly Anomalies in Arctic Surface Temperature
1981/08/01 - 2003/07/31This item is part of this series:
Cyclones
Keywords:
SVS >> North Pole
SVS >> Surface Temperature Anomaly
GCMD >> Location >> Arctic
NASA Science >> Earth
GCMD keywords can be found on the Internet with the following citation: Olsen, L.M., G. Major, K. Shein, J. Scialdone, S. Ritz, T. Stevens, M. Morahan, A. Aleman, R. Vogel, S. Leicester, H. Weir, M. Meaux, S. Grebas, C.Solomon, M. Holland, T. Northcutt, R. A. Restrepo, R. Bilodeau, 2013. NASA/Global Change Master Directory (GCMD) Earth Science Keywords. Version 8.0.0.0.0


