Earth
ID: 2816
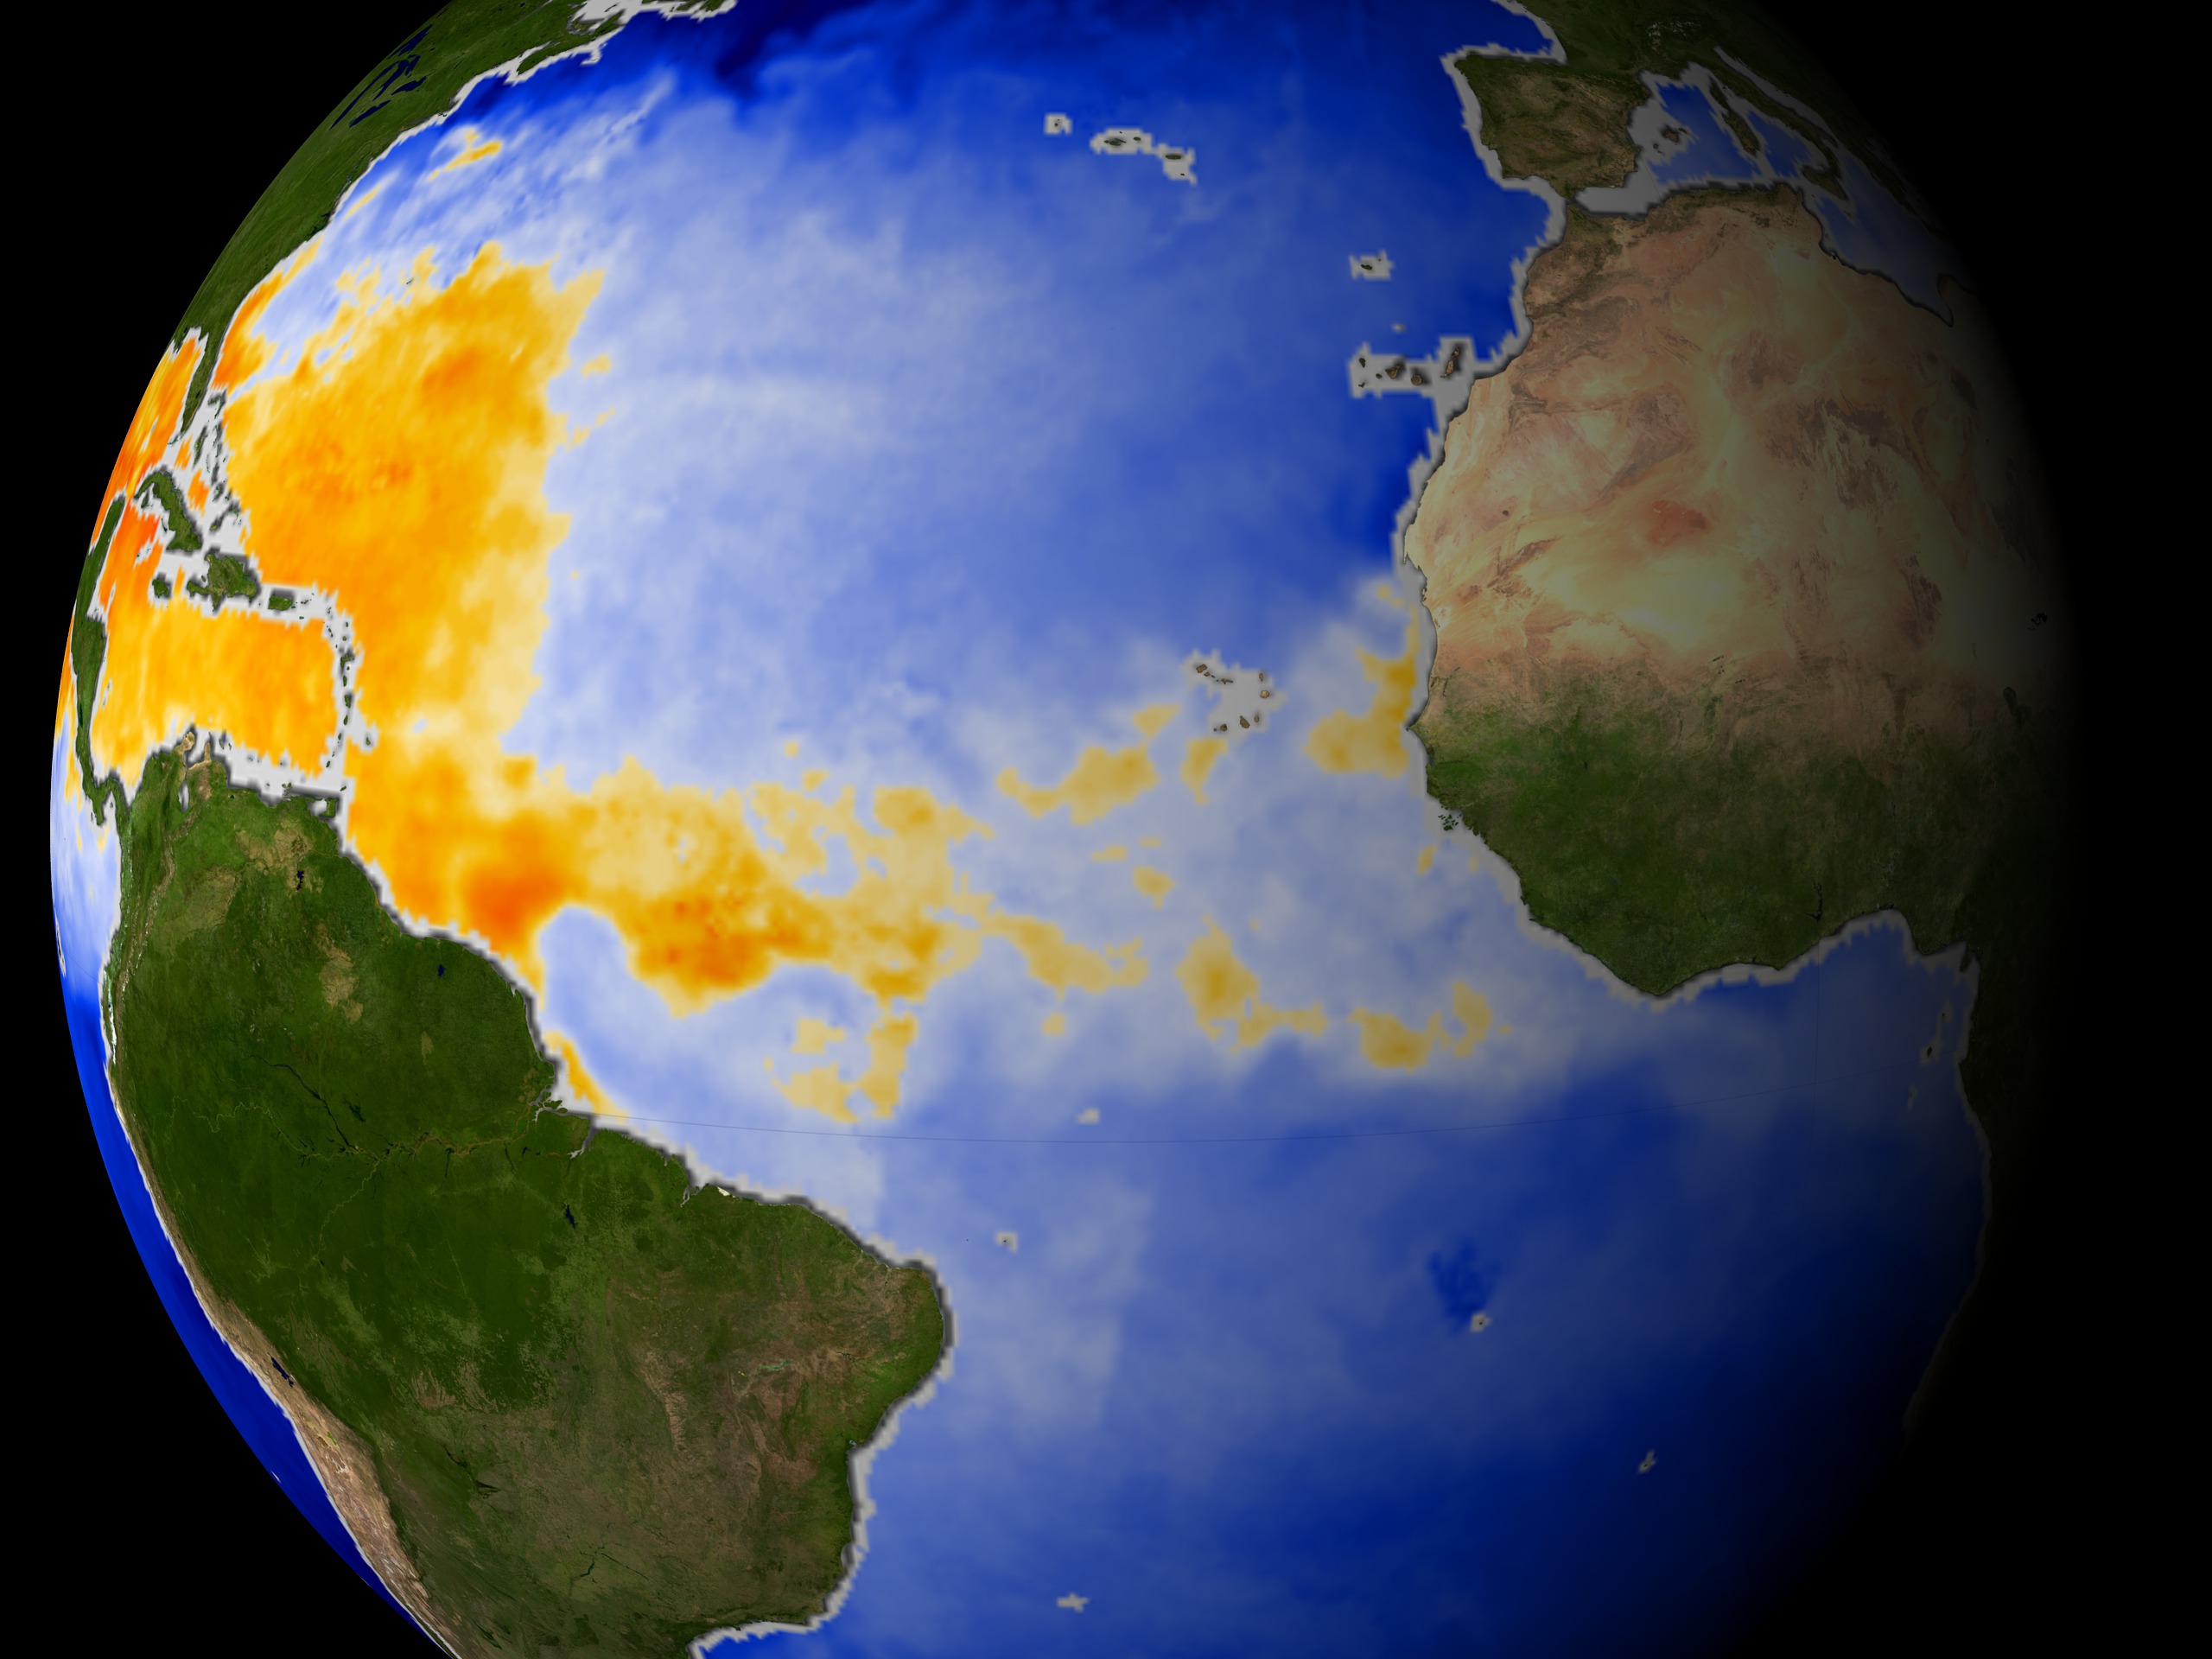
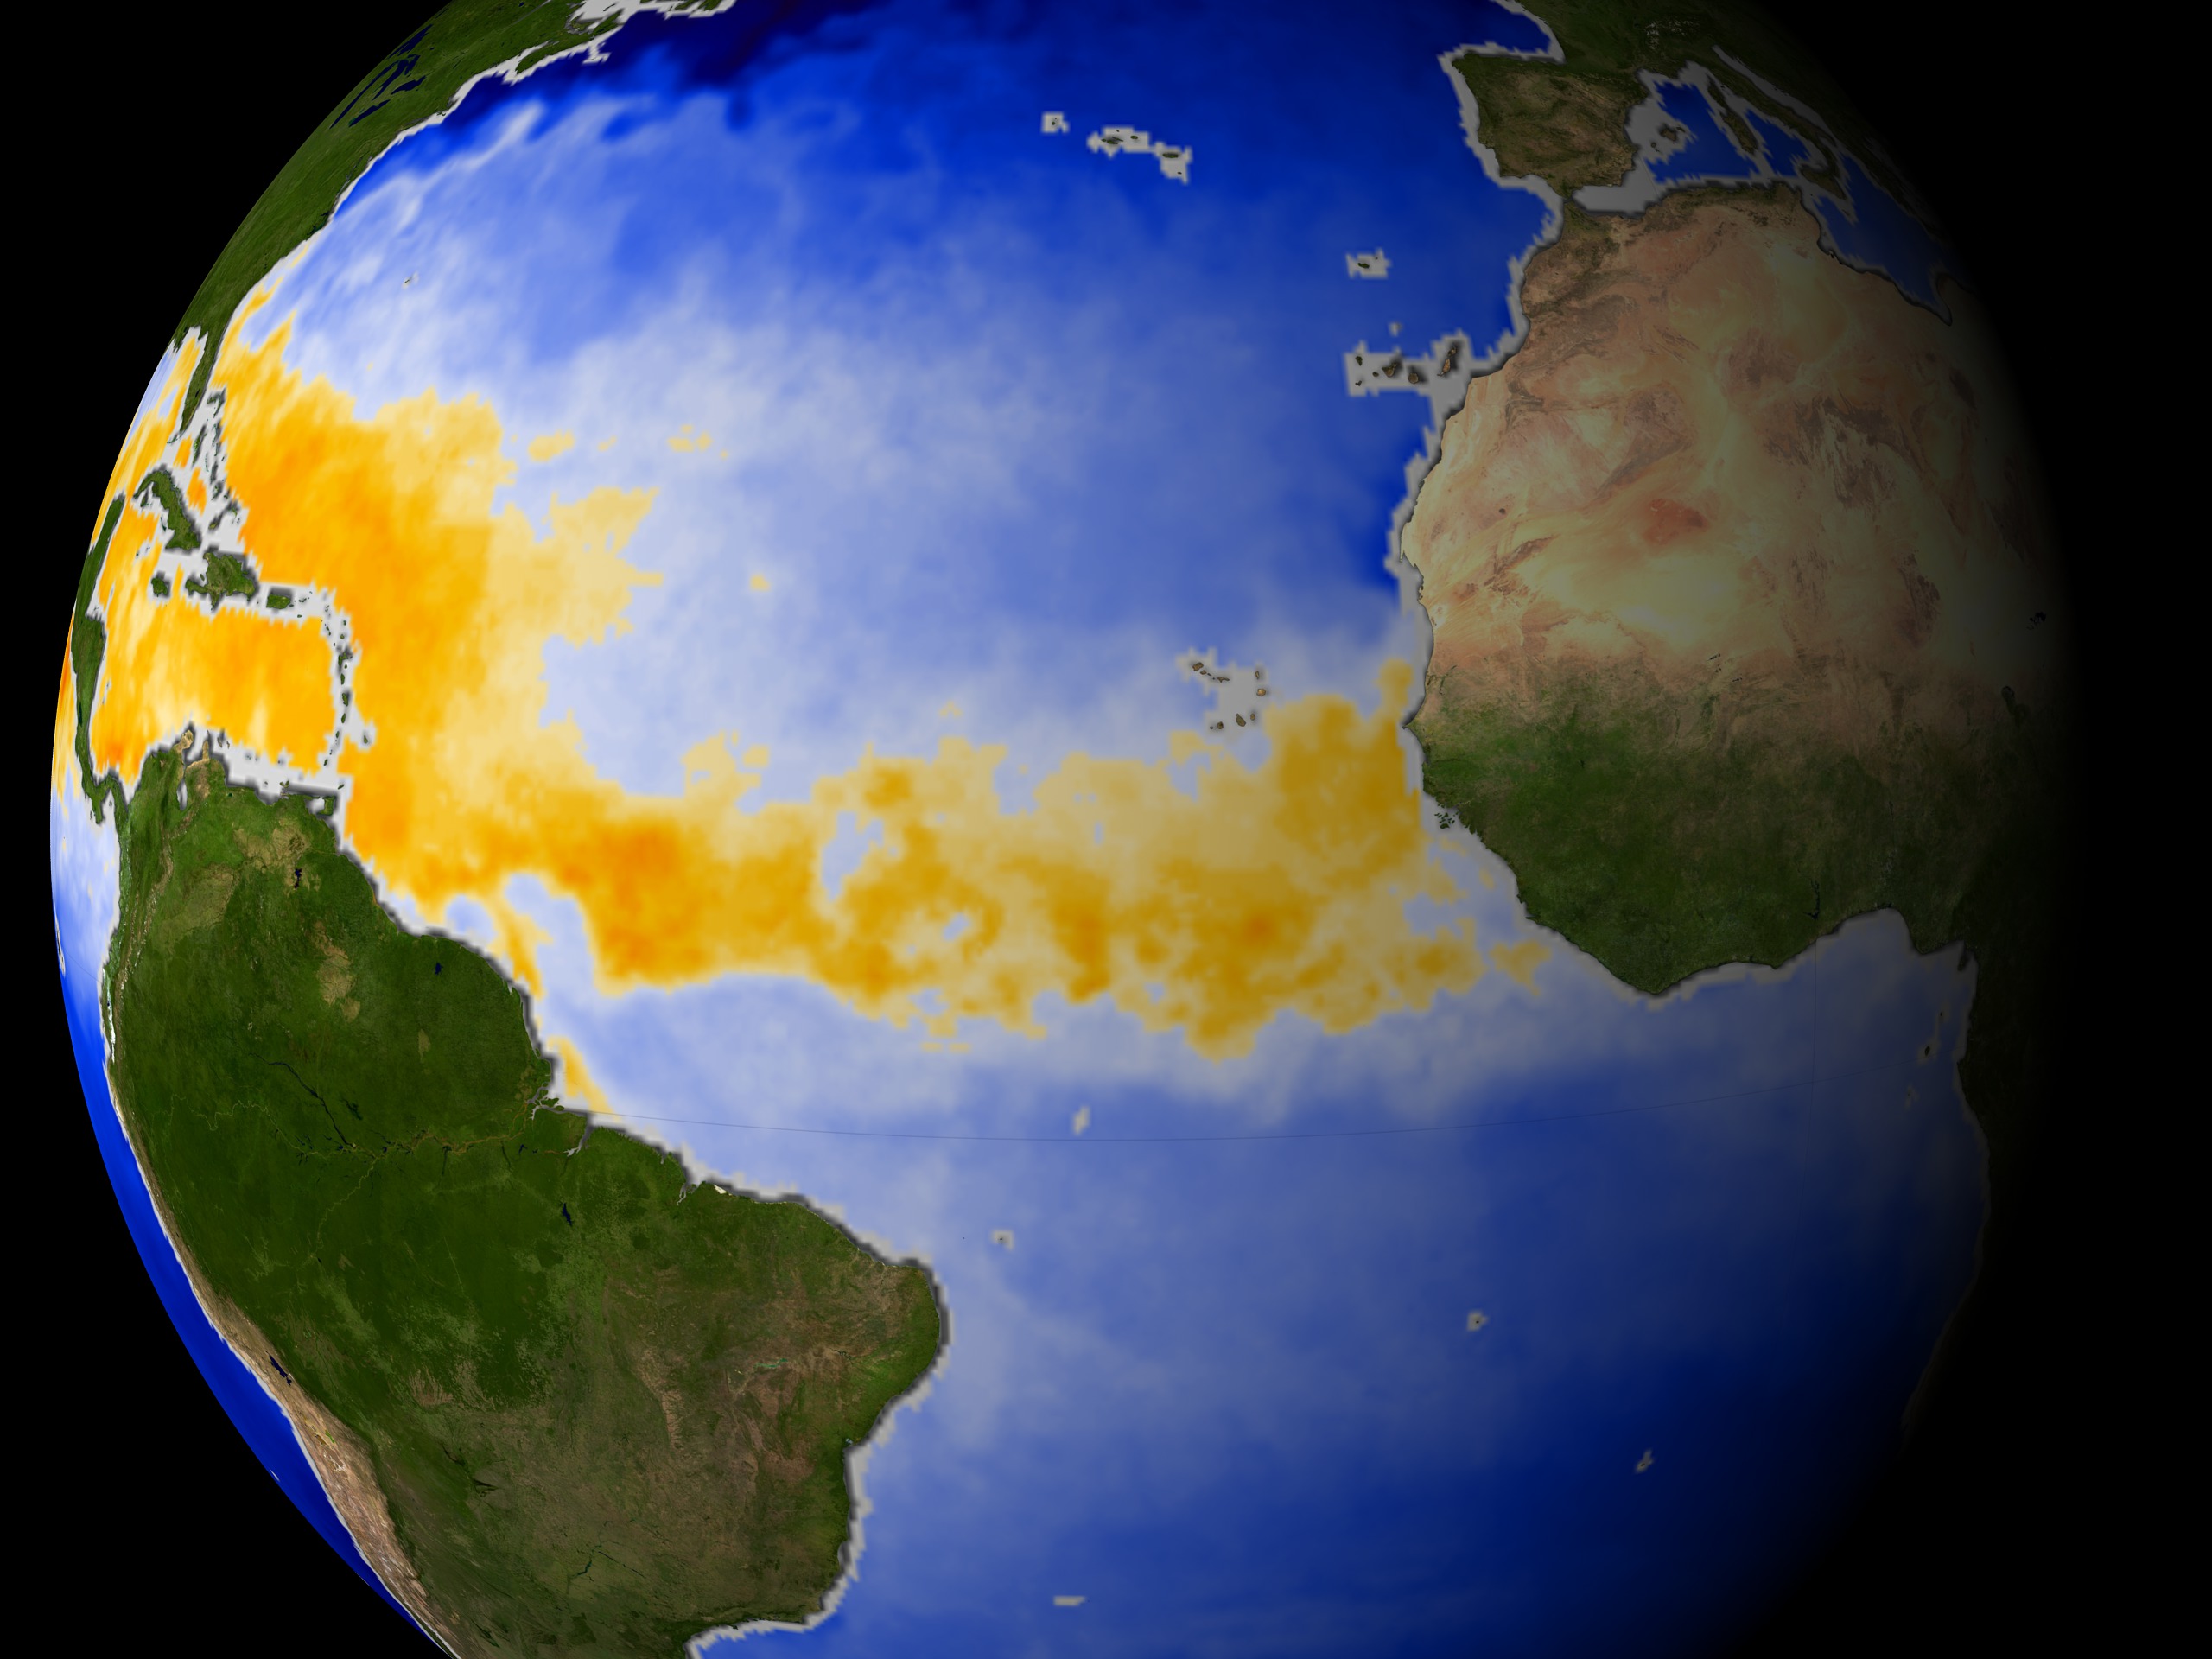
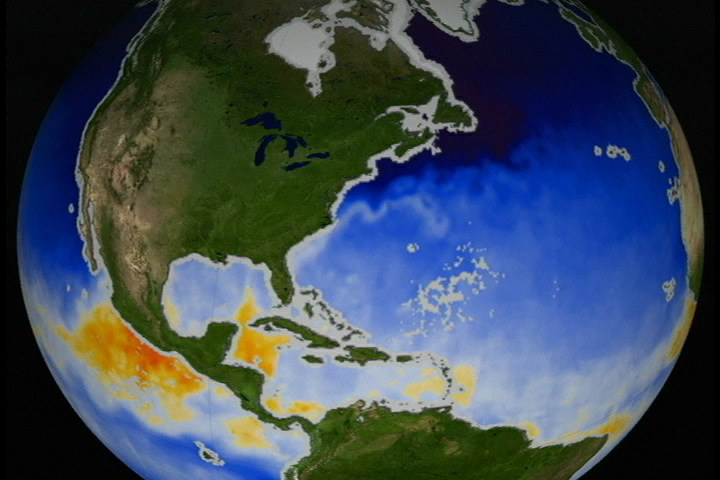
This visualization was created in support of the 'Recipe for a Hurricane' live shot campaign. This visualization shows Sea Surface Temperature as measured by the NASA Aqua satellite's Advanced Microwave Scanning Radiometer (AMSR-E) instrument. Temperature is represented by the colors in the ocean. Orange and red indicate the necessary 82-degree and warmer sea surface temperatures for a hurricane to form.
This visualization was match-frame rendered to another visualization showing GOES clouds.
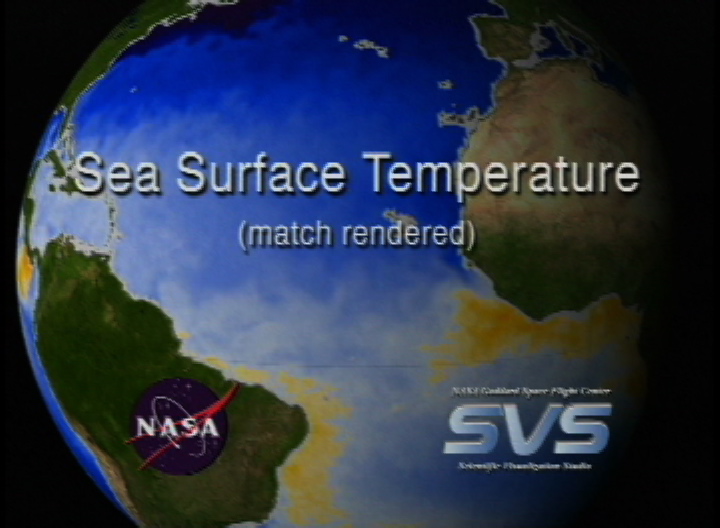
Recipe of a Hurricane (Part 1) - Sea Surface Temperature (match rendered)
This visualization was match-frame rendered to another visualization showing GOES clouds.
Visualization Credits
Greg Shirah (NASA/GSFC): Lead Animator
Jesse Allen (Raytheon): Animator
Jeff Halverson (JCET UMBC): Scientist
Jesse Allen (Raytheon): Animator
Jeff Halverson (JCET UMBC): Scientist
Please give credit for this item to:
NASA/Goddard Space Flight Center Scientific Visualization Studio
NASA/Goddard Space Flight Center Scientific Visualization Studio
Short URL to share this page:
https://svs.gsfc.nasa.gov/2816
Data Used:
Note: While we identify the data sets used in these visualizations, we do not store any further details nor the data sets themselves on our site.
This item is part of this series:
Hurricane Live shots
Goddard TV Tape:
G2003-051
Keywords:
GCMD >> Earth Science >> Atmosphere >> Atmospheric Phenomena >> Hurricanes
NASA Science >> Earth
GCMD keywords can be found on the Internet with the following citation: Olsen, L.M., G. Major, K. Shein, J. Scialdone, S. Ritz, T. Stevens, M. Morahan, A. Aleman, R. Vogel, S. Leicester, H. Weir, M. Meaux, S. Grebas, C.Solomon, M. Holland, T. Northcutt, R. A. Restrepo, R. Bilodeau, 2013. NASA/Global Change Master Directory (GCMD) Earth Science Keywords. Version 8.0.0.0.0
https://svs.gsfc.nasa.gov/2816
Data Used:
Aqua/AMSR-E
2002/06/02-2003/01/22
For more information, please click http://wwwghcc.msfc.nasa.gov/AMSR/
This item is part of this series:
Hurricane Live shots
Goddard TV Tape:
G2003-051
Keywords:
GCMD >> Earth Science >> Atmosphere >> Atmospheric Phenomena >> Hurricanes
NASA Science >> Earth
GCMD keywords can be found on the Internet with the following citation: Olsen, L.M., G. Major, K. Shein, J. Scialdone, S. Ritz, T. Stevens, M. Morahan, A. Aleman, R. Vogel, S. Leicester, H. Weir, M. Meaux, S. Grebas, C.Solomon, M. Holland, T. Northcutt, R. A. Restrepo, R. Bilodeau, 2013. NASA/Global Change Master Directory (GCMD) Earth Science Keywords. Version 8.0.0.0.0


