Earth
ID: 2793
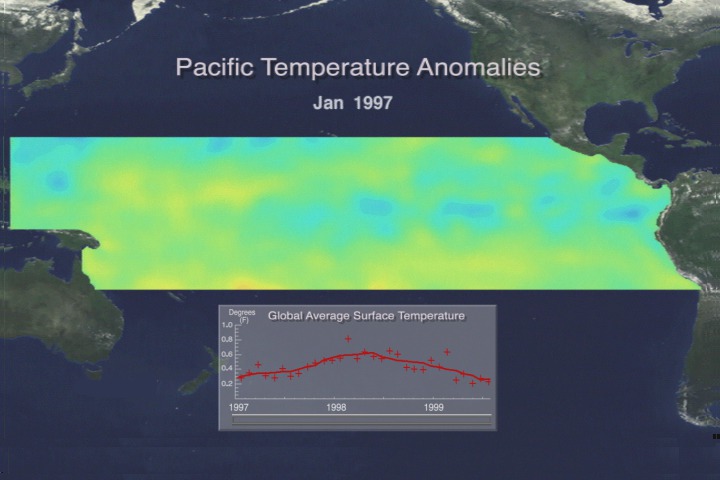
This animation shows the El Niño-La Niña Sea Surface Temperature Anomaly from January 1997 through July 1999. A graph inset shows the global average sea surface temperature fluctuation during this time period.
Pacific Temperature Anomalies with Graph
Visualization Credits
Greg Shirah (NASA/GSFC): Lead Animator
Tom Bridgman (Global Science and Technology, Inc.): Animator
Cindy Starr (Global Science and Technology, Inc.): Visualizer
Antonio Busalacchi (NASA/GSFC): Scientist
Peter Schultz (National Academy of Sciences): Scientist
Tom Bridgman (Global Science and Technology, Inc.): Animator
Cindy Starr (Global Science and Technology, Inc.): Visualizer
Antonio Busalacchi (NASA/GSFC): Scientist
Peter Schultz (National Academy of Sciences): Scientist
Please give credit for this item to:
NASA/Goddard Space Flight Center Scientific Visualization Studio
NASA/Goddard Space Flight Center Scientific Visualization Studio
Short URL to share this page:
https://svs.gsfc.nasa.gov/2793
Data Used:
Note: While we identify the data sets used in these visualizations, we do not store any further details nor the data sets themselves on our site.
Dates of Data Used:
1997/01/01 - 1999/07/31
Keywords:
DLESE >> Physical oceanography
NASA Science >> Earth
https://svs.gsfc.nasa.gov/2793
Data Used:
NOAA-14/AVHRR/NCEP Sea Surface Temperature Anomaly
1997/01/01 - 1999/07/31Dates of Data Used:
1997/01/01 - 1999/07/31
Keywords:
DLESE >> Physical oceanography
NASA Science >> Earth


