Earth
ID: 2657
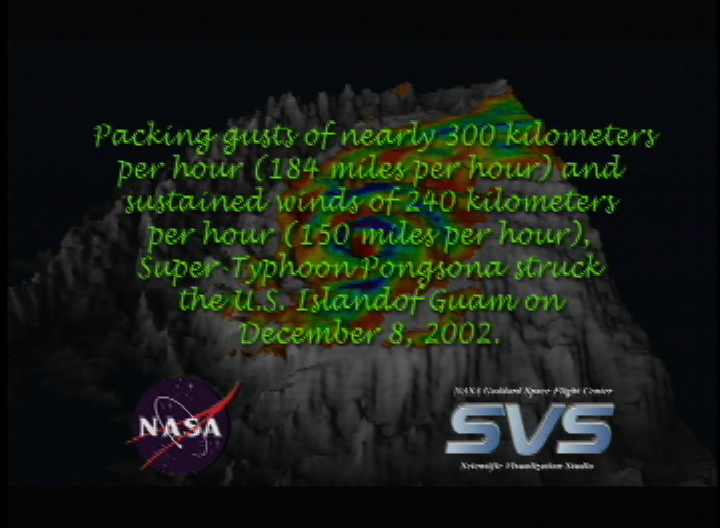
Packing gusts of nearly 300 kilometers per hour (184 miles per hour) and sustained winds of 240 kilometers per hour (150 miles per hour), Super-Typhoon Pongsona struck the U.S. Island of Guam on December 8, 2002. This 3D model of the hurricane shows the outline of the clouds, based on cloud top heights derived from AIRS observations. The color overlay represents the brightness temperatures observed in one of the HSB channels. Blue areas indicate intense convection and rain, while green and yellow reflect the internal temperature of the clouds. Microwaves, unlike infrared radiation, penetrate clouds and look into them or even through them. Red, most of which has been removed from the picture for clarity, represents areas where HSB penetrates all the way to the surface.
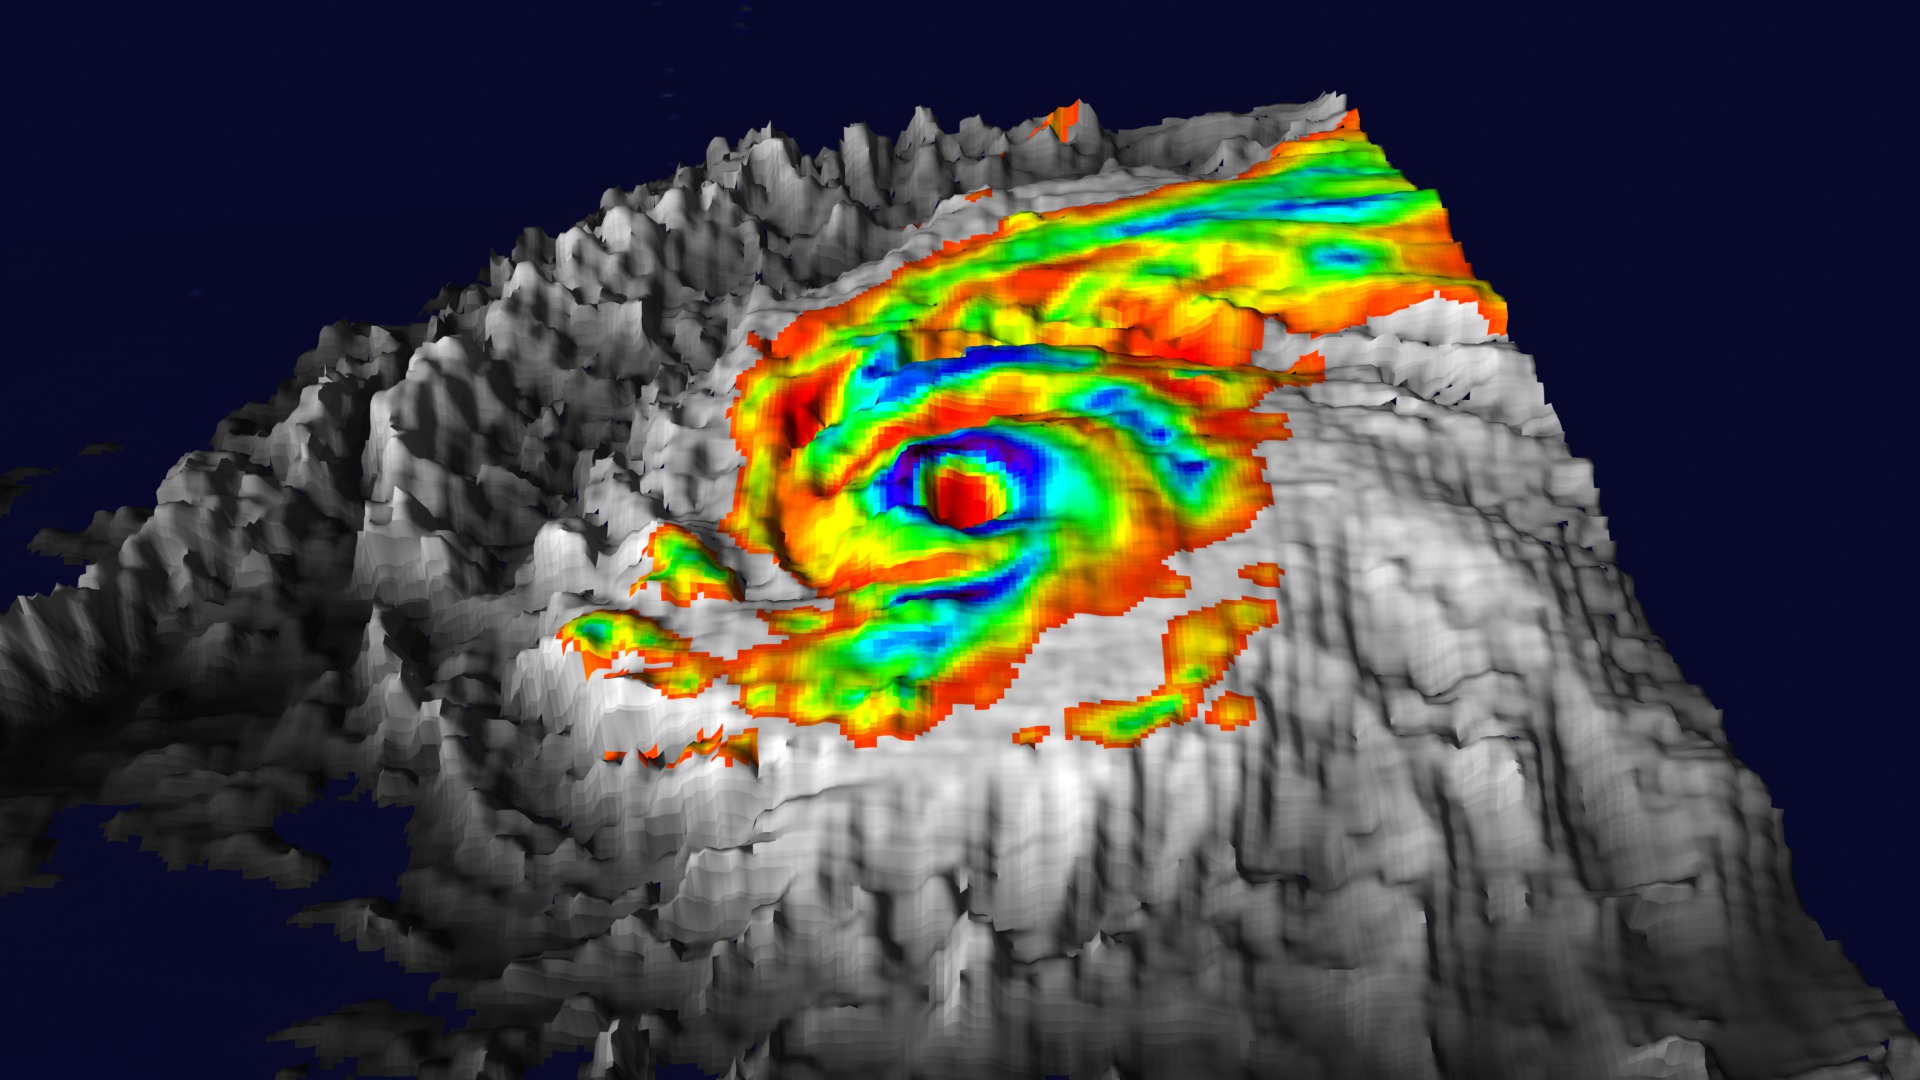
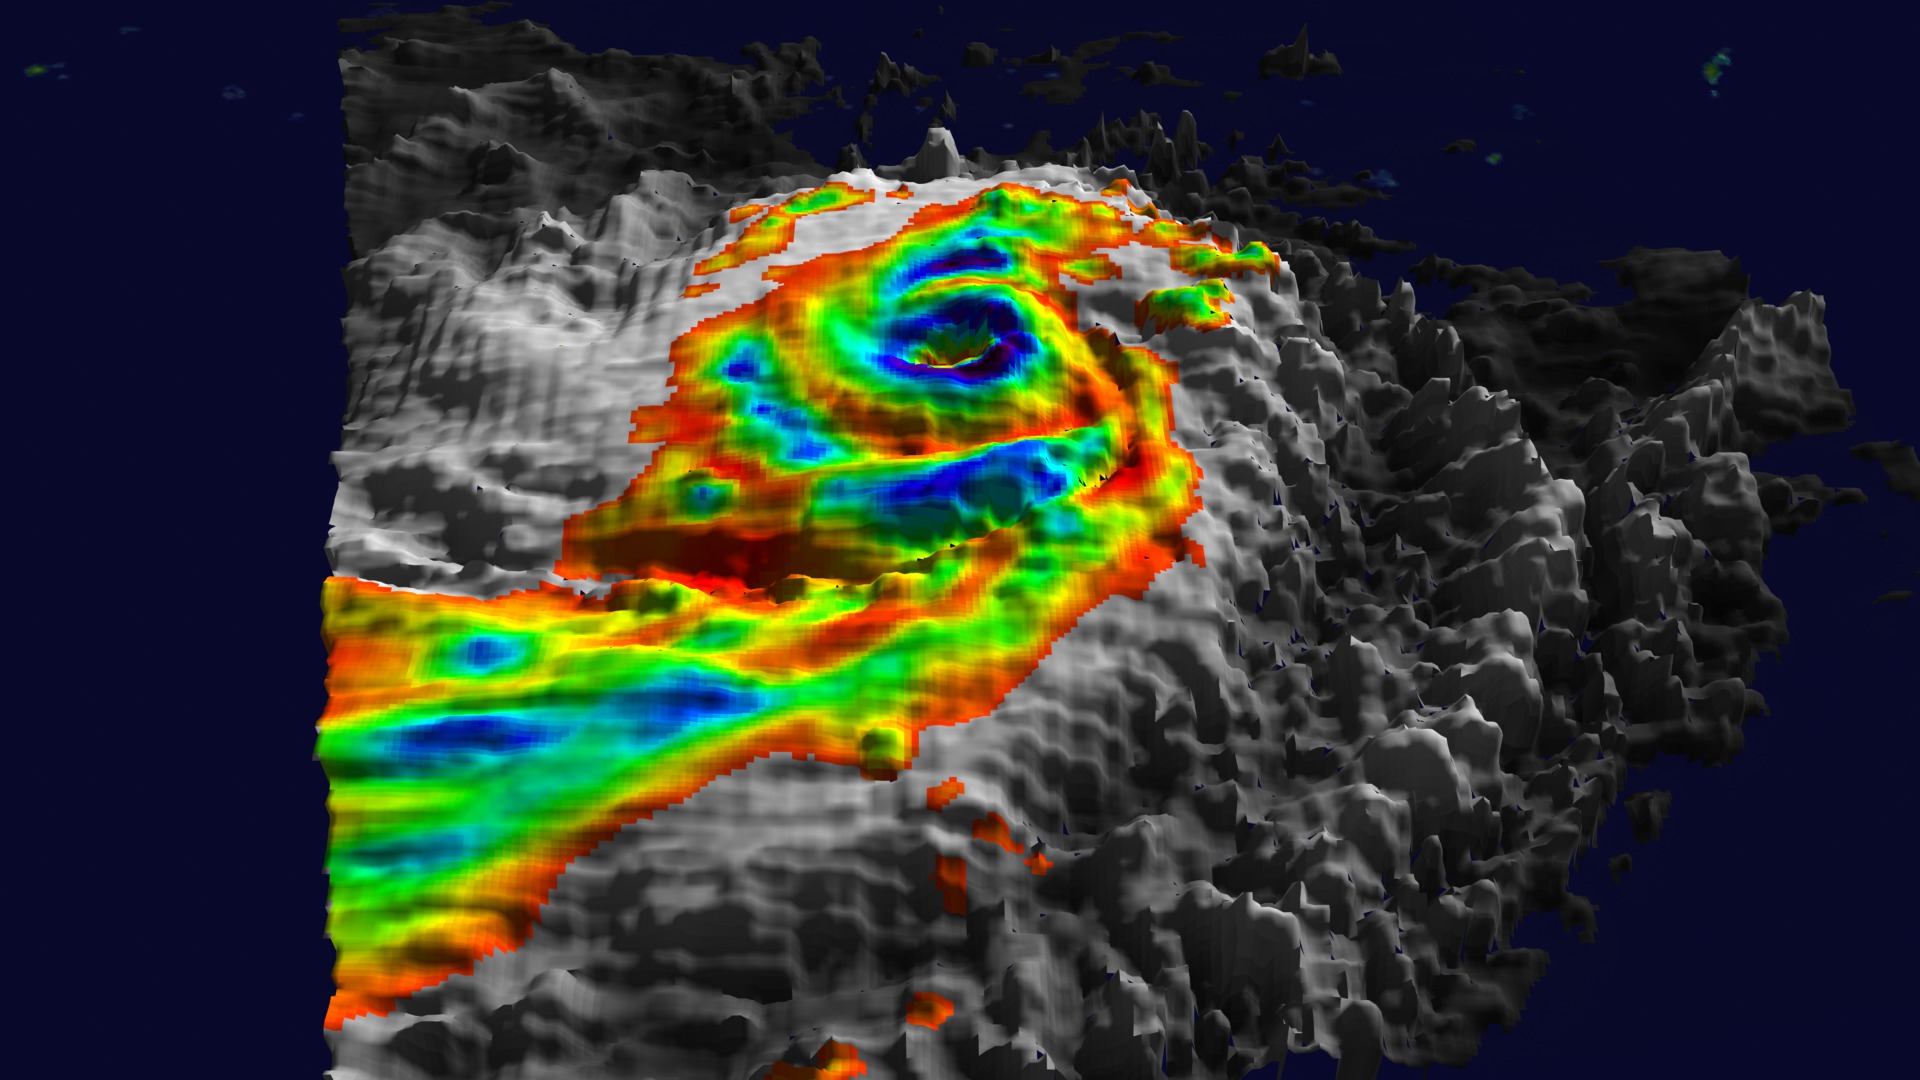
Super-Typhoon Pongsona Visualized from AIRS Instrument Suite Data
Visualization Credits
Stuart A. Snodgrass (GST): Lead Animator
Sharon Okonek (NASA/JPL CalTech): Scientist
Bjorn H. Lambrigtsen (NASA/JPL CalTech): Scientist
Sharon Okonek (NASA/JPL CalTech): Scientist
Bjorn H. Lambrigtsen (NASA/JPL CalTech): Scientist
Please give credit for this item to:
NASA/Goddard Space Flight Center Scientific Visualization Studio The Blue Marble Next Generation data is courtesy of Reto Stockli (NASA/GSFC) and NASA's Earth Observatory.
NASA/Goddard Space Flight Center Scientific Visualization Studio The Blue Marble Next Generation data is courtesy of Reto Stockli (NASA/GSFC) and NASA's Earth Observatory.
Short URL to share this page:
https://svs.gsfc.nasa.gov/2657
Mission:
Terra
Data Used:
Note: While we identify the data sets used in these visualizations, we do not store any further details nor the data sets themselves on our site.
Keywords:
DLESE >> Atmospheric science
DLESE >> Natural hazards
SVS >> Supertyphoon Pongsona
NASA Science >> Earth
https://svs.gsfc.nasa.gov/2657
Mission:
Terra
Data Used:
Aqua/AIRS
2002/12/08
For more information on the Atmospheric Infrared Sounder, click http://www-airs.jpl.nasa.gov/
Terra and Aqua/MODIS/Blue Marble: Next Generation also referred to as: BMNG
1/1/2004 - 12/31/2004
Credit:
The Blue Marble data is courtesy of Reto Stockli (NASA/GSFC).
The Blue Marble data is courtesy of Reto Stockli (NASA/GSFC).
Keywords:
DLESE >> Atmospheric science
DLESE >> Natural hazards
SVS >> Supertyphoon Pongsona
NASA Science >> Earth


