Earth
ID: 2526
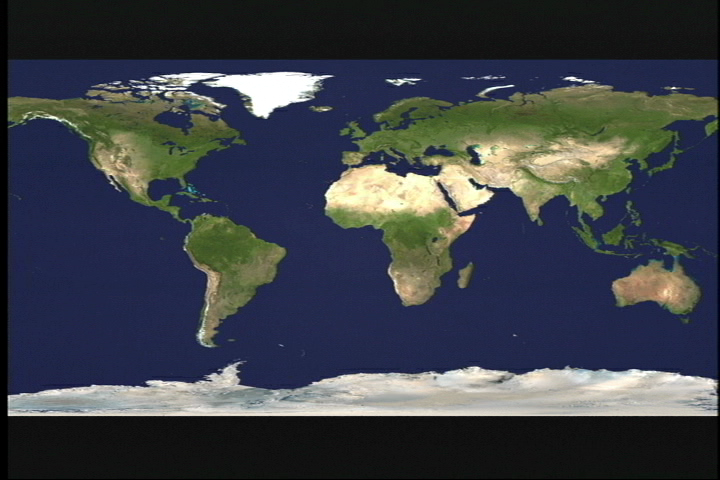
This animation shows a unique picture of seasonal and yearly fire activity. Here, global fire activity is displayed as tiny particles on a flat map with each particle depicting the site at which a fire was detected. Daily fires are displayed at a rate of 10 days per second. The fire particles fade over 1.7 seconds and change color as they age from red to orange, yellow and gray.
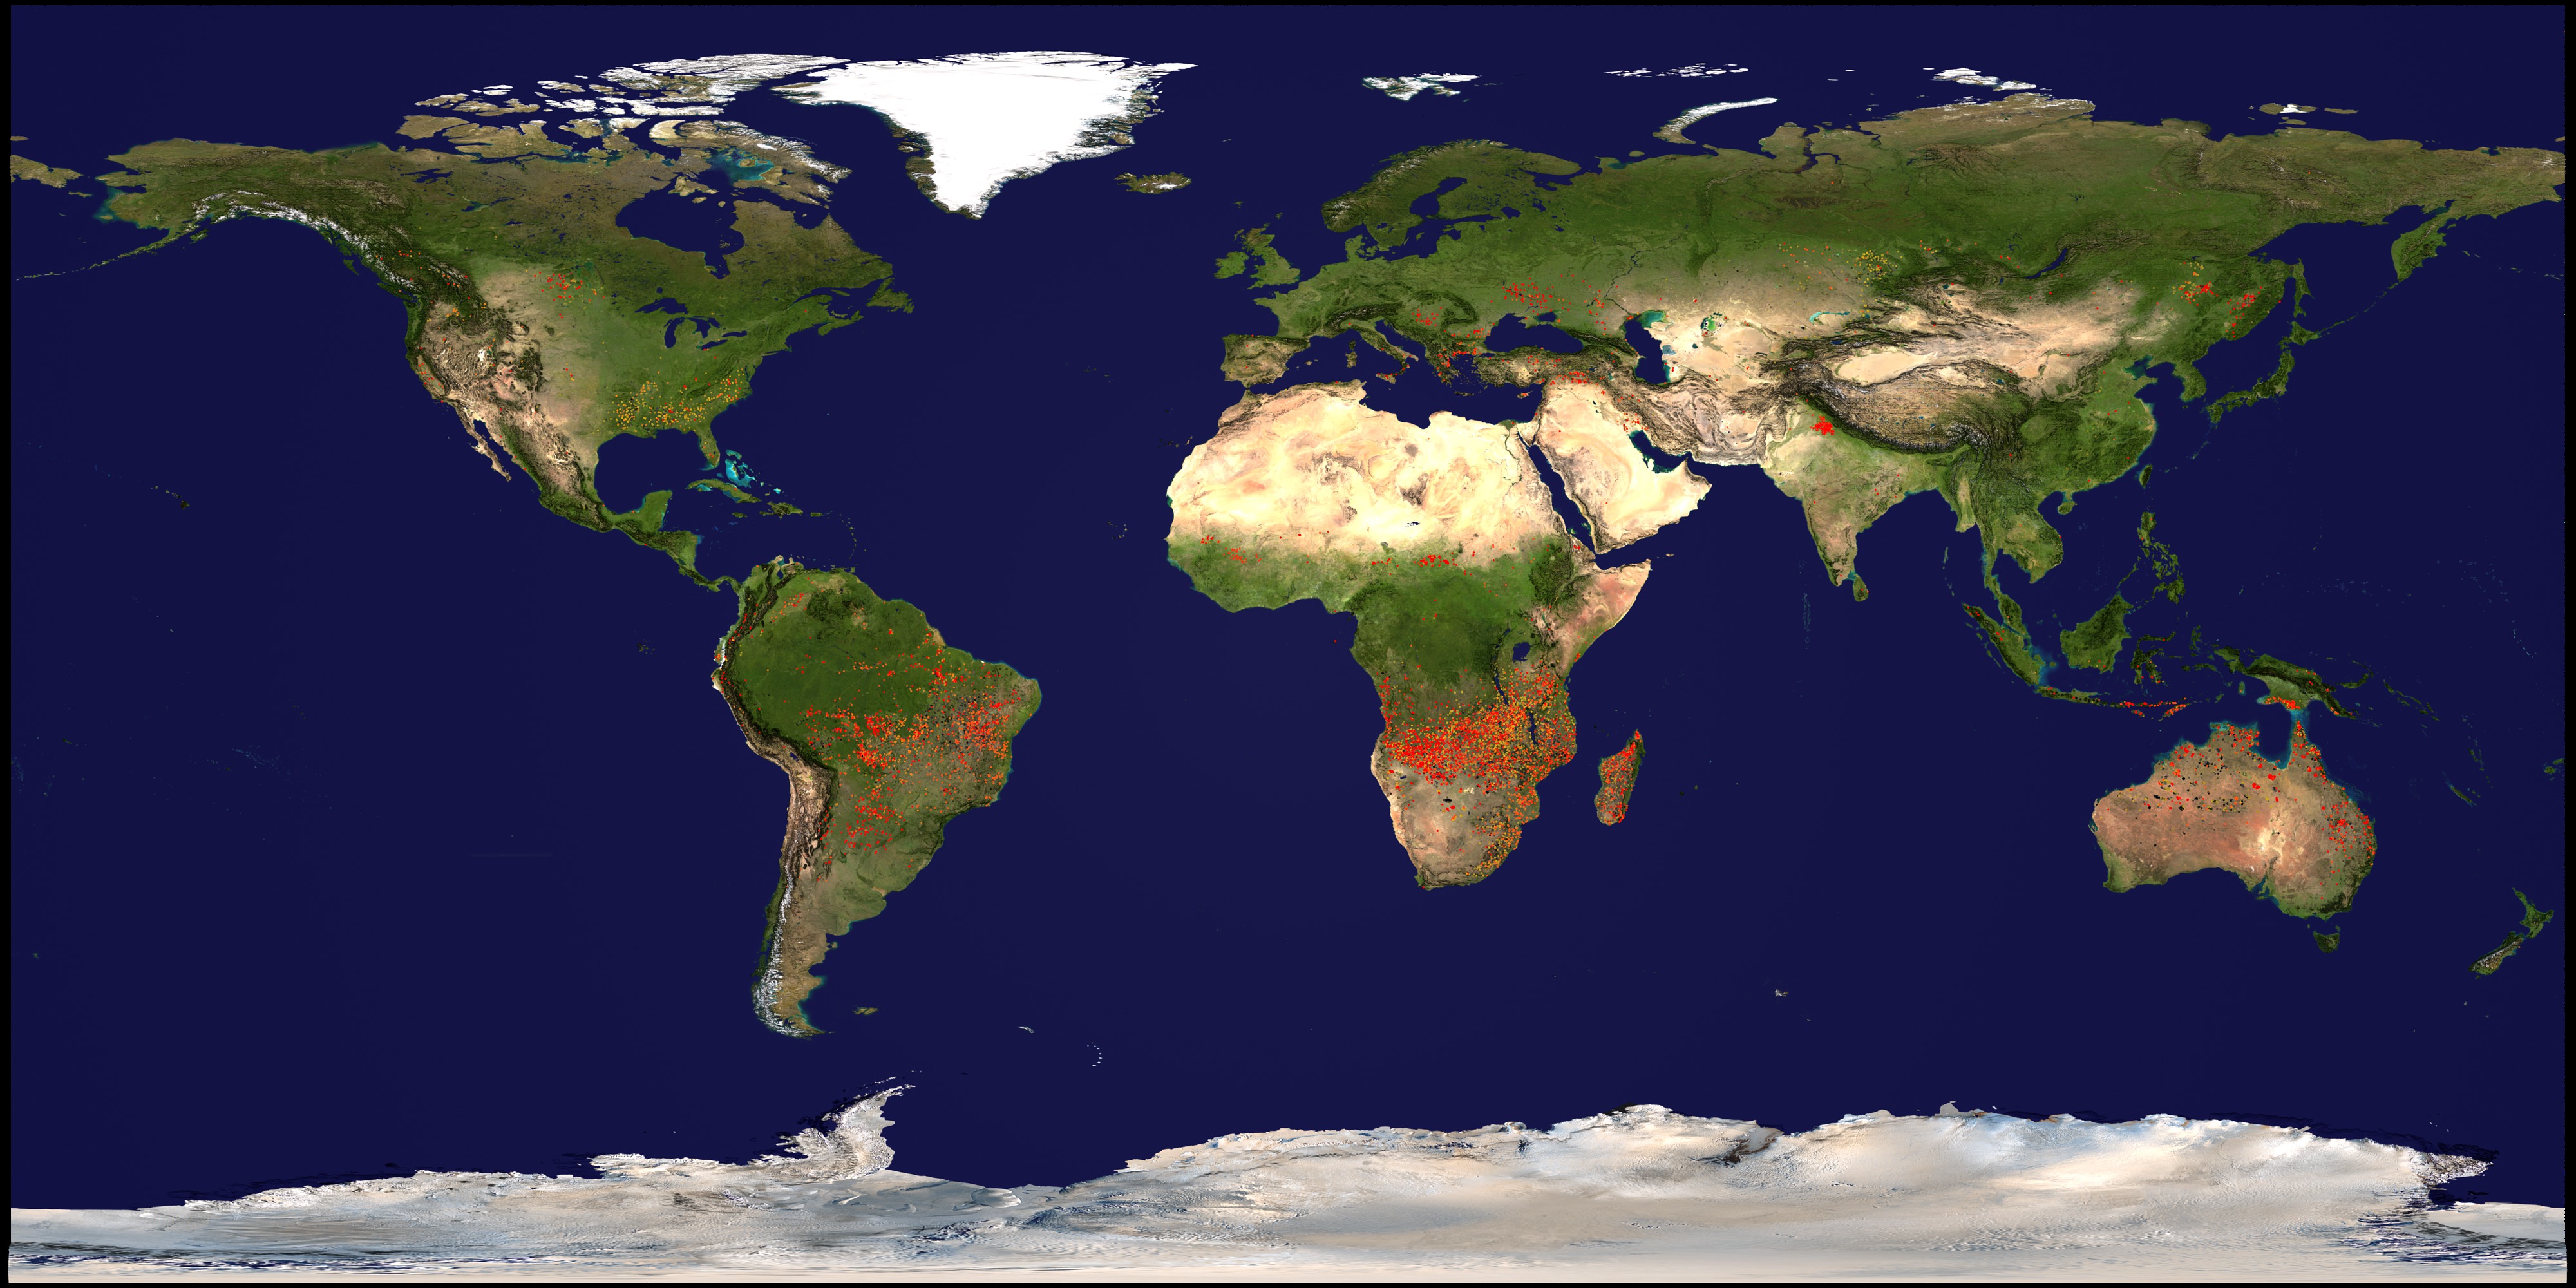
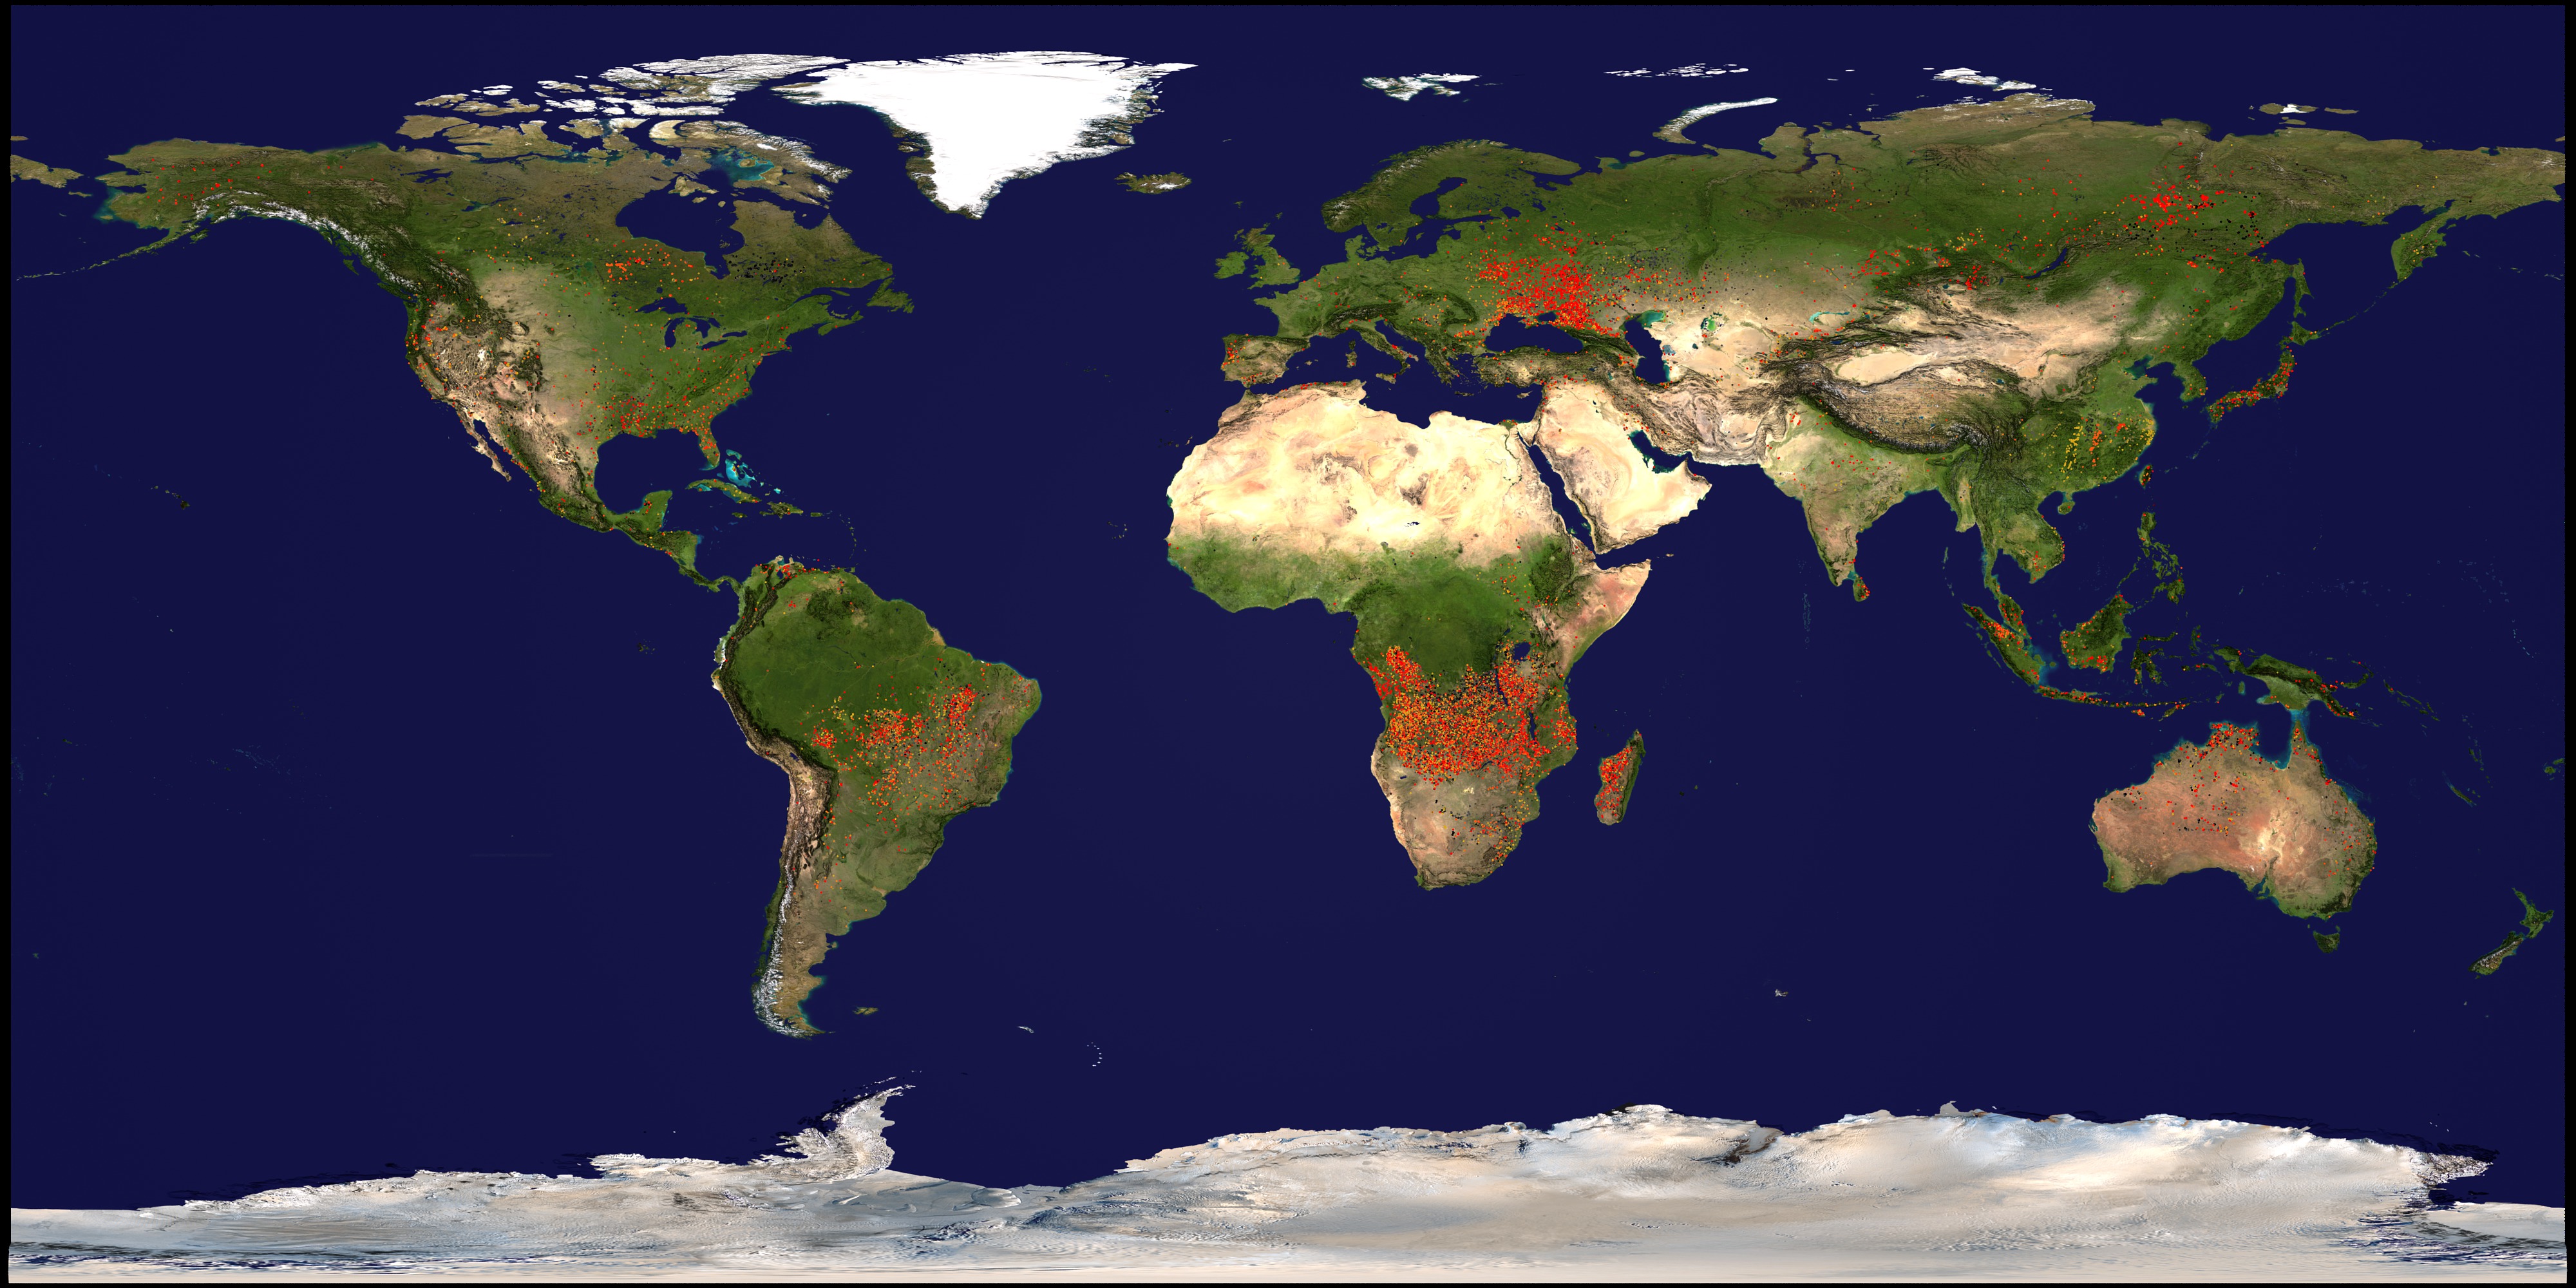
Annual Portrait of Global Fires during 2001 and 2002 on a Flat Map
Visualization Credits
Cindy Starr (Global Science and Technology, Inc.): Lead Visualizer
Greg Shirah (NASA/GSFC): Animator
Robert Sohlberg (University of Maryland): Scientist
Chris Justice (University of Maryland): Scientist
Greg Shirah (NASA/GSFC): Animator
Robert Sohlberg (University of Maryland): Scientist
Chris Justice (University of Maryland): Scientist
Please give credit for this item to:
NASA/Goddard Space Flight Center Scientific Visualization Studio. Fire location data courtesy of MODIS Rapid Response Project (NASA/GSFC and University of Maryland). The Blue Marble Next Generation data is courtesy of Reto Stockli (NASA/GSFC) and NASA's Earth Observatory.
NASA/Goddard Space Flight Center Scientific Visualization Studio. Fire location data courtesy of MODIS Rapid Response Project (NASA/GSFC and University of Maryland). The Blue Marble Next Generation data is courtesy of Reto Stockli (NASA/GSFC) and NASA's Earth Observatory.
Short URL to share this page:
https://svs.gsfc.nasa.gov/2526
Mission:
Terra
Data Used:
Note: While we identify the data sets used in these visualizations, we do not store any further details nor the data sets themselves on our site.
This item is part of this series:
Global Fires 2002
Keywords:
DLESE >> Atmospheric science
DLESE >> Forestry
DLESE >> Natural hazards
GCMD >> Earth Science >> Biosphere >> Ecological Dynamics >> Fire Occurrence
GCMD >> Location >> Global
NASA Science >> Earth
GCMD keywords can be found on the Internet with the following citation: Olsen, L.M., G. Major, K. Shein, J. Scialdone, S. Ritz, T. Stevens, M. Morahan, A. Aleman, R. Vogel, S. Leicester, H. Weir, M. Meaux, S. Grebas, C.Solomon, M. Holland, T. Northcutt, R. A. Restrepo, R. Bilodeau, 2013. NASA/Global Change Master Directory (GCMD) Earth Science Keywords. Version 8.0.0.0.0
https://svs.gsfc.nasa.gov/2526
Mission:
Terra
Data Used:
Terra and Aqua/MODIS/Fire Location
2001/08/21 - 2002/08/20
Credit:
Fire location data courtesy of MODIS Rapid Response Project (NASA/GSFC and University of Maryland - http://rapidfire.sci.gsfc.nasa.gov)
Fire location data courtesy of MODIS Rapid Response Project (NASA/GSFC and University of Maryland - http://rapidfire.sci.gsfc.nasa.gov)
Terra and Aqua/MODIS/Blue Marble: Next Generation also referred to as: BMNG
1/1/2004 - 12/31/2004
Credit:
The Blue Marble data is courtesy of Reto Stockli (NASA/GSFC).
The Blue Marble data is courtesy of Reto Stockli (NASA/GSFC).
This item is part of this series:
Global Fires 2002
Keywords:
DLESE >> Atmospheric science
DLESE >> Forestry
DLESE >> Natural hazards
GCMD >> Earth Science >> Biosphere >> Ecological Dynamics >> Fire Occurrence
GCMD >> Location >> Global
NASA Science >> Earth
GCMD keywords can be found on the Internet with the following citation: Olsen, L.M., G. Major, K. Shein, J. Scialdone, S. Ritz, T. Stevens, M. Morahan, A. Aleman, R. Vogel, S. Leicester, H. Weir, M. Meaux, S. Grebas, C.Solomon, M. Holland, T. Northcutt, R. A. Restrepo, R. Bilodeau, 2013. NASA/Global Change Master Directory (GCMD) Earth Science Keywords. Version 8.0.0.0.0


