Planets and Moons
ID: 2309
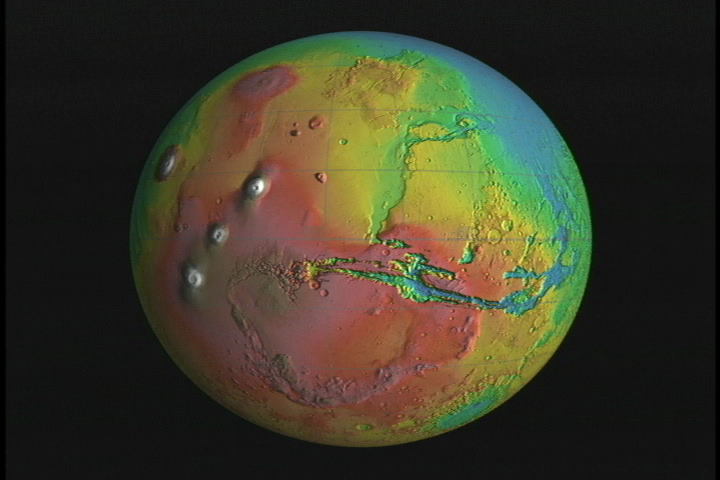
This is a visualization of a series of graphs showing the seasonal changes in the Martian polar caps. This particular version includes just the north pole without the Martian year timestamp.
MOLA: Seasonal Snow Variations on Mars, graph showing snow variations at north pole, without dates
Visualization Credits
Greg Shirah (NASA/GSFC): Lead Animator
David Smith (NASA/GSFC): Scientist
Maria Zuber (Massachusetts Institute of Technology): Scientist
David Smith (NASA/GSFC): Scientist
Maria Zuber (Massachusetts Institute of Technology): Scientist
Please give credit for this item to:
NASA/Goddard Space Flight Center Scientific Visualization Studio
NASA/Goddard Space Flight Center Scientific Visualization Studio
Science Paper:
http://ltpwww.gsfc.nasa.gov/tharsis/snow_paper.html
Short URL to share this page:
https://svs.gsfc.nasa.gov/2309
Missions:
Mars Global Surveyor - MGS
Viking
Data Used:
Note: While we identify the data sets used in these visualizations, we do not store any further details nor the data sets themselves on our site.
This item is part of this series:
Mars Seasonal Snow Variations
Keywords:
DLESE >> Cryology
SVS >> Frost
SVS >> Mars
SVS >> Pole
DLESE >> Space science
GCMD >> Earth Science >> Atmosphere >> Precipitation >> Snow
NASA Science >> Planets and Moons
GCMD keywords can be found on the Internet with the following citation: Olsen, L.M., G. Major, K. Shein, J. Scialdone, S. Ritz, T. Stevens, M. Morahan, A. Aleman, R. Vogel, S. Leicester, H. Weir, M. Meaux, S. Grebas, C.Solomon, M. Holland, T. Northcutt, R. A. Restrepo, R. Bilodeau, 2013. NASA/Global Change Master Directory (GCMD) Earth Science Keywords. Version 8.0.0.0.0
http://ltpwww.gsfc.nasa.gov/tharsis/snow_paper.html
Short URL to share this page:
https://svs.gsfc.nasa.gov/2309
Missions:
Mars Global Surveyor - MGS
Viking
Data Used:
MGS/MOLA
1997/09/15-2001/06/30This item is part of this series:
Mars Seasonal Snow Variations
Keywords:
DLESE >> Cryology
SVS >> Frost
SVS >> Mars
SVS >> Pole
DLESE >> Space science
GCMD >> Earth Science >> Atmosphere >> Precipitation >> Snow
NASA Science >> Planets and Moons
GCMD keywords can be found on the Internet with the following citation: Olsen, L.M., G. Major, K. Shein, J. Scialdone, S. Ritz, T. Stevens, M. Morahan, A. Aleman, R. Vogel, S. Leicester, H. Weir, M. Meaux, S. Grebas, C.Solomon, M. Holland, T. Northcutt, R. A. Restrepo, R. Bilodeau, 2013. NASA/Global Change Master Directory (GCMD) Earth Science Keywords. Version 8.0.0.0.0


