Earth
ID: 2057
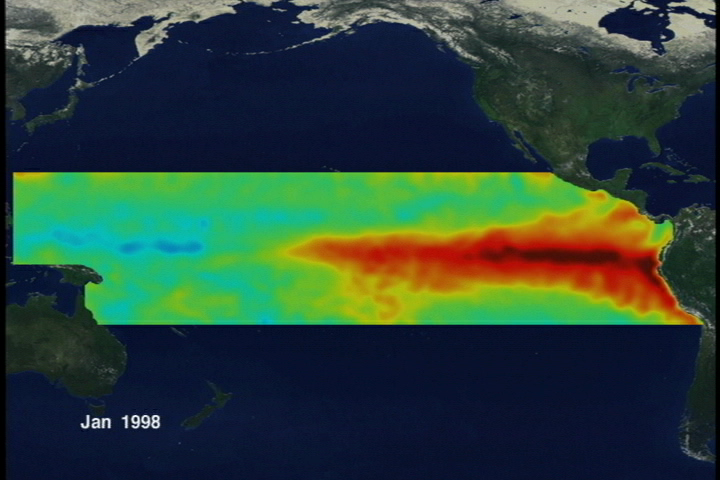
A view of El Niño and La Niña through Pacific sea surface temperature anomalies from 1998 through 2001.
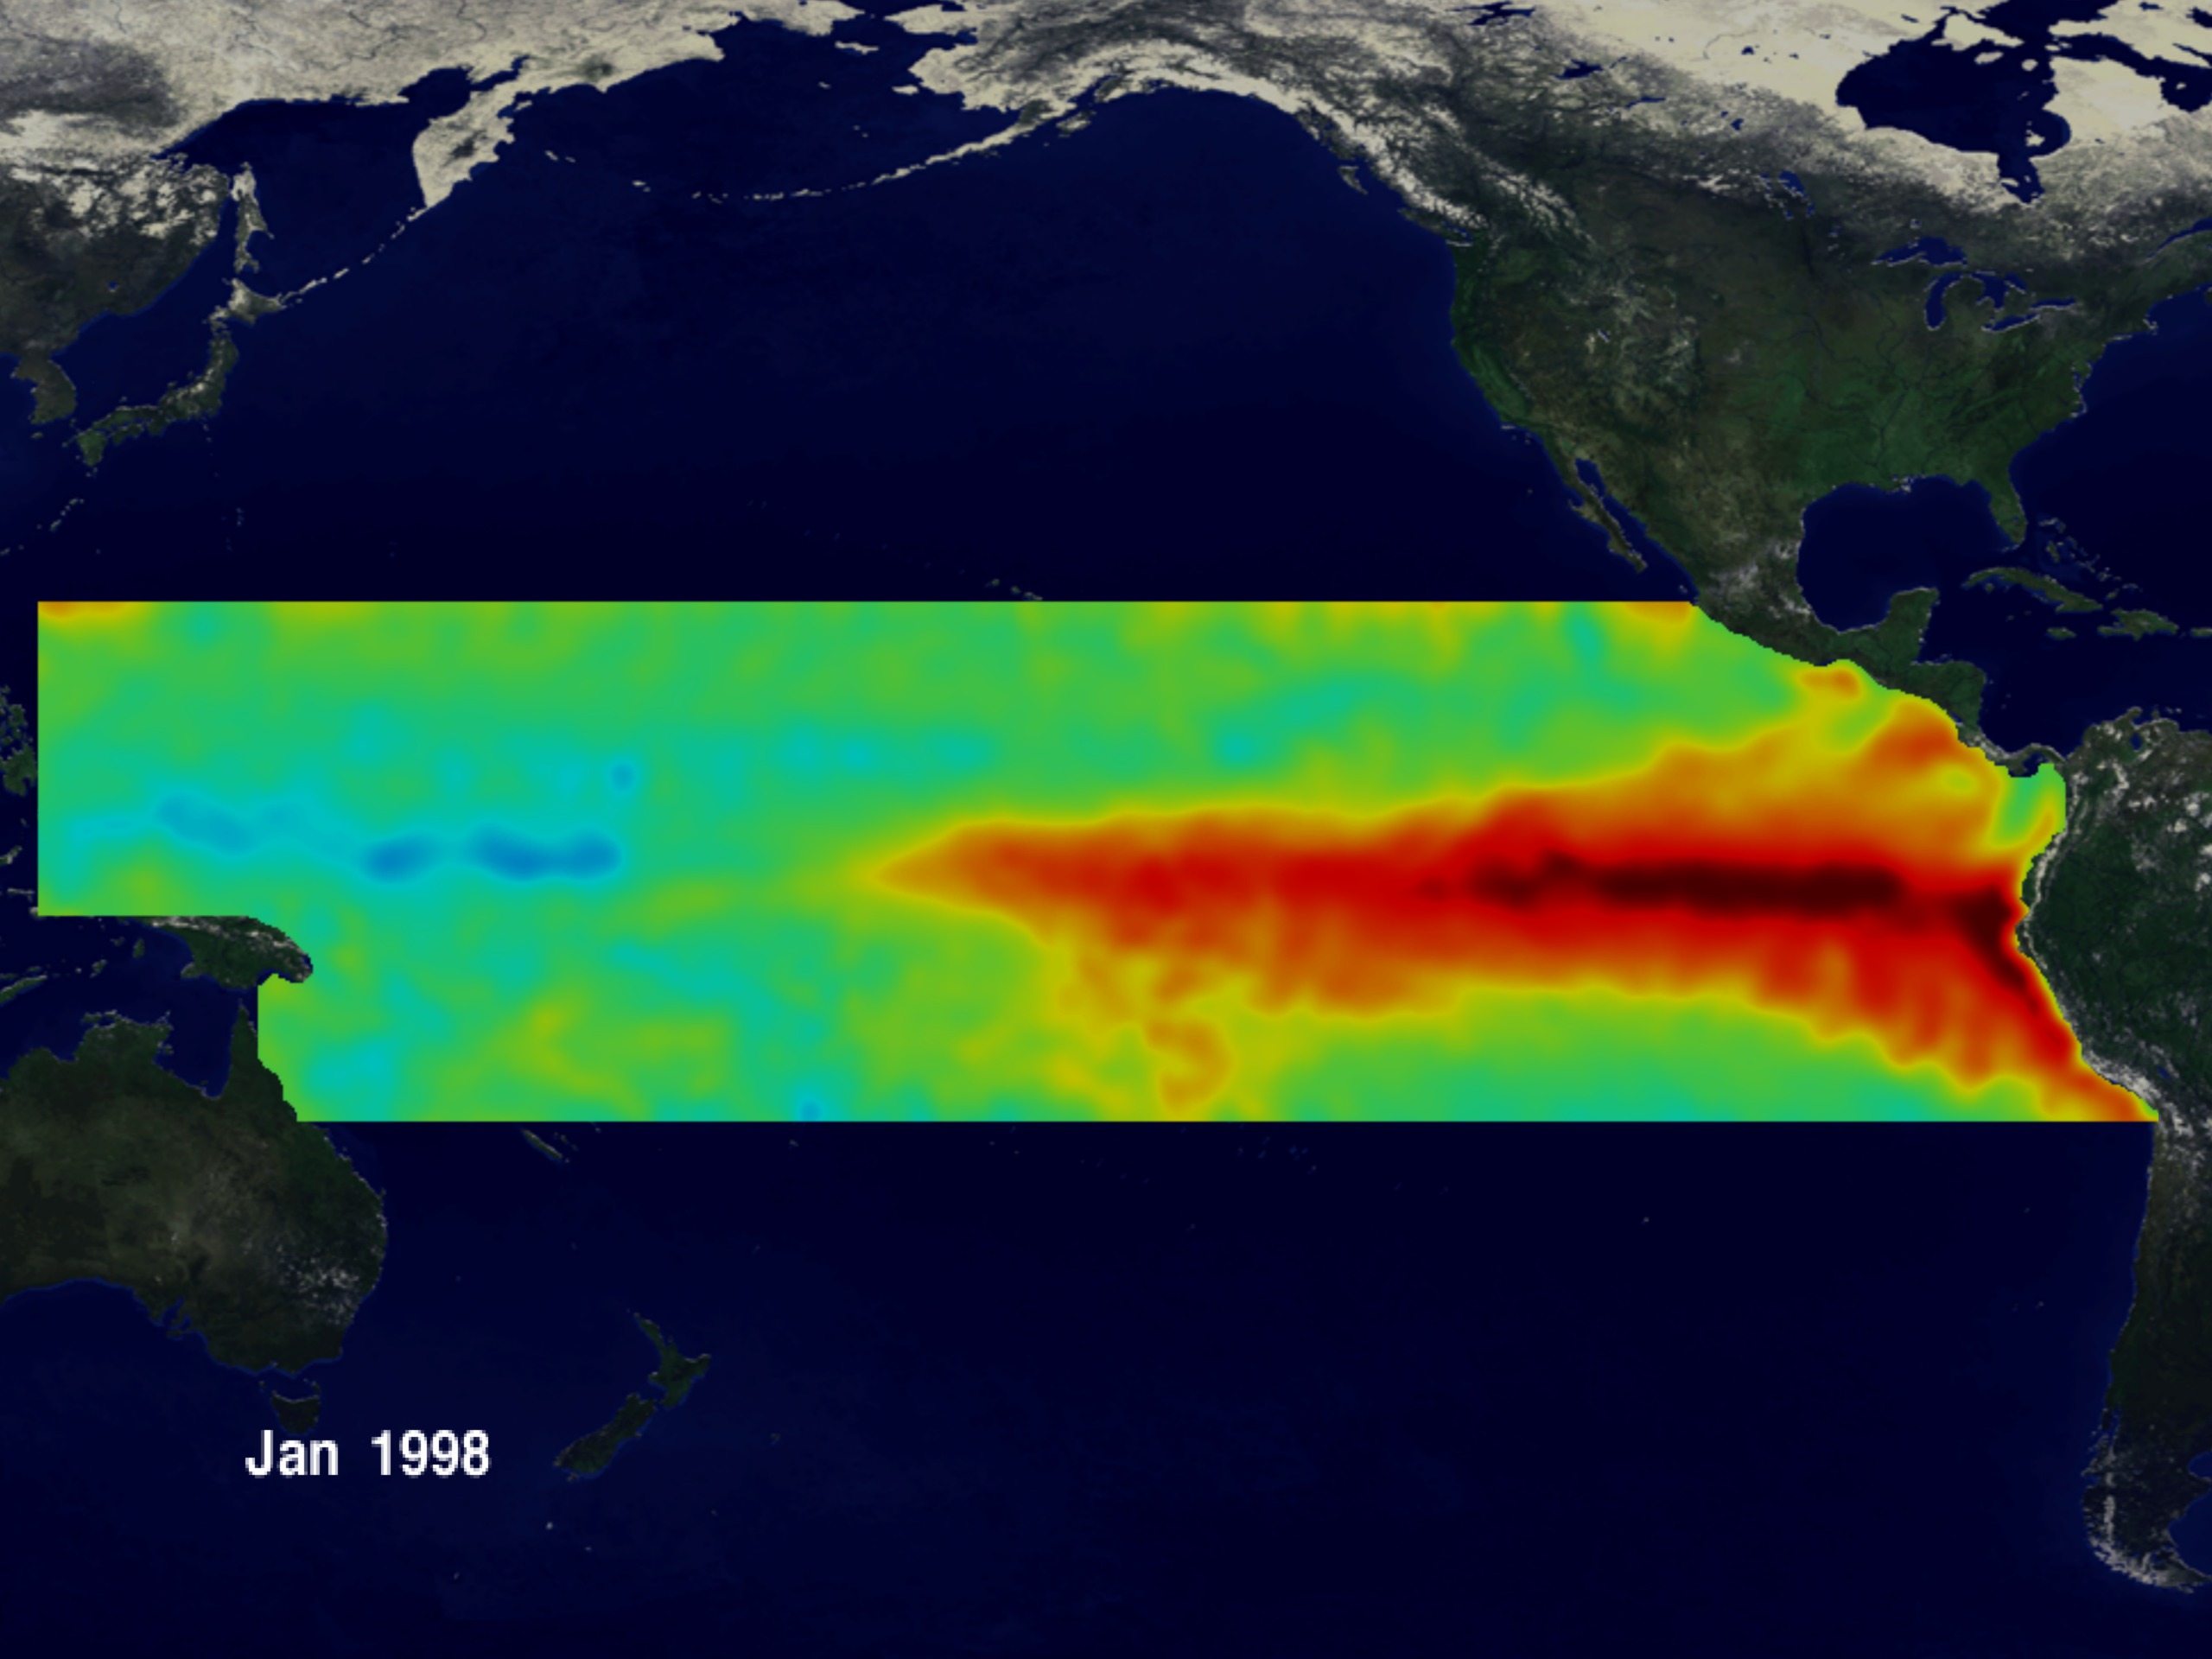
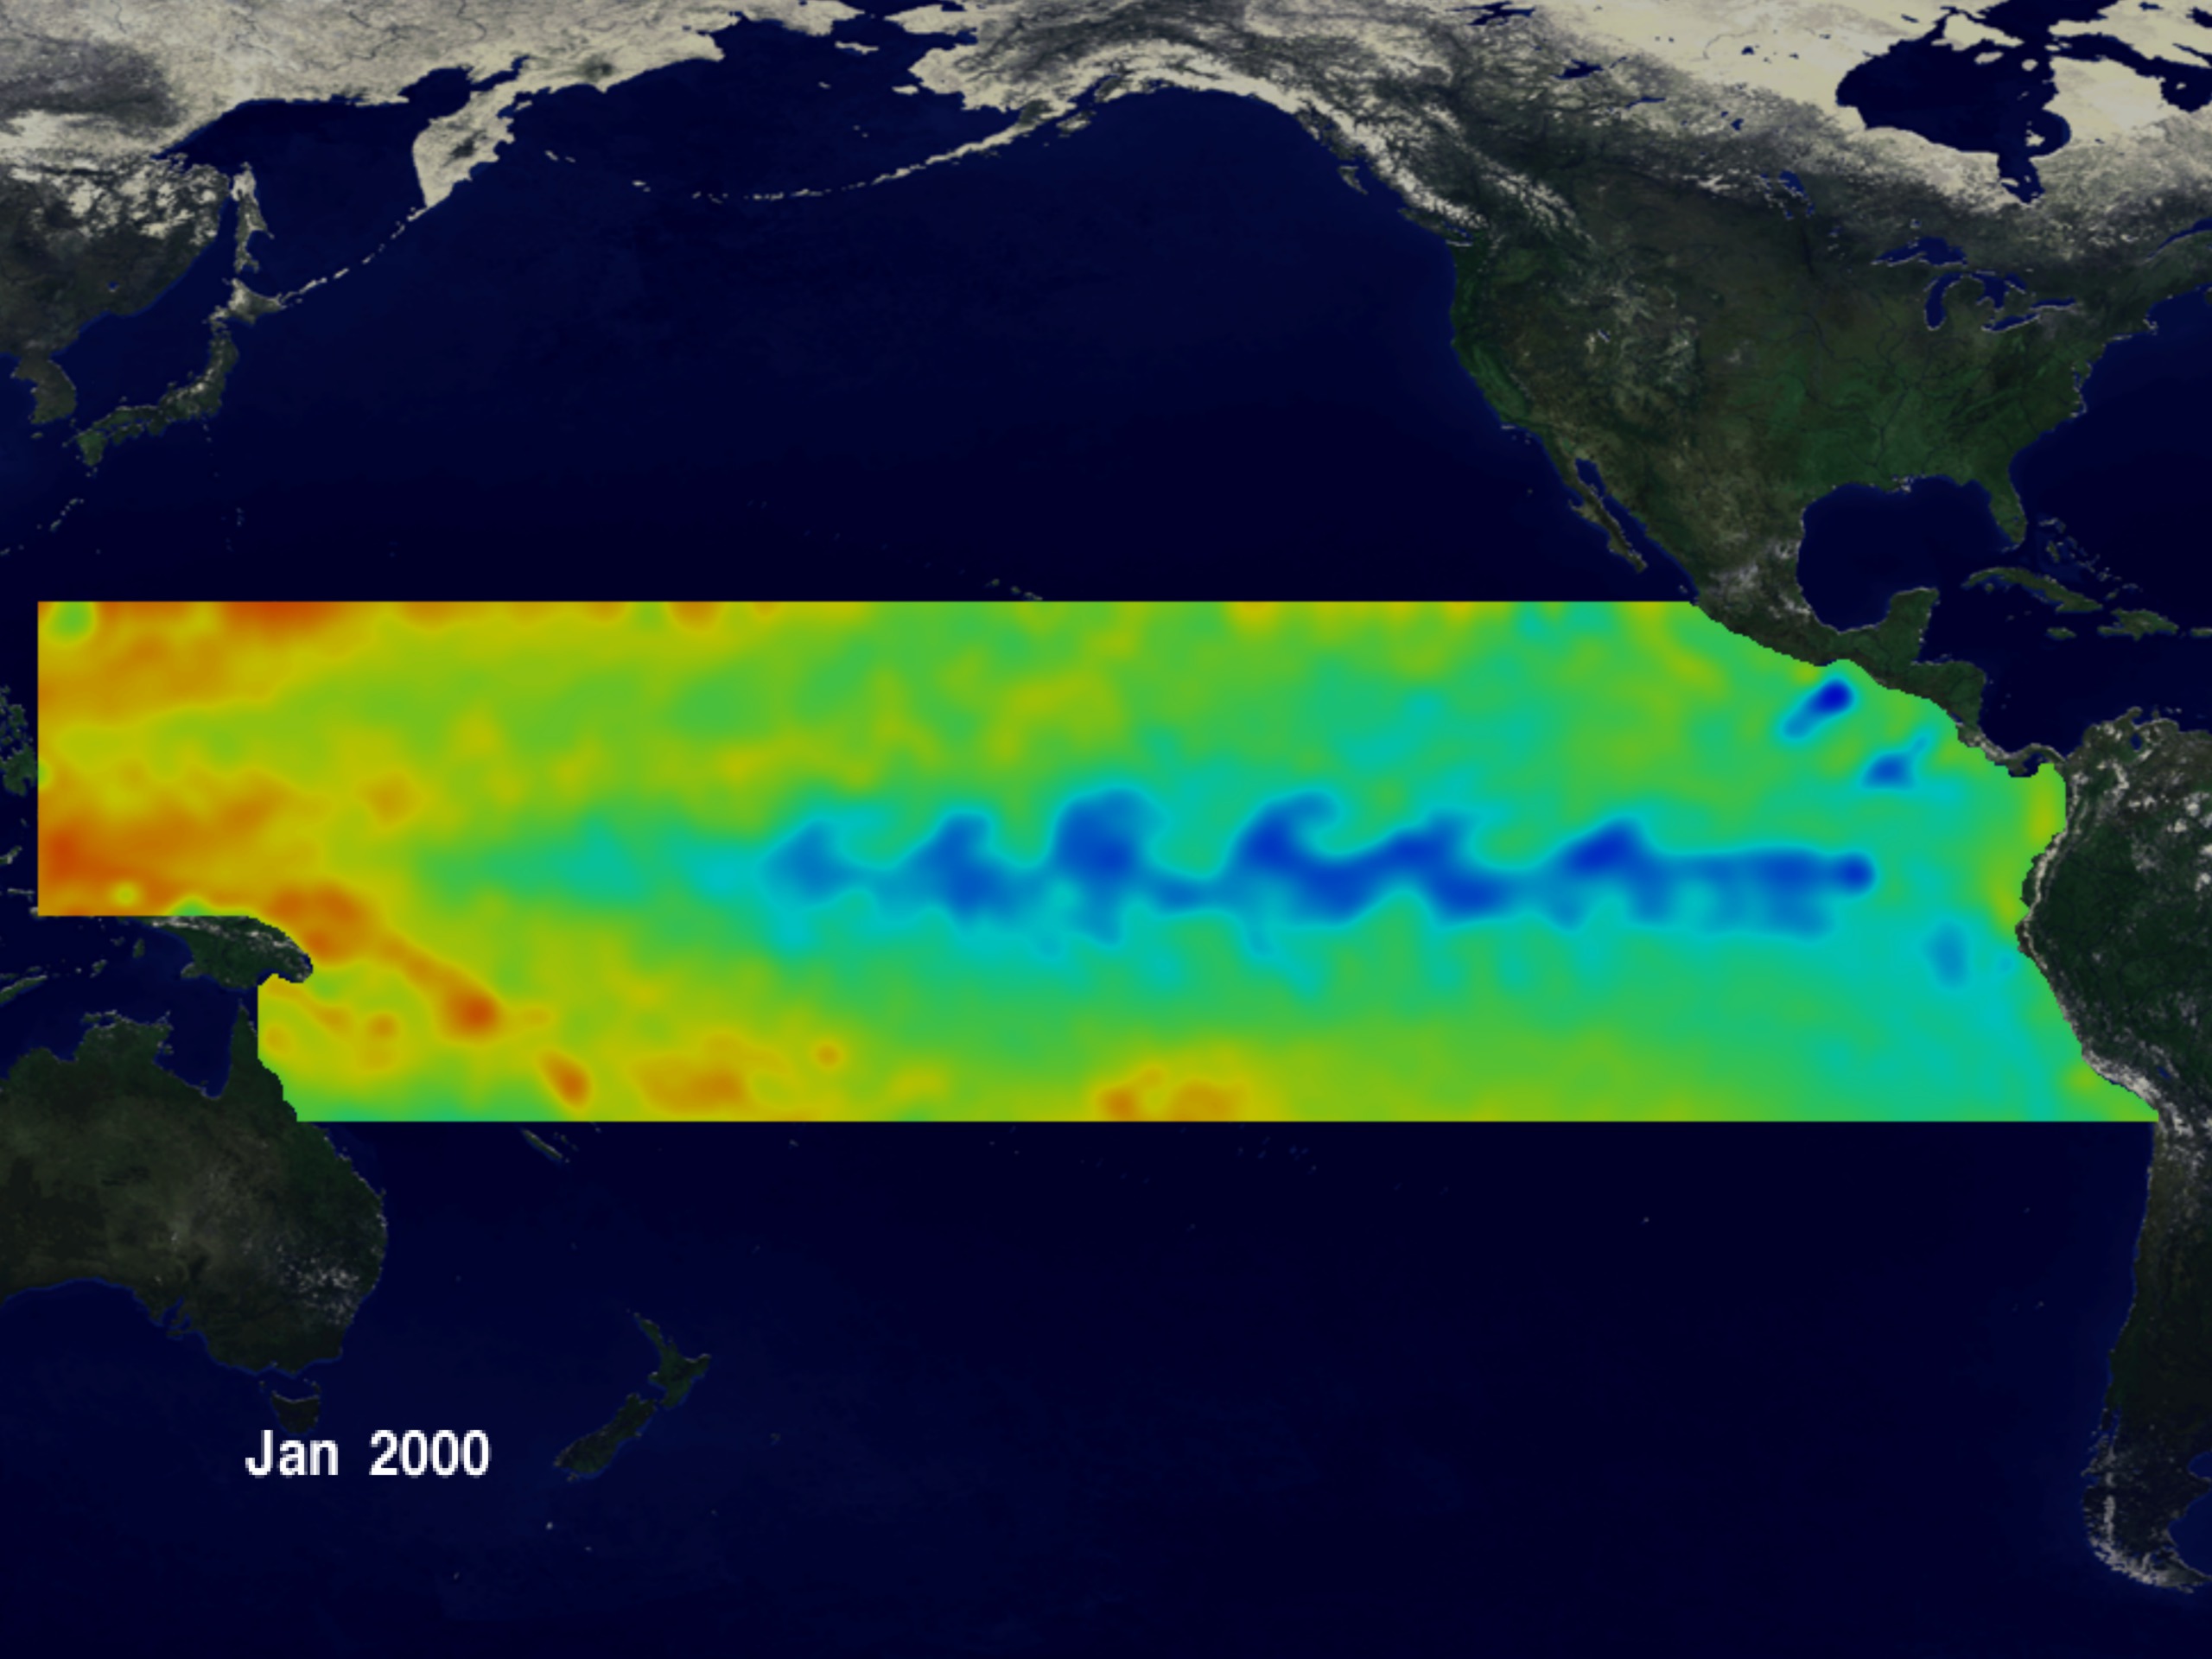
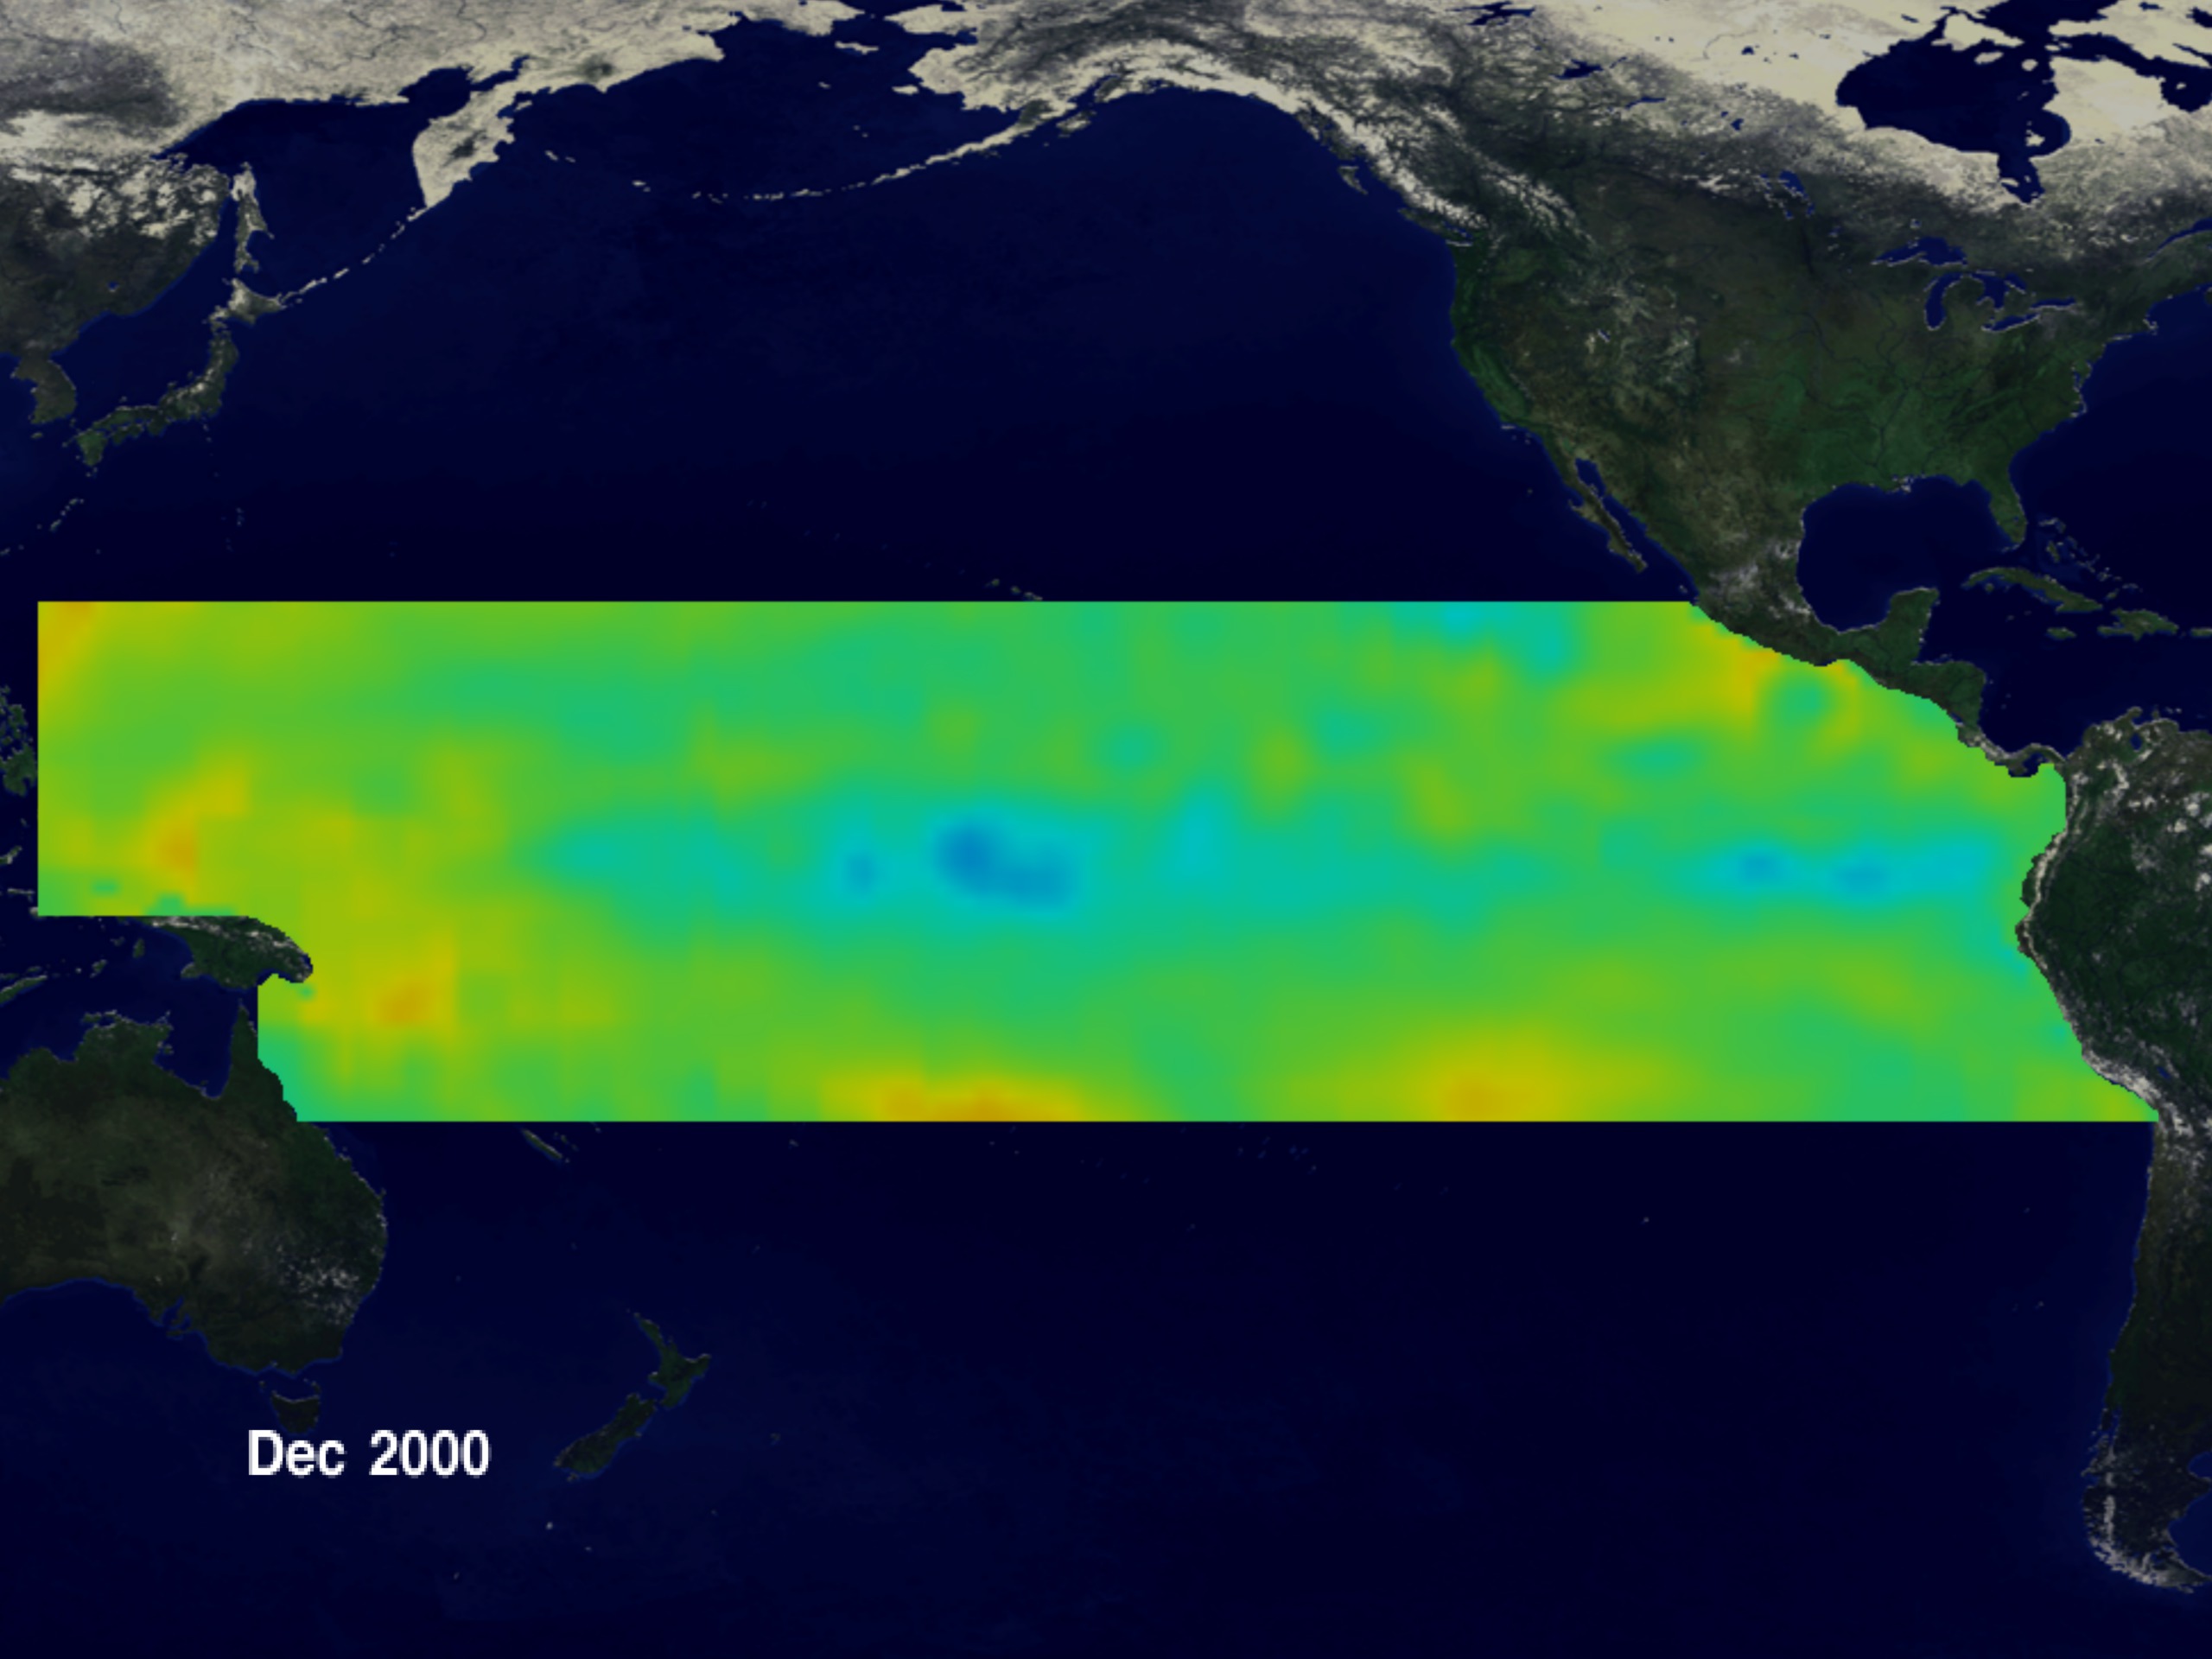

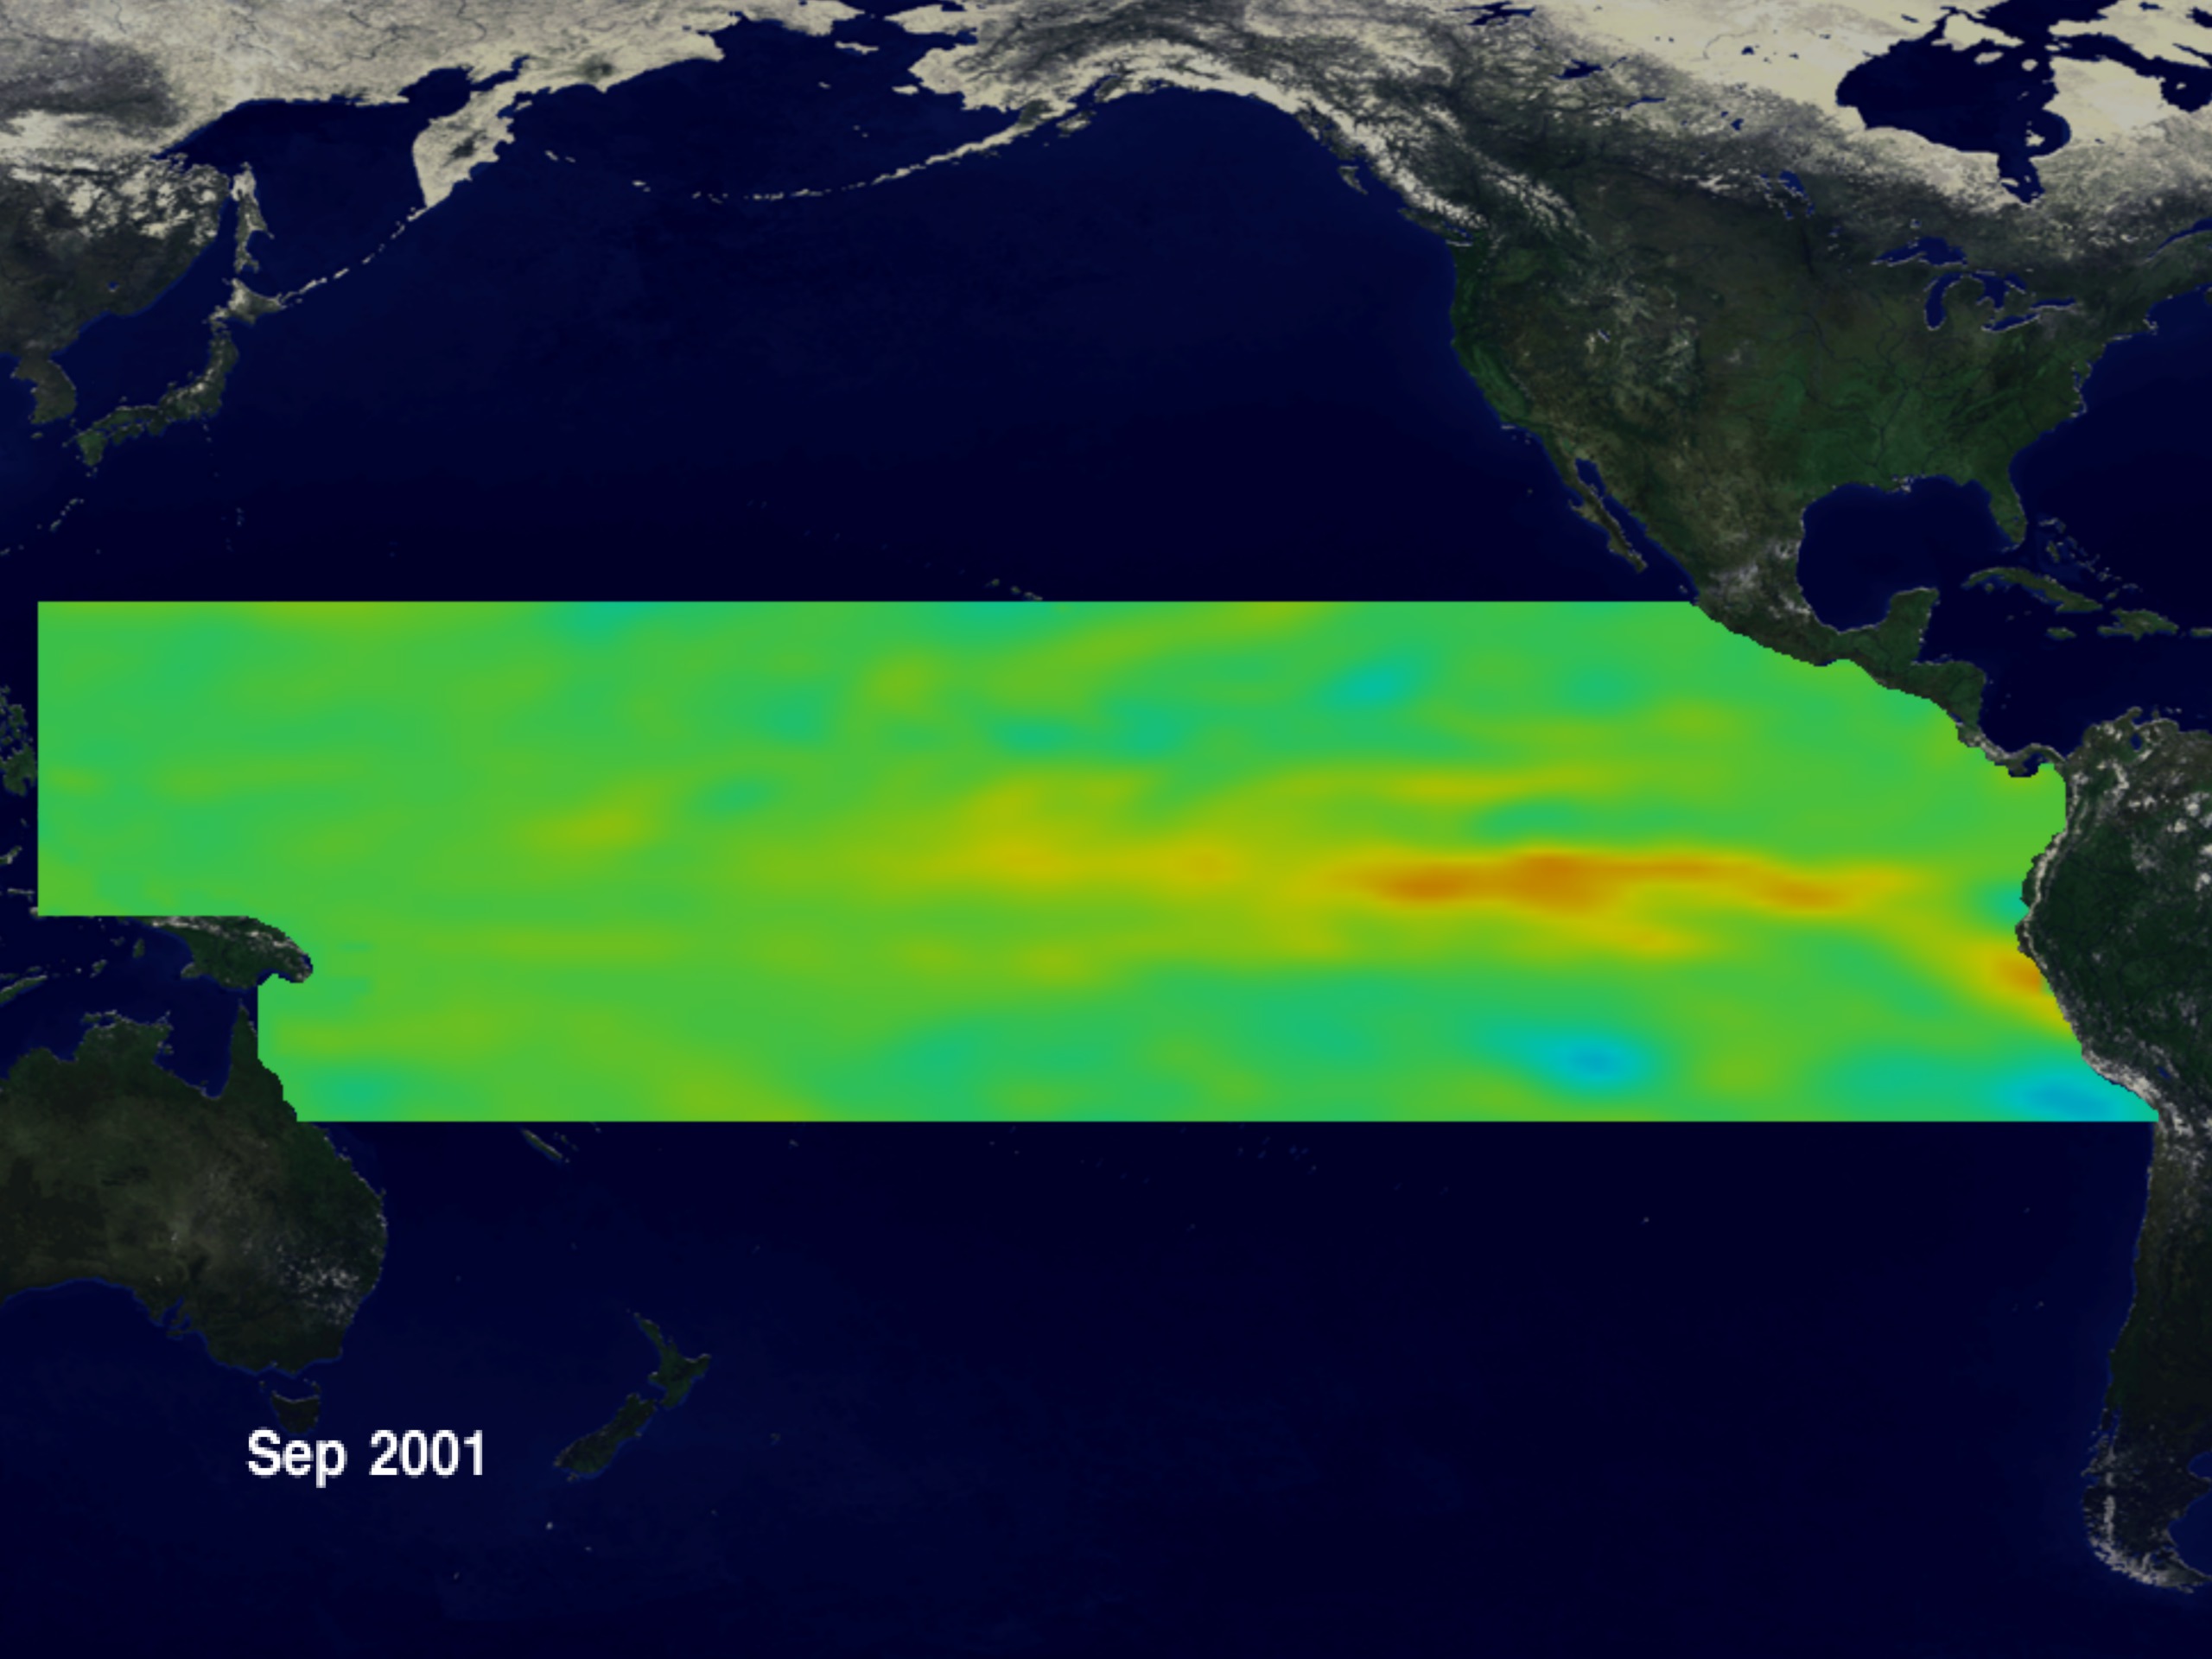
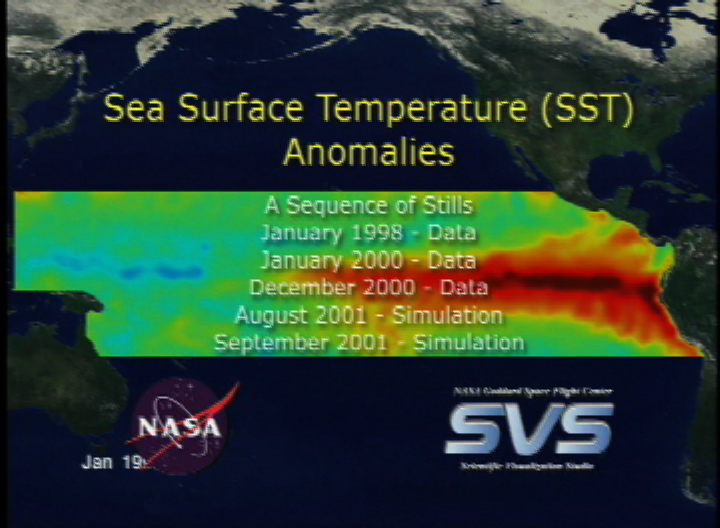
El Niño-La Niña Sea Surface Temperature Anomalies from NSIPP: January 1998 through September 2001
Visualization Credits
Tom Bridgman (Global Science and Technology, Inc.): Lead Animator
David Adamec (NASA/GSFC): Scientist
David Adamec (NASA/GSFC): Scientist
Please give credit for this item to:
NASA/Goddard Space Flight Center Scientific Visualization Studio
NASA/Goddard Space Flight Center Scientific Visualization Studio
Short URL to share this page:
https://svs.gsfc.nasa.gov/2057
Data Used:
Note: While we identify the data sets used in these visualizations, we do not store any further details nor the data sets themselves on our site.
Dates of Data Used:
1998/01, 2000/01, 2000/12, 2001/08, 2001/09
This item is part of this series:
El Niño and La Niña
Keywords:
DLESE >> Atmospheric science
DLESE >> Hydrology
SVS >> NSIPP
NASA Science >> Earth
https://svs.gsfc.nasa.gov/2057
Data Used:
GEMS/Sea Surface Temperature Anomaly
Model - NASA NSIPP - 1998/01, 2000/01, 2000/12, 2001/08, 2001/09
GEMS stands for Goddard Earth Modeling System. It is also known as the NSIPP Global Climate Model.
Dates of Data Used:
1998/01, 2000/01, 2000/12, 2001/08, 2001/09
This item is part of this series:
El Niño and La Niña
Keywords:
DLESE >> Atmospheric science
DLESE >> Hydrology
SVS >> NSIPP
NASA Science >> Earth


