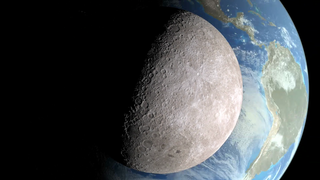
Earth
ID: 11012
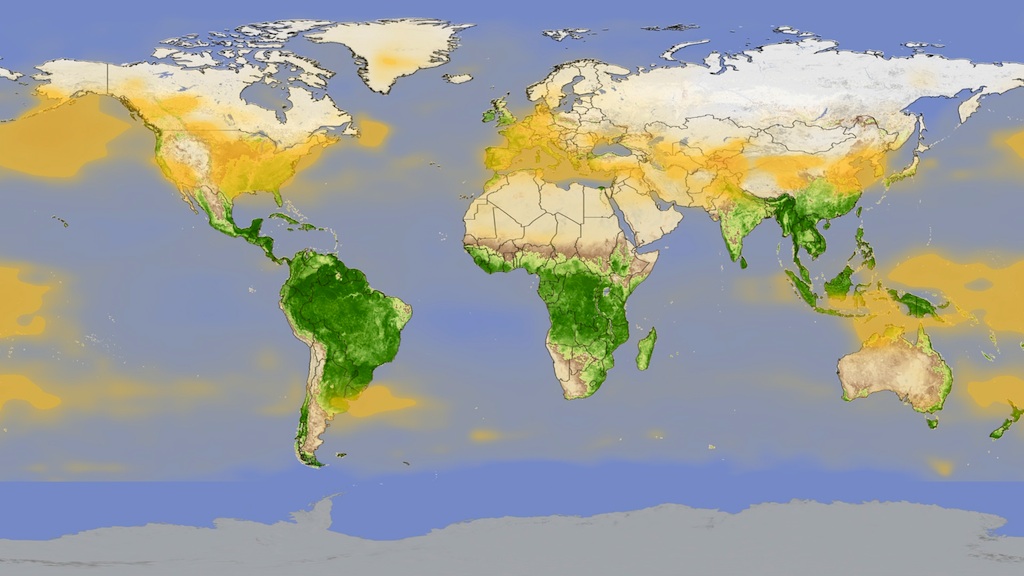
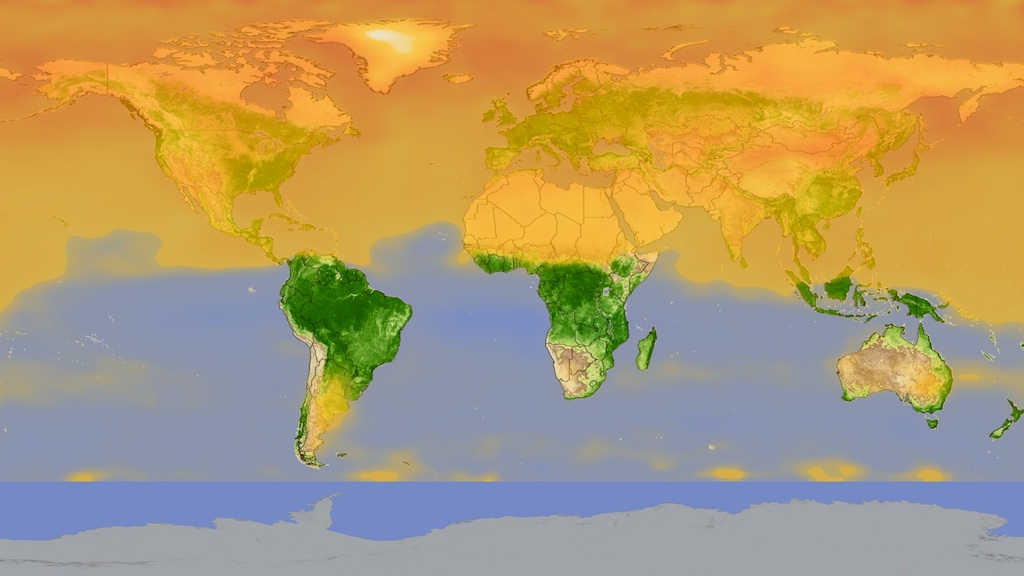
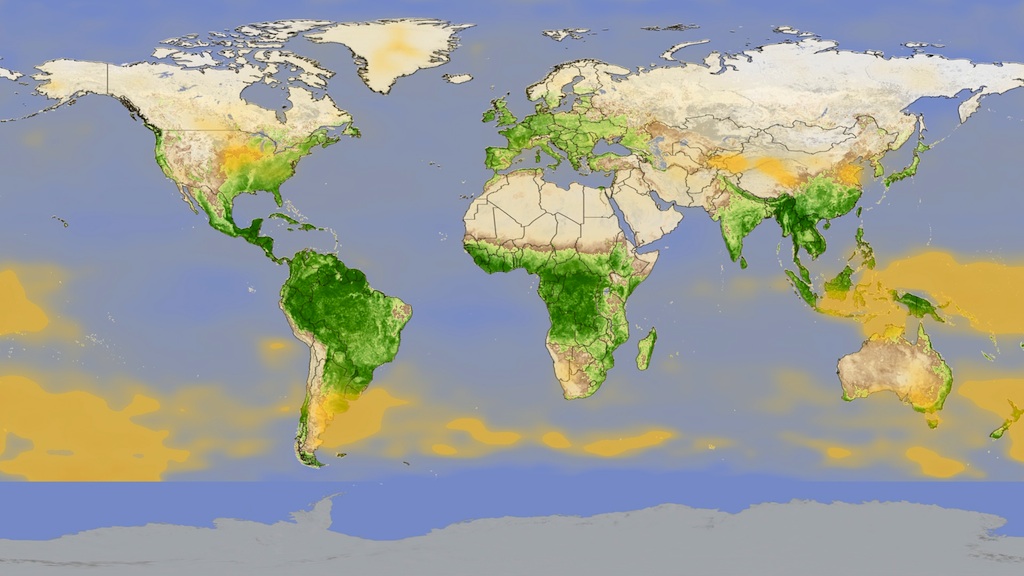
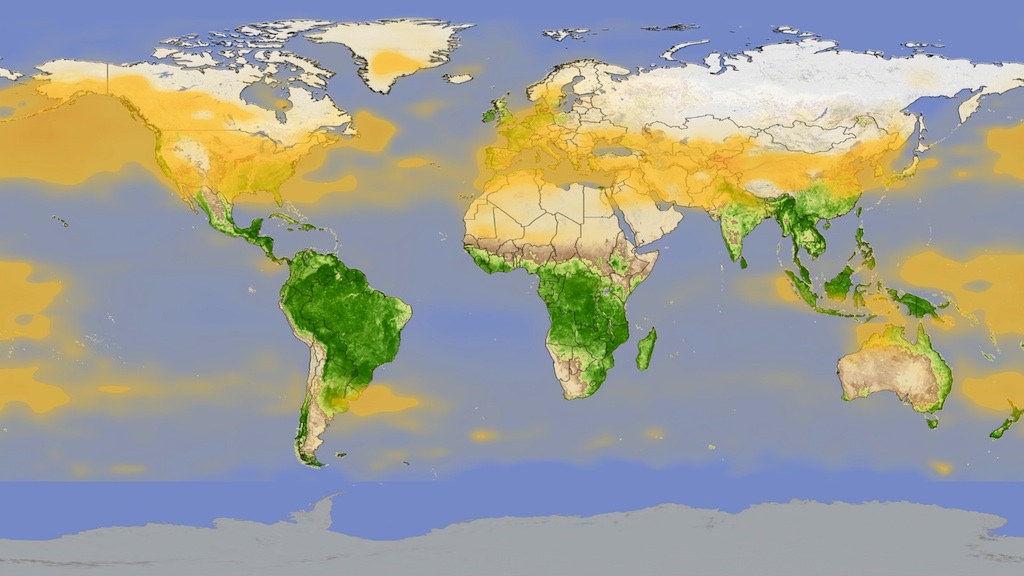
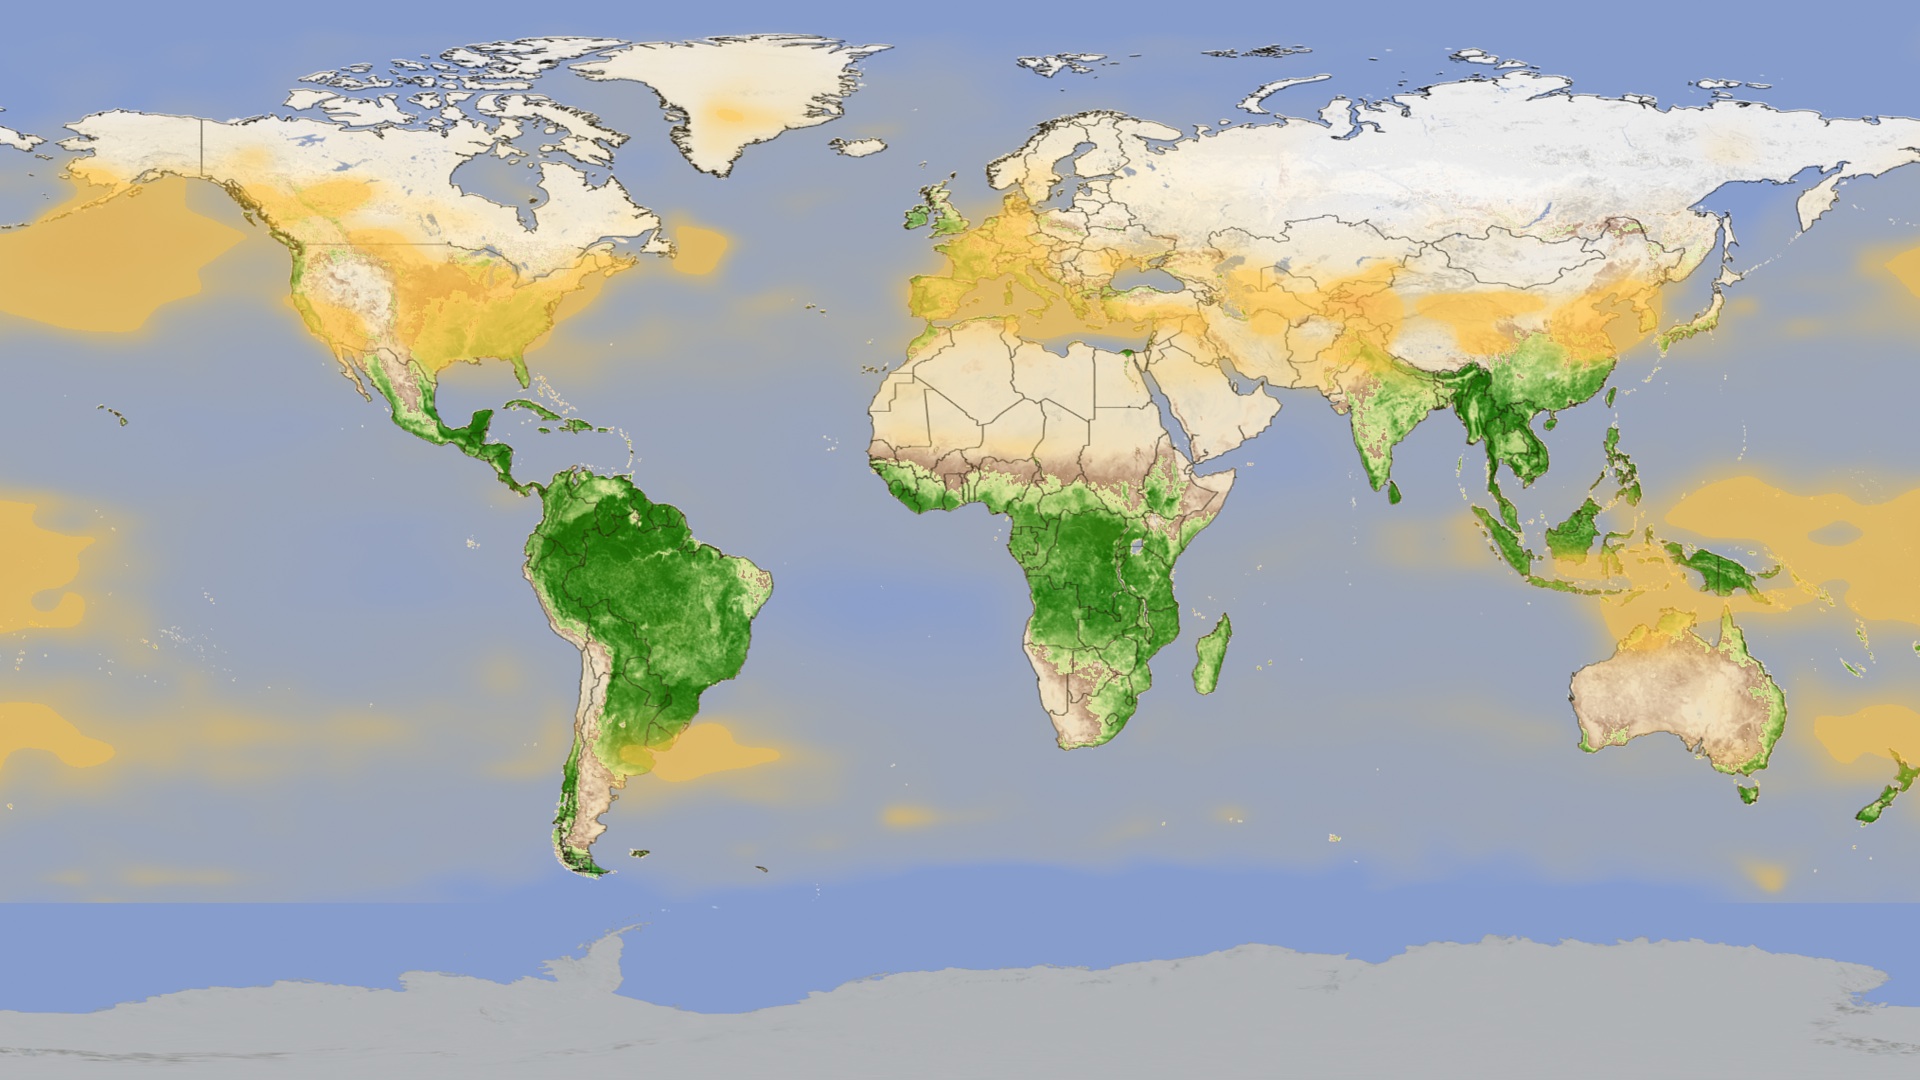
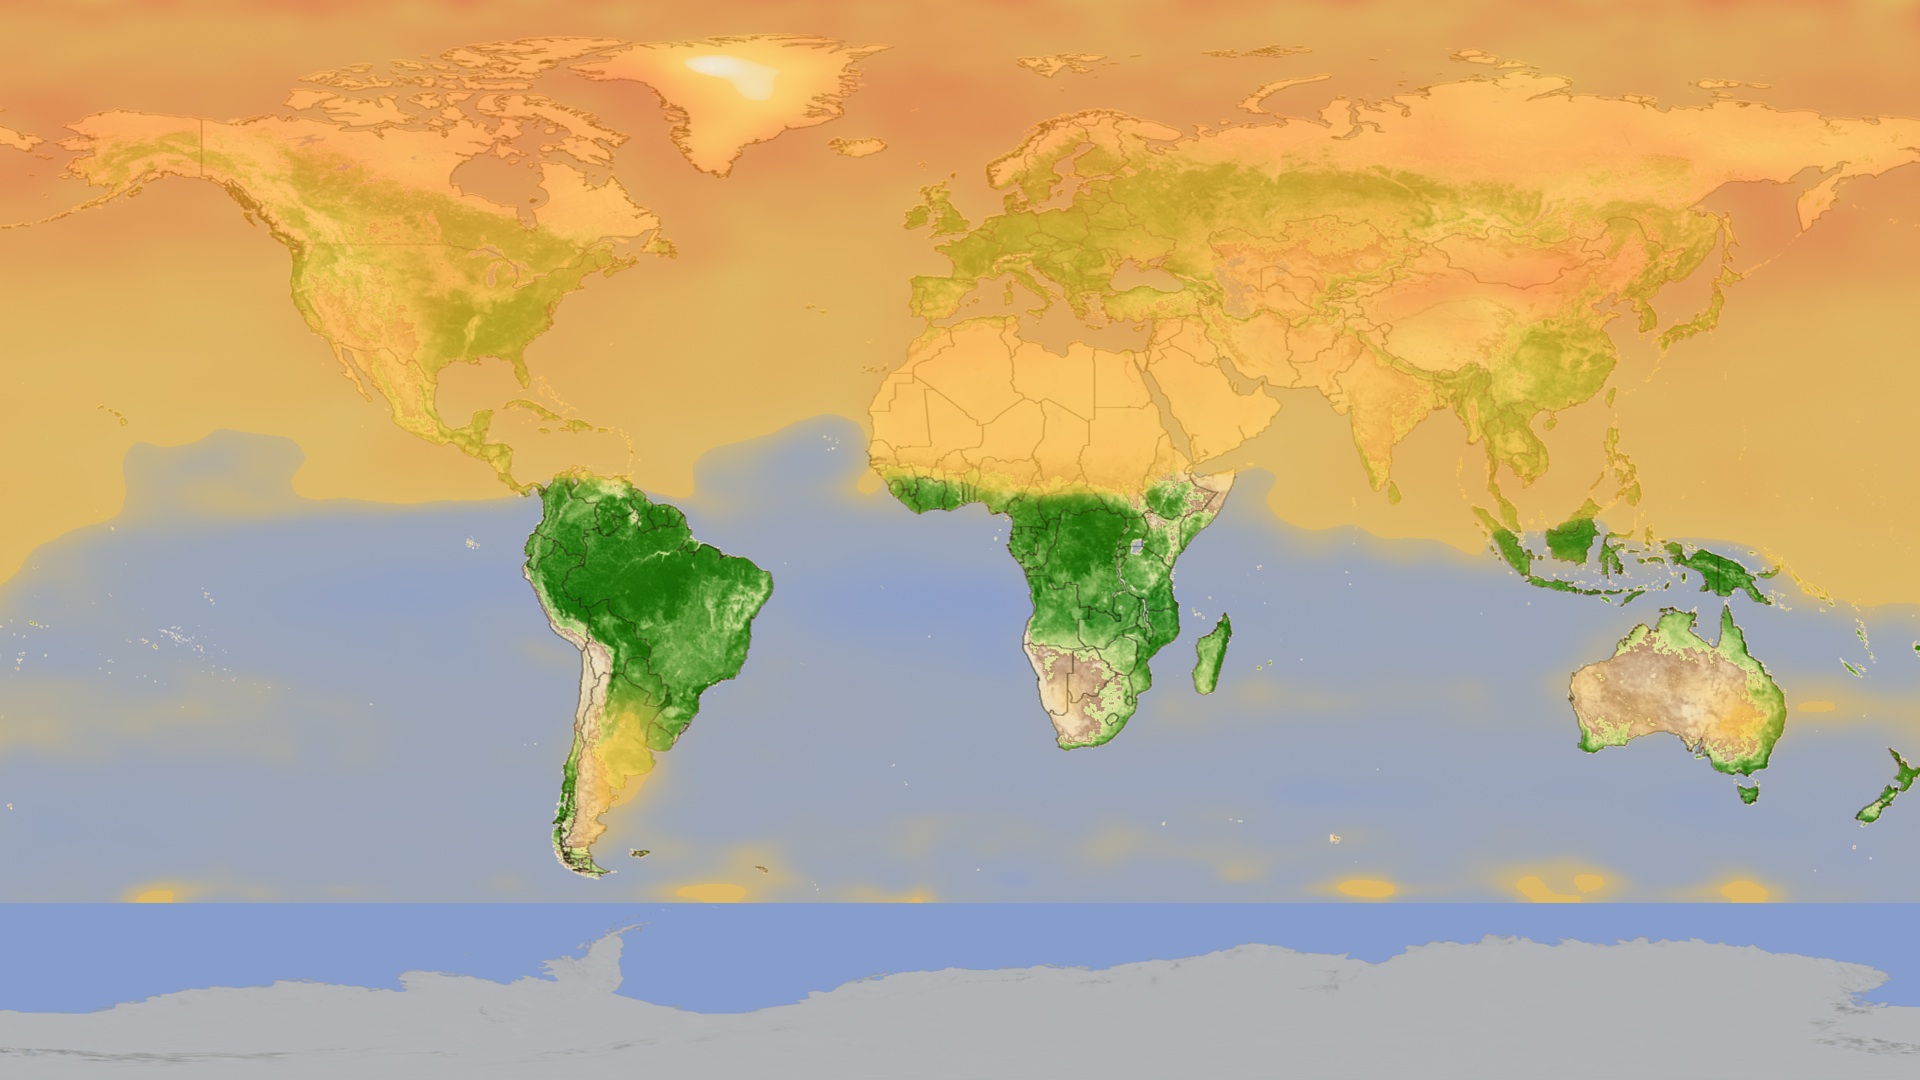
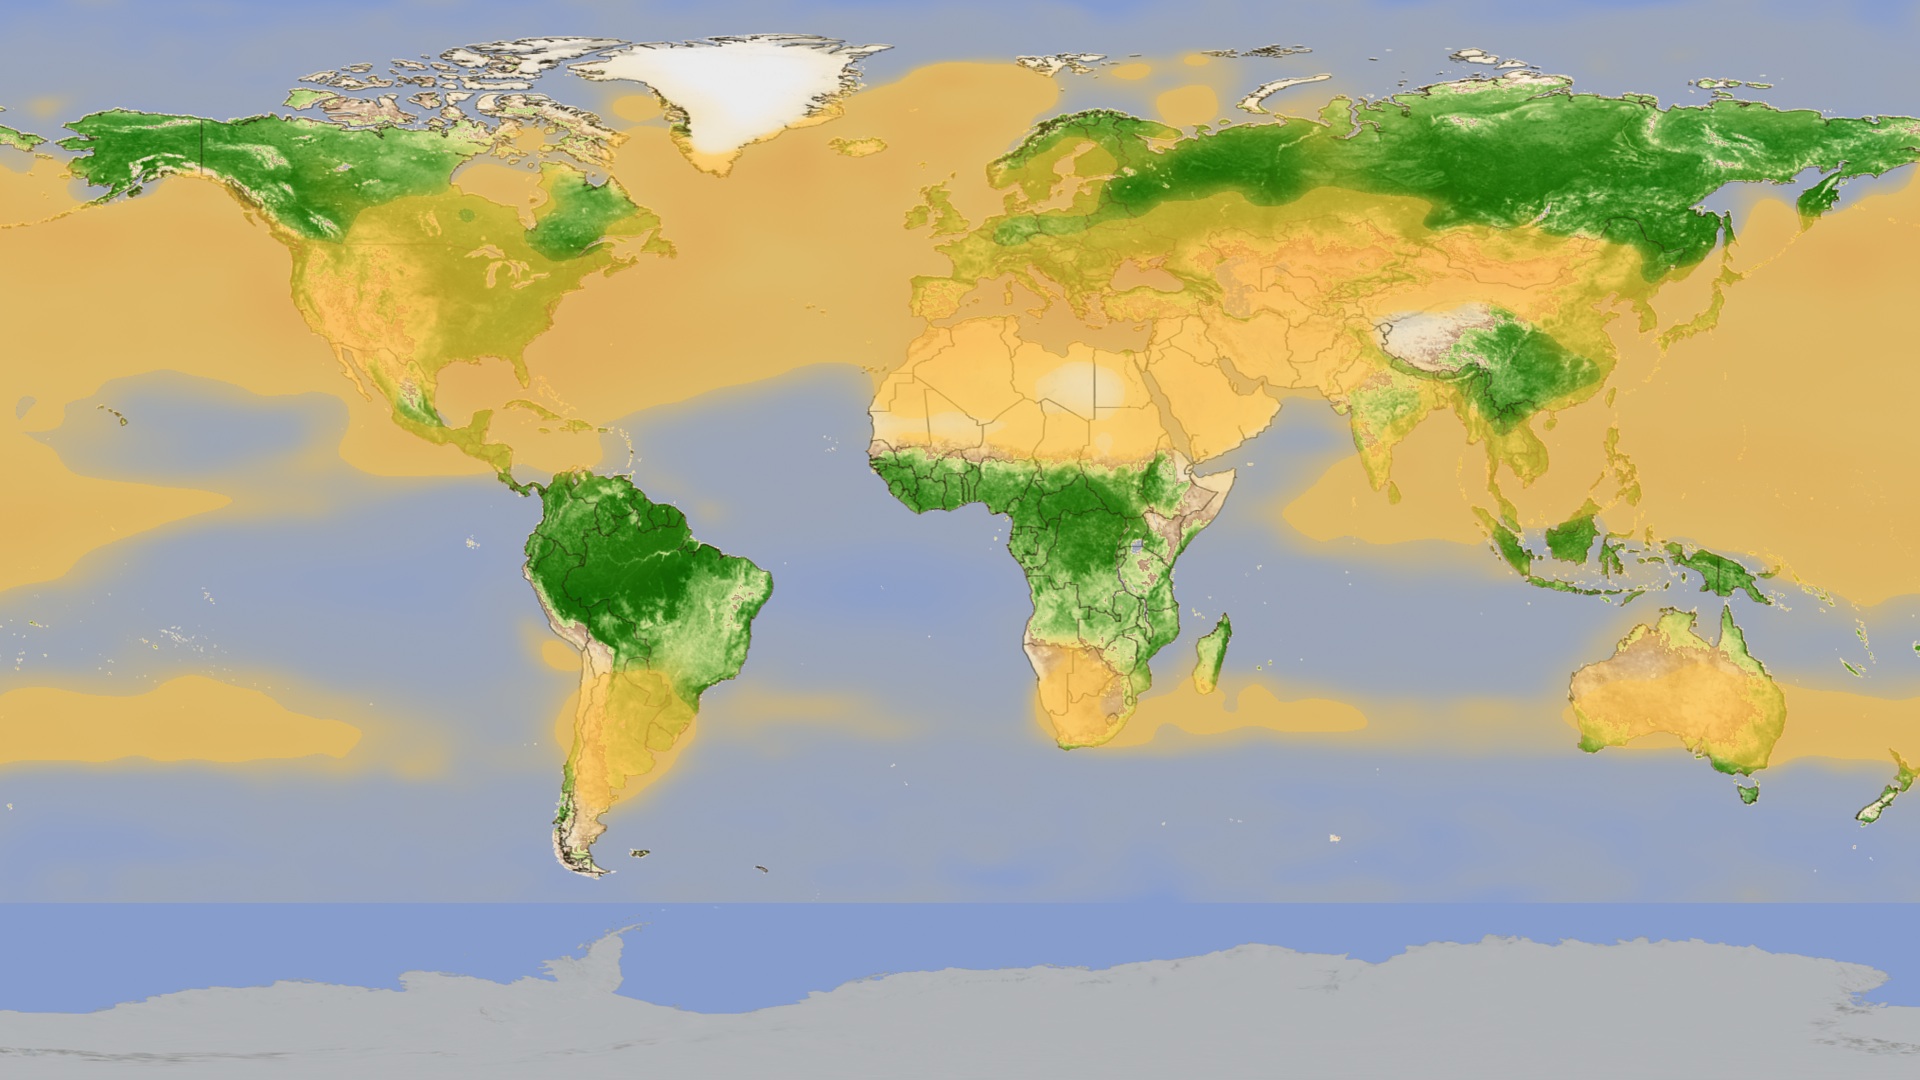
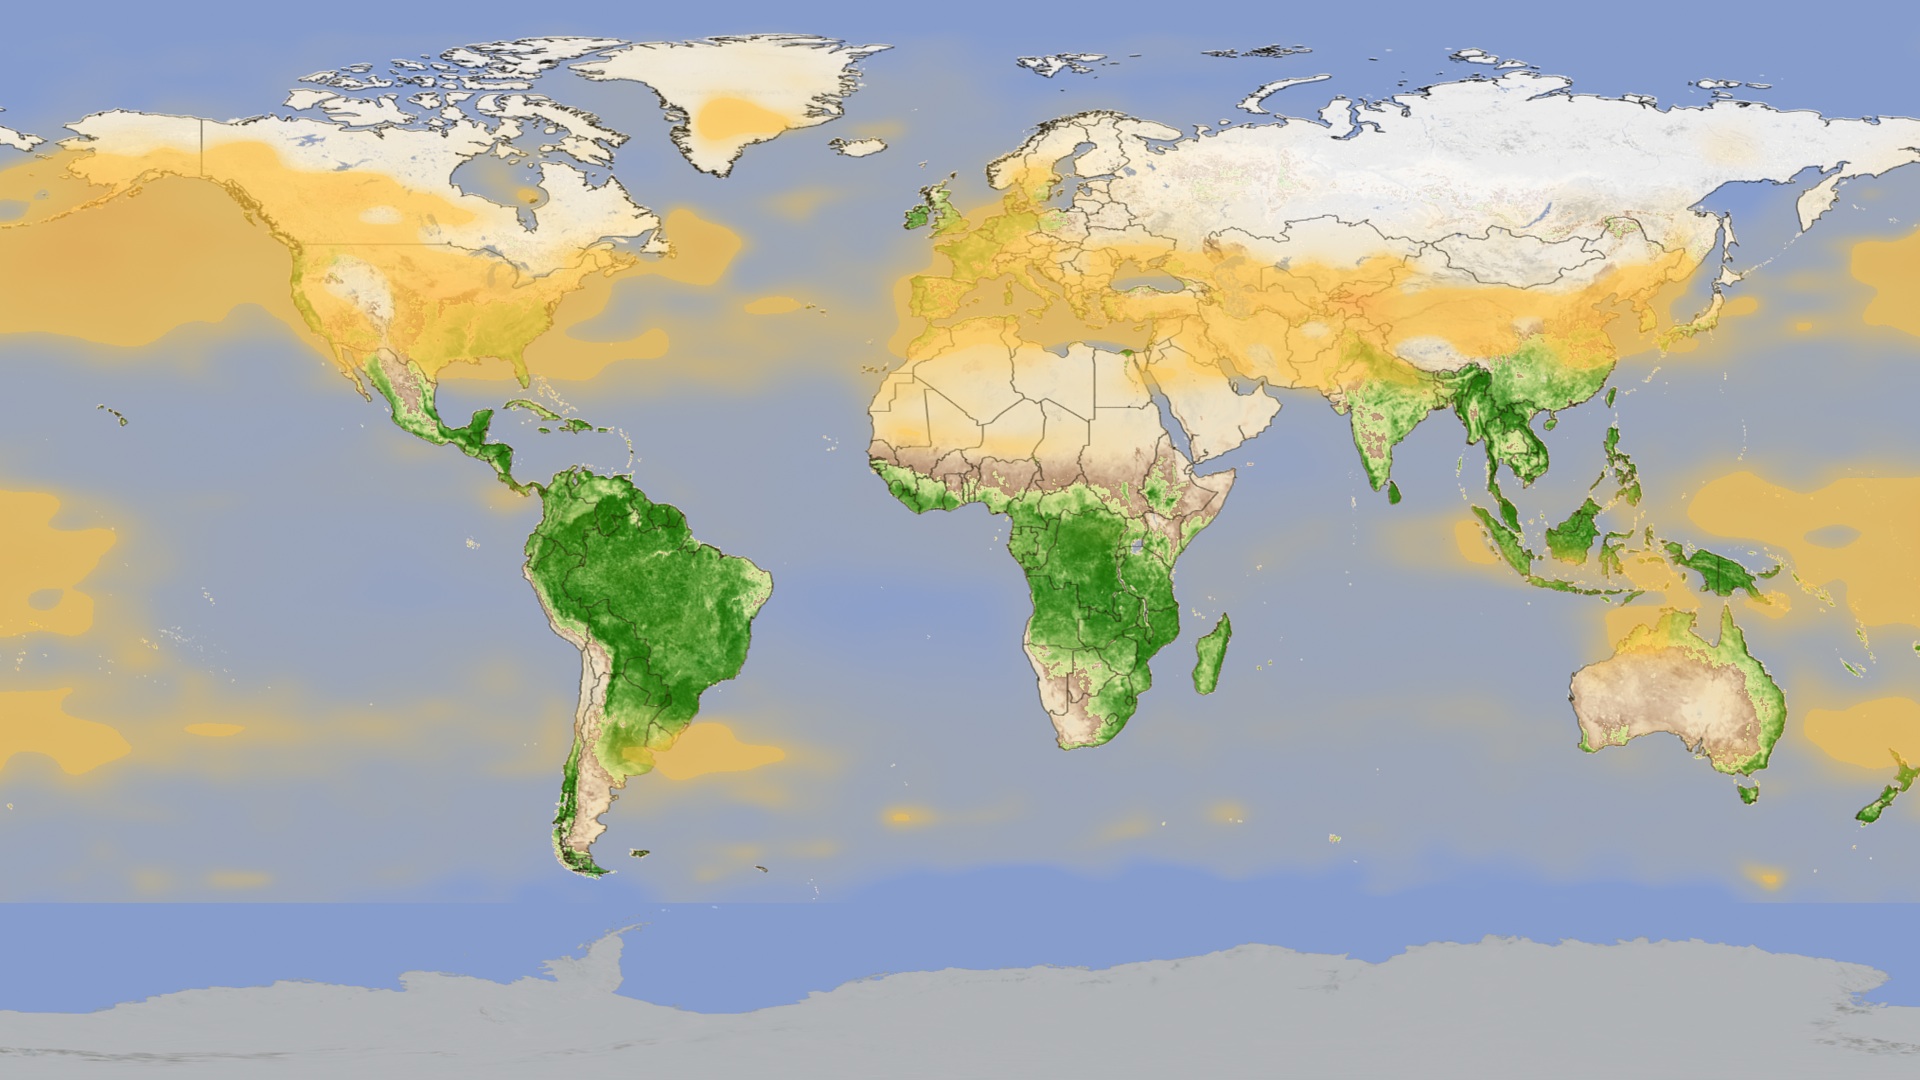
Globally, carbon dioxide levels remain on a steady, long-term rise. However, concentrations of the heat-trapping gas are distributed unevenly around the world and change with the seasons. NASA's ability to track these changes by satellite, first achieved in 2008, provides a new way to study the interaction between carbon dioxide and the vegetation that absorbs it from the atmosphere. As plant life begins to draw the greenhouse gas from the air each spring, carbon dioxide levels plunge. When plants go dormant in winter, levels start to rise. The visualization illustrates this relationship by layering NASA satellite data of carbon dioxide levels over a global map of vegetation growth from 2003 to 2006. Notice the cyclical changes in carbon dioxide levels in the Northern Hemisphere compared to the Southern Hemisphere. The significantly larger population and landmass north of the equator makes for both increased human-caused emissions and carbon dioxide absorption.

A Sky For All Seasons
For More Information
Story Credits
Lead Visualizer/Animator:
Lori Perkins (NASA/GSFC)
Narration:
Patrick Lynch (Wyle Information Systems)
Narrator:
Patrick Lynch (Wyle Information Systems)
Producer:
Kayvon Sharghi (USRA)
Lead Writer:
Patrick Lynch (Wyle Information Systems)
Lori Perkins (NASA/GSFC)
Narration:
Patrick Lynch (Wyle Information Systems)
Narrator:
Patrick Lynch (Wyle Information Systems)
Producer:
Kayvon Sharghi (USRA)
Lead Writer:
Patrick Lynch (Wyle Information Systems)
Please give credit for this item to:
NASA's Goddard Space Flight Center
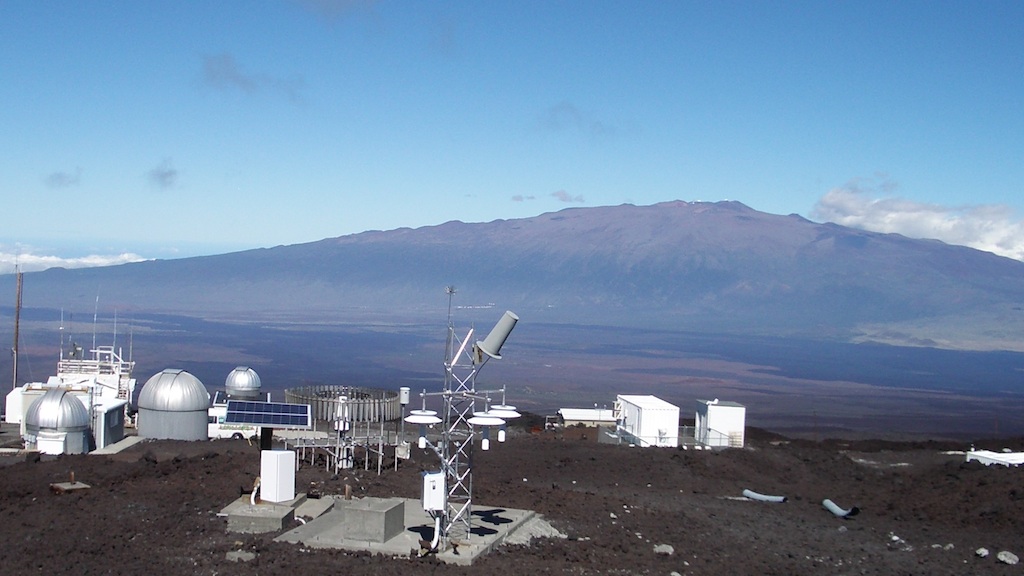
Mauna Loa image courtesy of NOAA's U.S. Climate Reference Network
NASA's Goddard Space Flight Center
Mauna Loa image courtesy of NOAA's U.S. Climate Reference Network
Short URL to share this page:
https://svs.gsfc.nasa.gov/11012
Keywords:
DLESE >> Narrated
SVS >> App
NASA Science >> Earth
https://svs.gsfc.nasa.gov/11012
Keywords:
DLESE >> Narrated
SVS >> App
NASA Science >> Earth

