Earth
ID: 1049
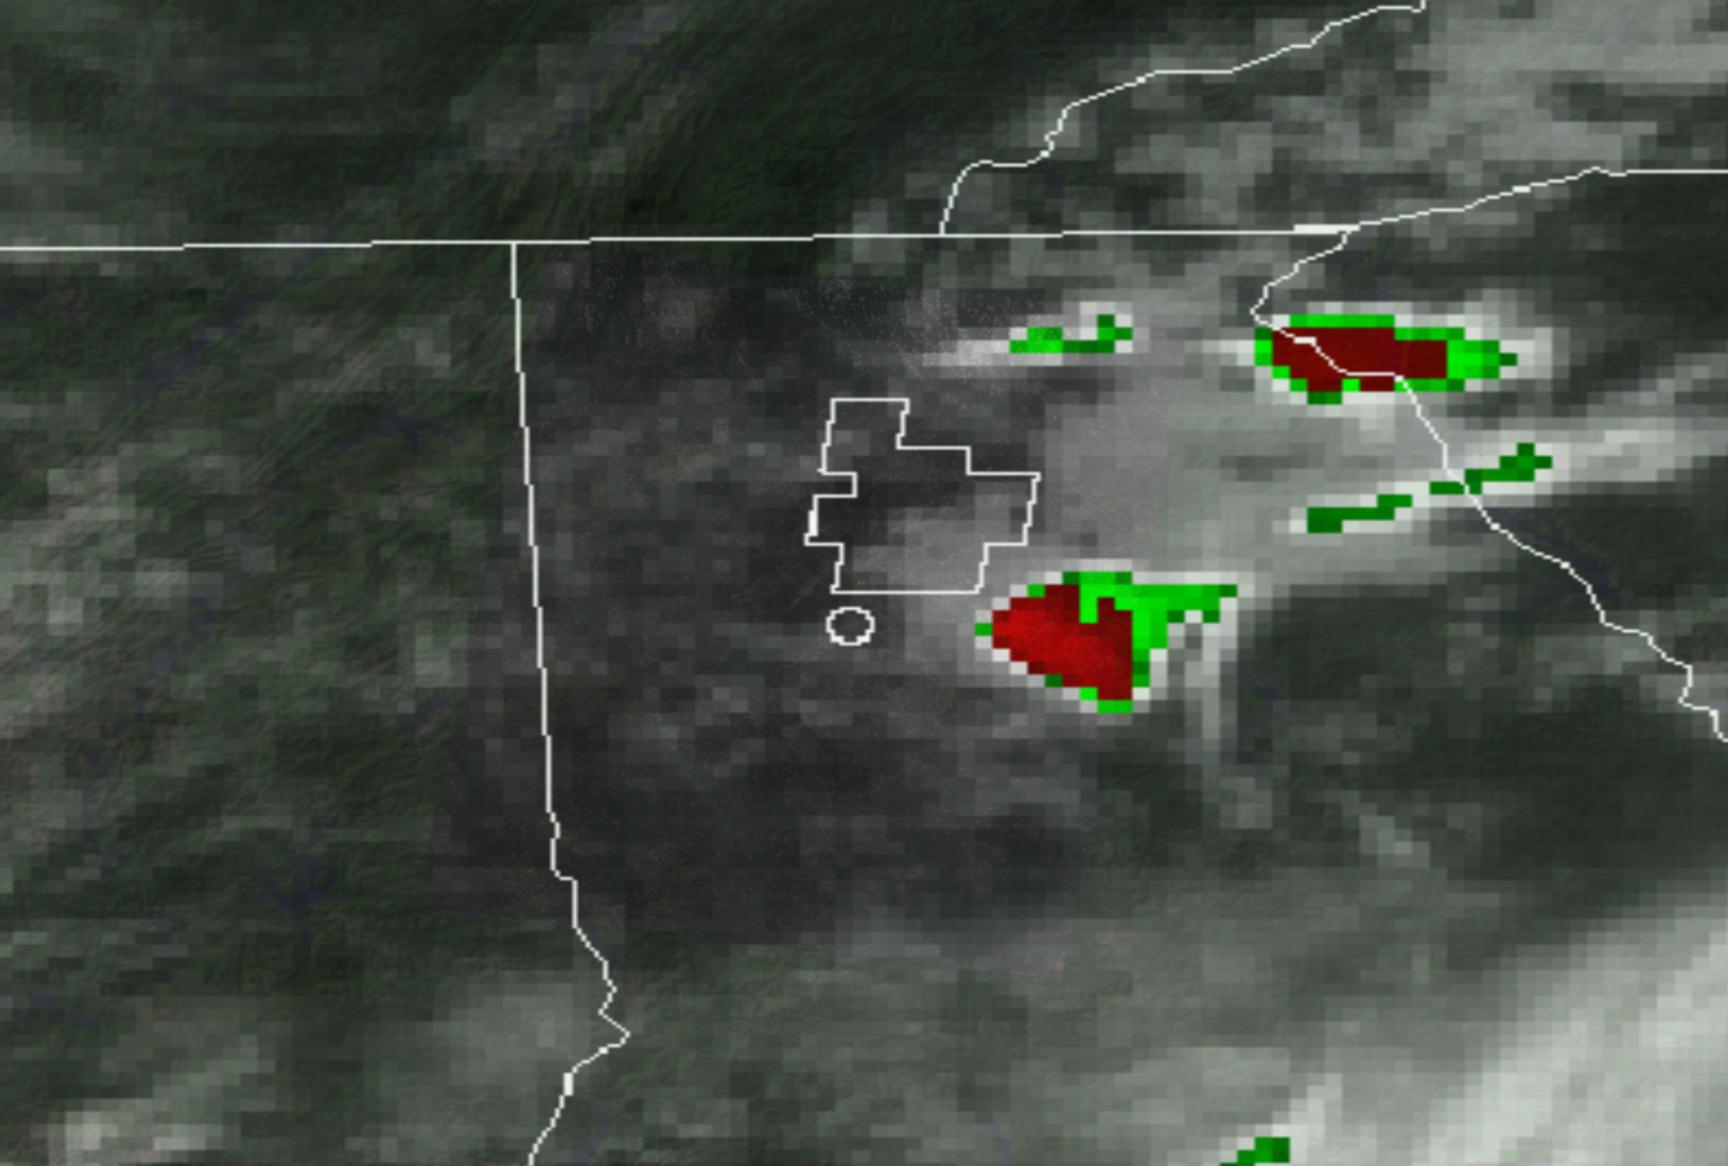
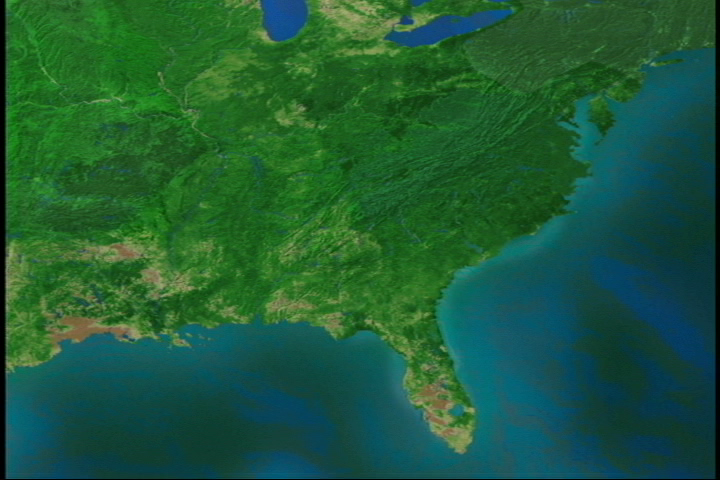
Zoom in showing true color, then changing to daytime thermal, then nighttime thermal, using mountain top, Landsat, ATLAS thermal, land use, and clouds/convection data
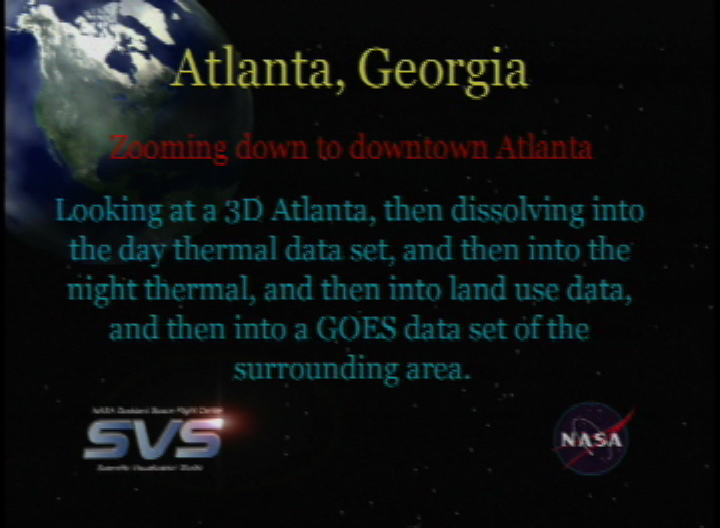
3D Atlanta Heat Island
For More Information
Visualization Credits
Greg Shirah (NASA/GSFC): Lead Animator
Tom Bridgman (Global Science and Technology, Inc.): Animator
Dale Quattrochi (NASA/MSFC): Scientist
Tom Bridgman (Global Science and Technology, Inc.): Animator
Dale Quattrochi (NASA/MSFC): Scientist
Please give credit for this item to:
NASA/Goddard Space Flight Center Scientific Visualization Studio
NASA/Goddard Space Flight Center Scientific Visualization Studio
Short URL to share this page:
https://svs.gsfc.nasa.gov/1049
Mission:
Landsat
Data Used:
Note: While we identify the data sets used in these visualizations, we do not store any further details nor the data sets themselves on our site.
This item is part of this series:
AAAS
Goddard TV Tape:
G2000-015
Keywords:
SVS >> Atlanta
SVS >> Heat Island
DLESE >> Human geography
SVS >> Sprawl
SVS >> Urban
SVS >> GOES
NASA Science >> Earth
https://svs.gsfc.nasa.gov/1049
Mission:
Landsat
Data Used:
ATLAS
1997/05/11-1997/05/12Landsat-5/TM
1973, 1979, 1983, 1987, 1992, 1997, 1998/06/27This item is part of this series:
AAAS
Goddard TV Tape:
G2000-015
Keywords:
SVS >> Atlanta
SVS >> Heat Island
DLESE >> Human geography
SVS >> Sprawl
SVS >> Urban
SVS >> GOES
NASA Science >> Earth


